| Param | Original file | Final file |
|---|---|---|
| Filename | modeM0/AS1A12_056T02_9000005538_40267cztM0_level2.fits | modeM0/AS1A12_056T02_9000005538_40267cztM0_level2_quad_clean.evt |
| Size (bytes) | 1,296,060,480 | 291,646,080 |
| Size | 1.2 GB | 278.1 MB |
| Events in quadrant A | 10,580,778 | 1,971,119 |
| Events in quadrant B | 9,196,664 | 2,041,009 |
| Events in quadrant C | 9,679,300 | 1,987,916 |
| Events in quadrant D | 17,094,694 | 1,561,667 |
| Mode M0 | |||
|---|---|---|---|
| Quadrant | BADHDUFLAG | Total packets | Discarded packets |
| A | 0 | 42423 | 5 |
| B | 0 | 39578 | 4 |
| C | 0 | 40103 | 4 |
| D | 0 | 63705 | 4 |
| Mode M9 | |||
|---|---|---|---|
| Quadrant | BADHDUFLAG | Total packets | Discarded packets |
| A | 0 | 53 | 0 |
| B | 0 | 53 | 0 |
| C | 0 | 53 | 0 |
| D | 0 | 54 | 0 |
| Mode SS | |||
|---|---|---|---|
| Quadrant | BADHDUFLAG | Total packets | Discarded packets |
| A | 0 | 372 | 0 |
| B | 0 | 372 | 0 |
| C | 0 | 372 | 0 |
| D | 0 | 372 | 0 |
| Quadrant | Total seconds | Saturated seconds | Saturation percentage |
|---|---|---|---|
| A | 18411 | 240 | 1.303569% |
| B | 18411 | 144 | 0.782141% |
| C | 18411 | 135 | 0.733257% |
| D | 18411 | 2736 | 14.860681% |
Noise dominated data is calculated using 1-second bins in cleaned event files. If a bin has >2000 counts, and if more than 50% of those come from <1% of pixels, then it is considered to be noise-dominated and hence unusable.
| Quadrant | # 1 sec bins | Bins with >0 counts | Bins with >2000 counts | High rate bins dominated by noise | Noise dominated (total time) | Noise dominated (detector-on time) | Marked lightcurve |
|---|---|---|---|---|---|---|---|
| A | 22440 | 18414 | 151 | 151 | 0.67% | 0.82% | 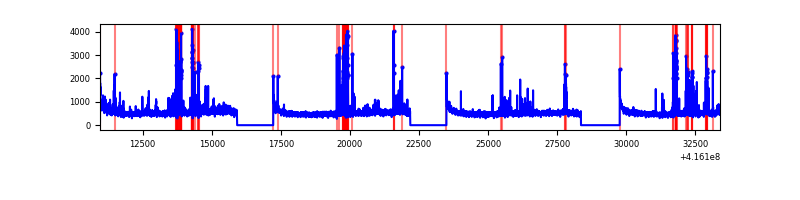 |
| B | 22440 | 18414 | 67 | 67 | 0.30% | 0.36% | 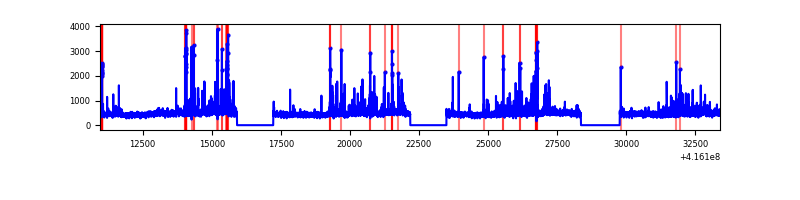 |
| C | 22440 | 18414 | 111 | 111 | 0.49% | 0.60% | 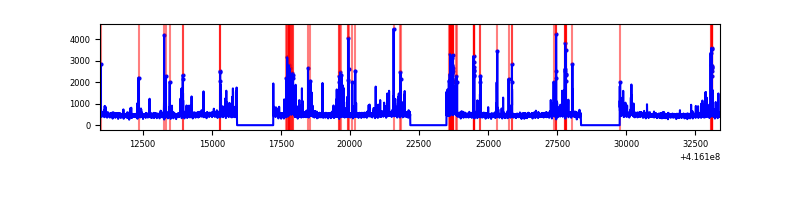 |
| D | 22440 | 18413 | 2263 | 2263 | 10.08% | 12.29% | 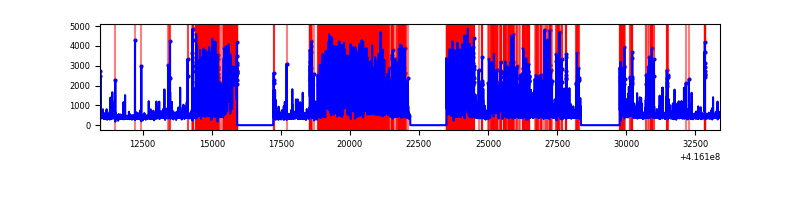 |
Top three noisy pixels from each quadrant. If the there are fewer than three noisy pixels in the level2.evt file, extra rows are filled as -1
| Pixel properties | Quadrant properties | ||||||
|---|---|---|---|---|---|---|---|
| Quadrant | DetID | PixID | Counts | Sigma | Mean | Median | Sigma |
| A | 10 | 83 | 1404418 | 3373.92 | 2043 | 2000 | 415.7 |
| A | 13 | 248 | 882863 | 2119.17 | 2043 | 2000 | 415.7 |
| A | 6 | 10 | 94189 | 221.79 | 2043 | 2000 | 415.7 |
| B | 4 | 171 | 431866 | 1095.45 | 2036 | 1974 | 392.4 |
| B | 5 | 255 | 318691 | 807.06 | 2036 | 1974 | 392.4 |
| B | 0 | 245 | 276169 | 698.71 | 2036 | 1974 | 392.4 |
| C | 14 | 254 | 1056396 | 2258.98 | 2005 | 2020 | 466.7 |
| C | 15 | 214 | 773191 | 1652.22 | 2005 | 2020 | 466.7 |
| C | 15 | 208 | 15153 | 28.14 | 2005 | 2020 | 466.7 |
| D | 12 | 0 | 5088716 | 11132.76 | 1865 | 1809 | 456.9 |
| D | 12 | 227 | 3255844 | 7121.5 | 1865 | 1809 | 456.9 |
| D | 1 | 47 | 789175 | 1723.16 | 1865 | 1809 | 456.9 |
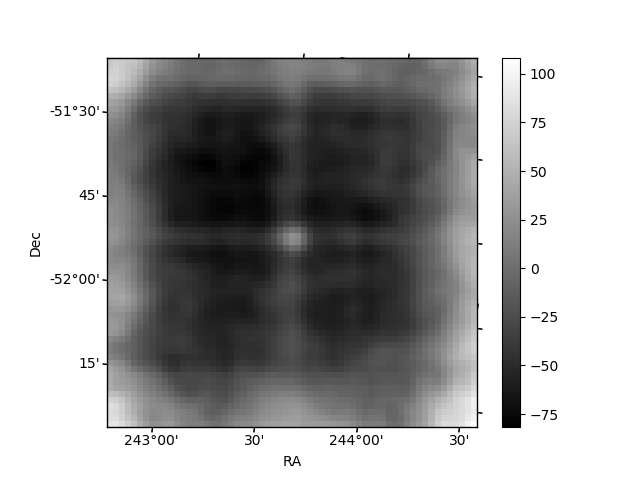
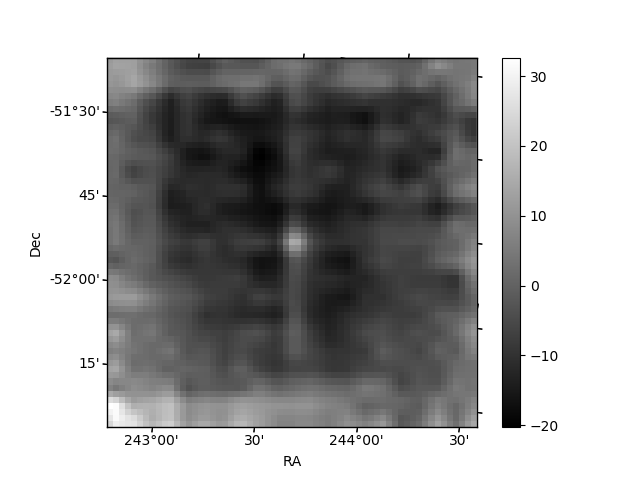
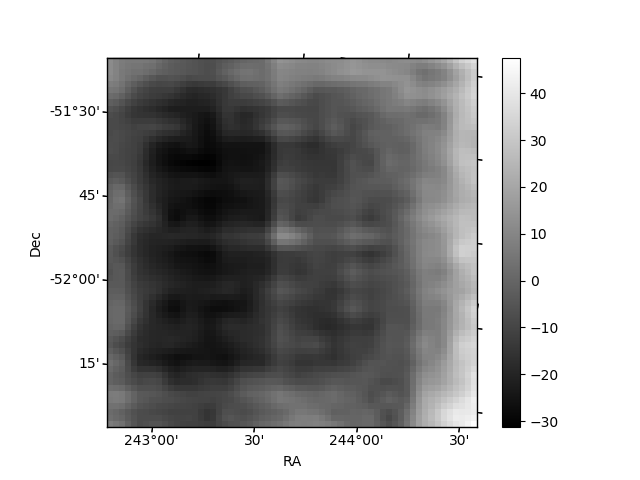
Histogram calculated using DETX and DETY for each event in the final _common_clean file
| Quadrant A | 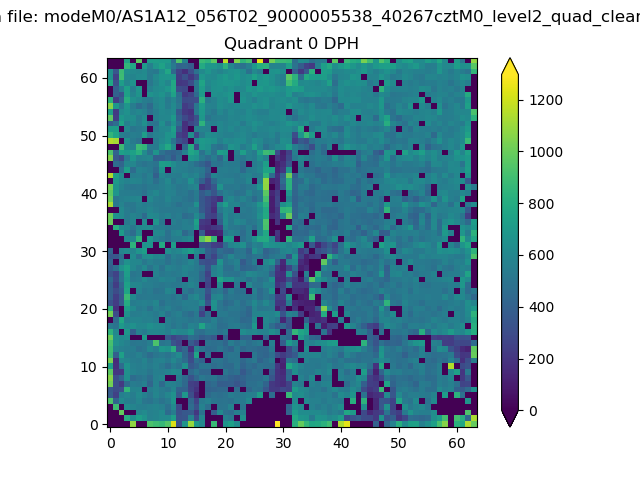 |
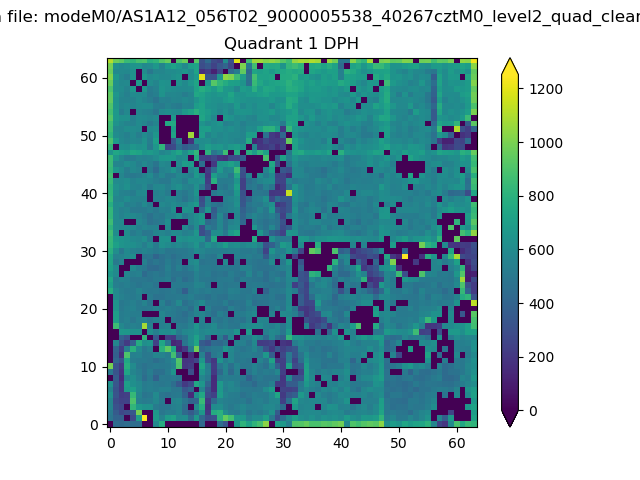 |
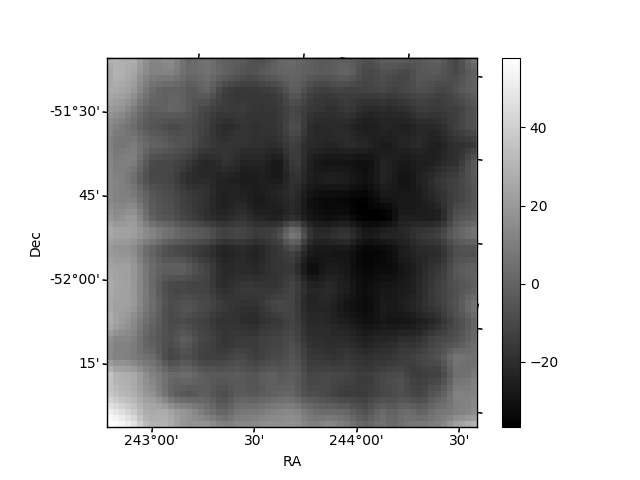
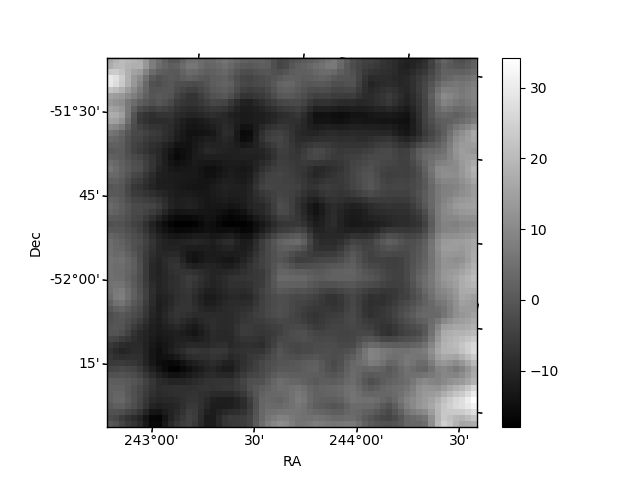
Quadrant B |
|---|---|---|---|
| Quadrant D | 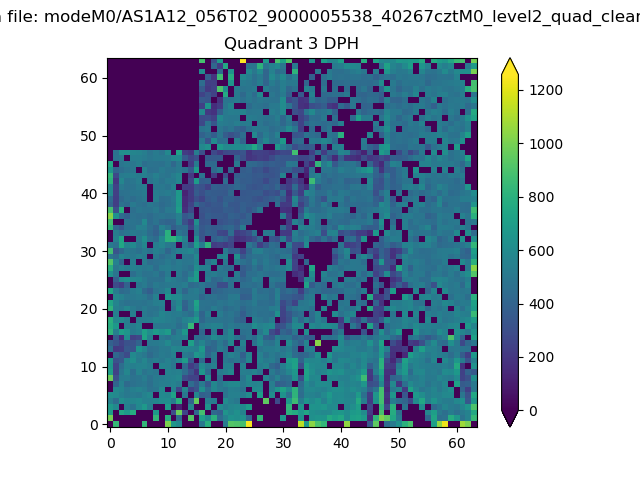 |
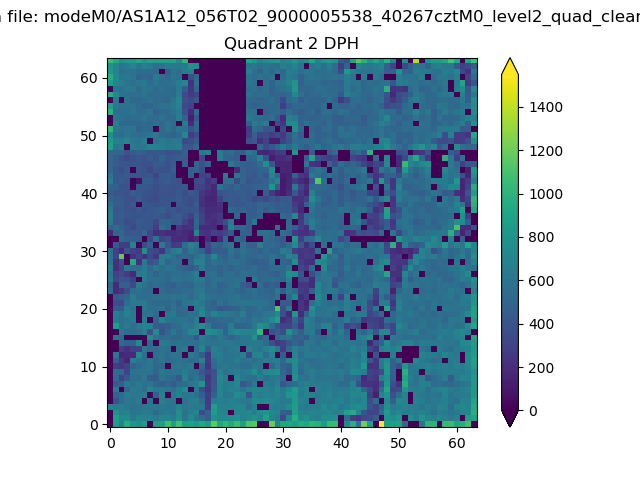 |
Quadrant C |
| Plot type | Count rate plots | Images |
|---|---|---|
| Comparison with Poisson distribution Blue bars denote a histogram of data divided into 1 sec bins. Red curve is a Poisson curve with rate = median count rate of data. |
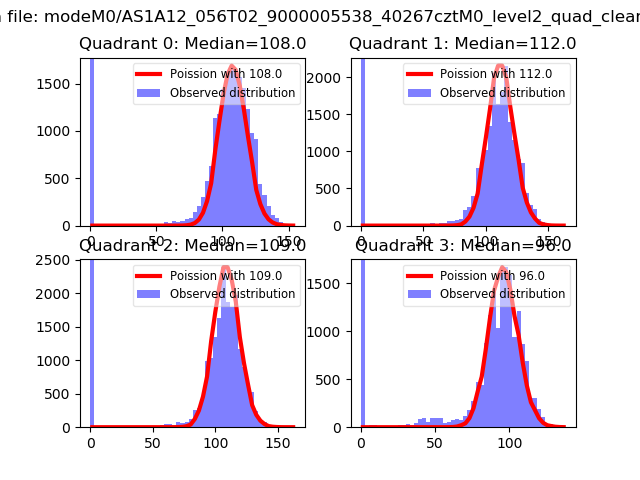 |
 |
| Quadrant-wise count rates Data is divided into 100 sec bins |
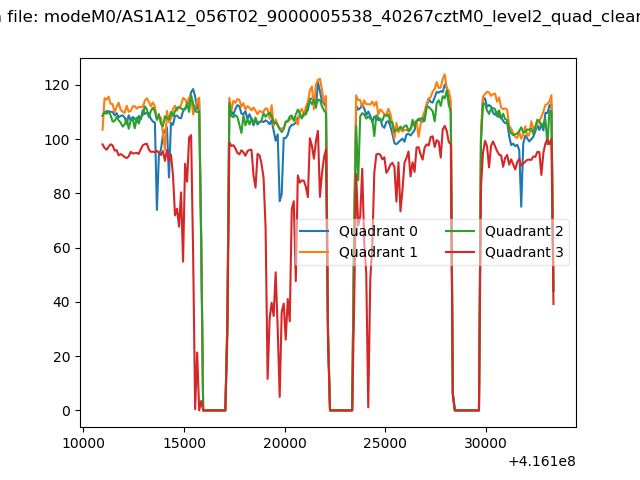 |
|
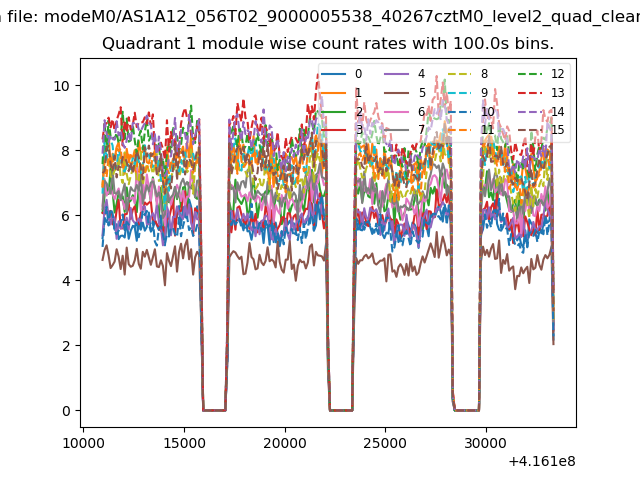
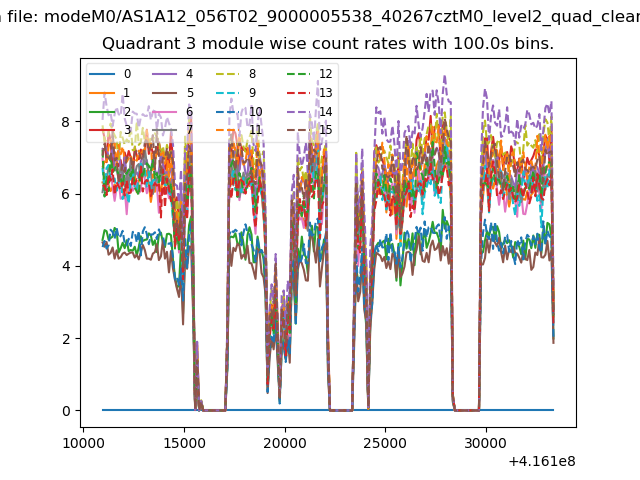
| Module-wise count rates for Quadrant A Data is divided into 100 sec bins |
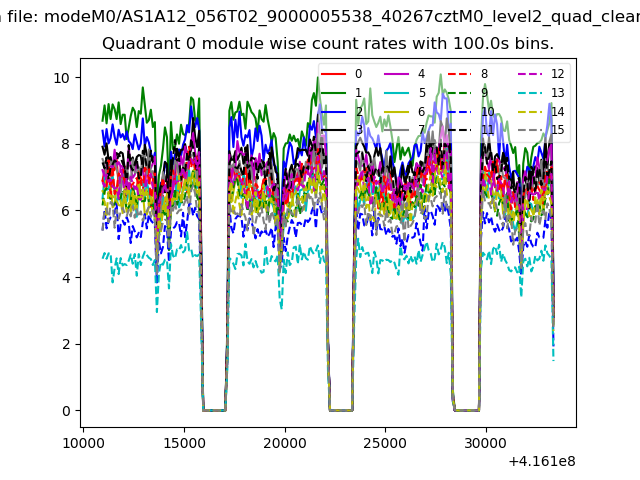 |
 |
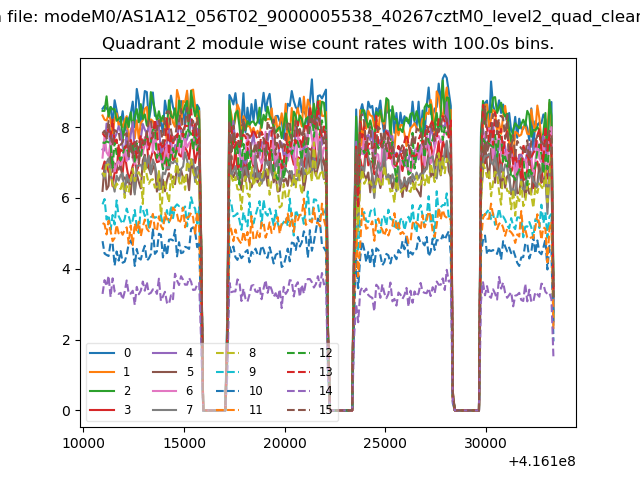
| Module-wise count rates for Quadrant B Data is divided into 100 sec bins |
 |
 |
| Module-wise count rates for Quadrant C Data is divided into 100 sec bins |
 |
 |
| Module-wise count rates for Quadrant D Data is divided into 100 sec bins |
 |
 |
| Parameter | Plot |
|---|---|
| CZT HV Monitor | 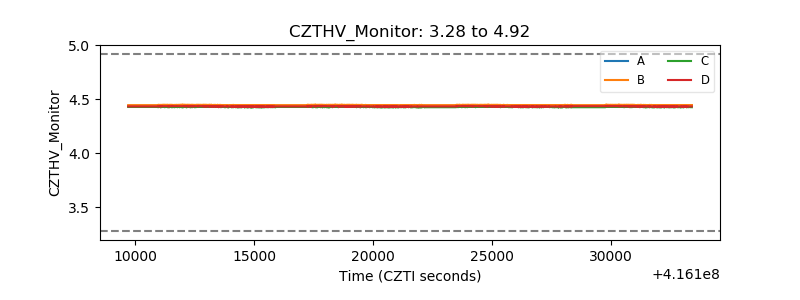 |
| D_VDD | 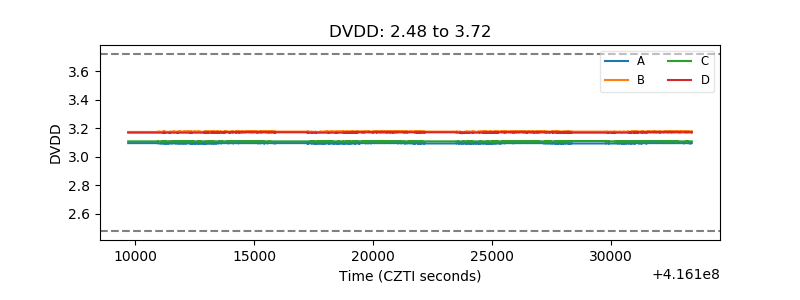 |
| Temperature 1 |  |
| Veto HV Monitor | 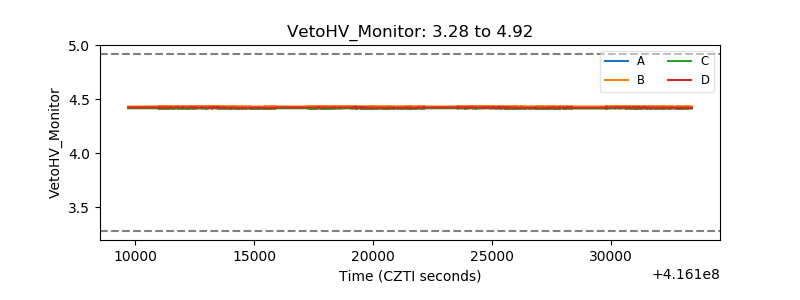 |
| Veto LLD | 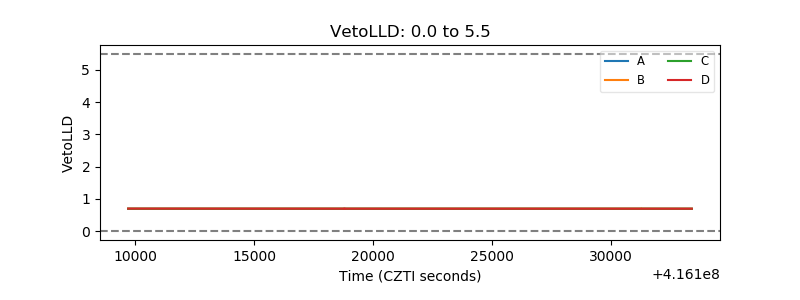 |
| Alpha Counter | 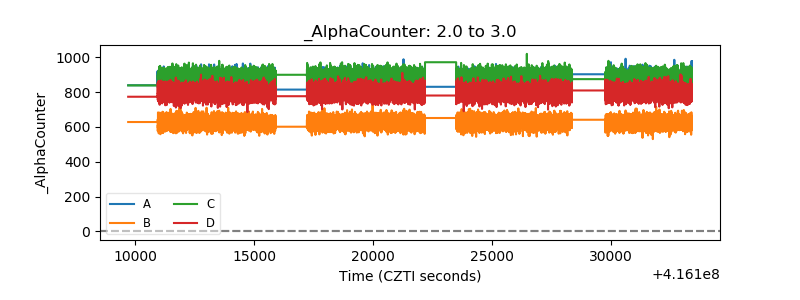 |
| _CPM_Rate | 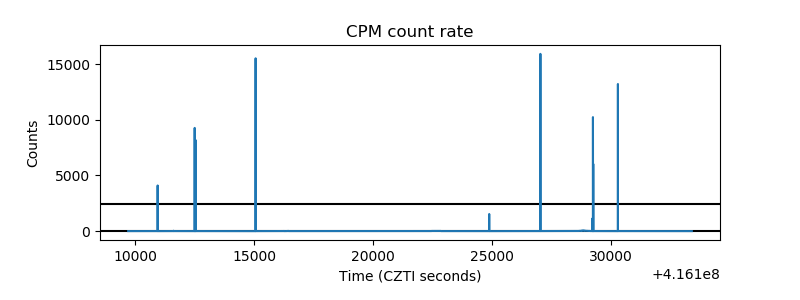 |
| CZT Counter | 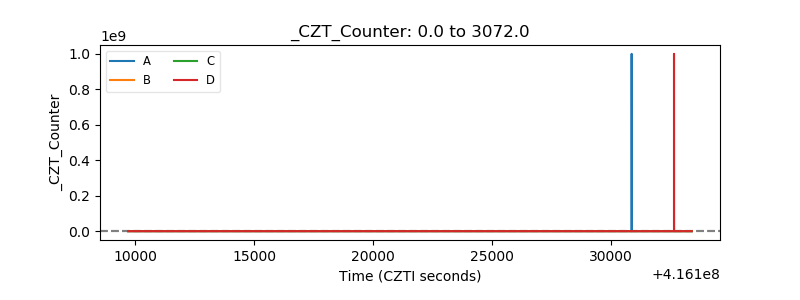 |
| +2.5 Volts monitor | 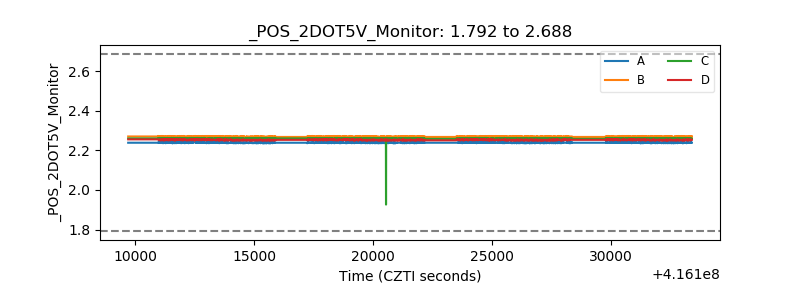 |
| +5 Volts monitor | 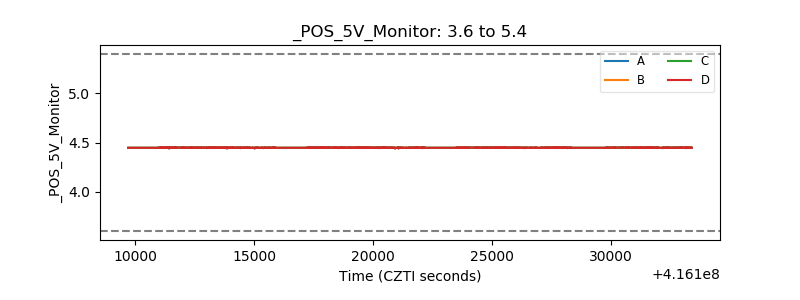 |
| _ROLL_ROT | 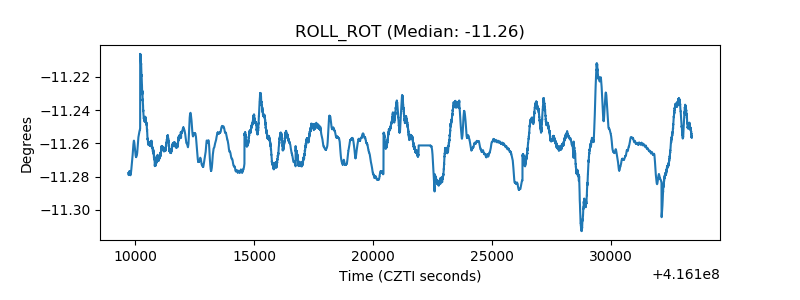 |
| _Roll_DEC | 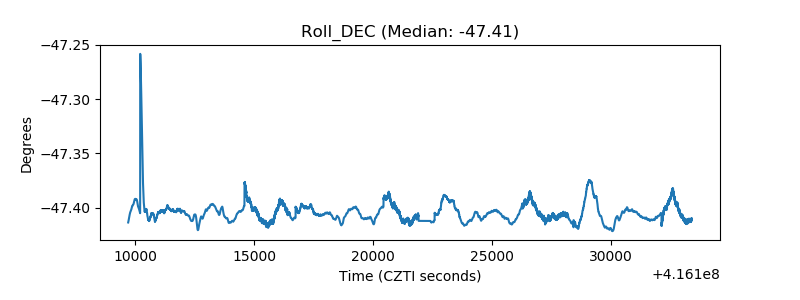 |
| _Roll_RA | 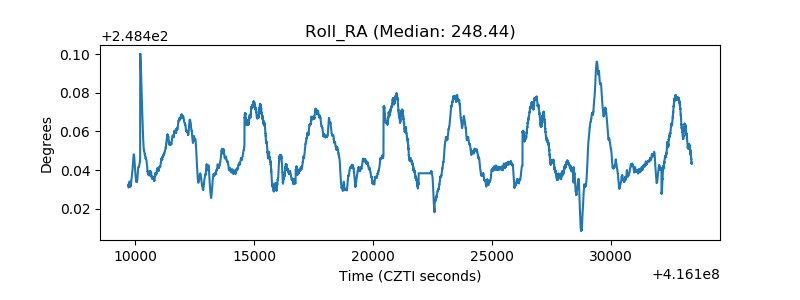 |
| Veto Counter | 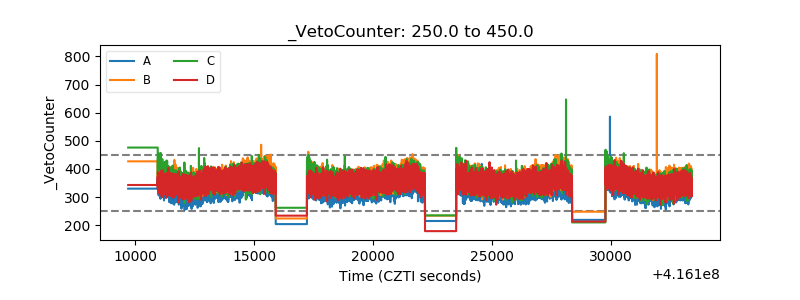 |