| Param | Original file | Final file |
|---|---|---|
| Filename | modeM0/AS1A12_056T02_9000005538_40269cztM0_level2.fits | modeM0/AS1A12_056T02_9000005538_40269cztM0_level2_quad_clean.evt |
| Size (bytes) | 757,978,560 | 193,665,600 |
| Size | 722.9 MB | 184.7 MB |
| Events in quadrant A | 7,012,961 | 1,289,199 |
| Events in quadrant B | 5,748,205 | 1,334,616 |
| Events in quadrant C | 5,831,054 | 1,296,104 |
| Events in quadrant D | 8,569,402 | 1,144,114 |
| Mode M0 | |||
|---|---|---|---|
| Quadrant | BADHDUFLAG | Total packets | Discarded packets |
| A | 0 | 27827 | 4 |
| B | 0 | 24654 | 3 |
| C | 0 | 24472 | 3 |
| D | 0 | 33244 | 3 |
| Mode M9 | |||
|---|---|---|---|
| Quadrant | BADHDUFLAG | Total packets | Discarded packets |
| A | 0 | 49 | 0 |
| B | 0 | 49 | 0 |
| C | 0 | 49 | 0 |
| D | 0 | 49 | 0 |
| Mode SS | |||
|---|---|---|---|
| Quadrant | BADHDUFLAG | Total packets | Discarded packets |
| A | 0 | 236 | 0 |
| B | 0 | 236 | 0 |
| C | 0 | 236 | 0 |
| D | 0 | 236 | 0 |
| Quadrant | Total seconds | Saturated seconds | Saturation percentage |
|---|---|---|---|
| A | 11564 | 295 | 2.551020% |
| B | 11564 | 114 | 0.985818% |
| C | 11564 | 57 | 0.492909% |
| D | 11564 | 600 | 5.188516% |
Noise dominated data is calculated using 1-second bins in cleaned event files. If a bin has >2000 counts, and if more than 50% of those come from <1% of pixels, then it is considered to be noise-dominated and hence unusable.
| Quadrant | # 1 sec bins | Bins with >0 counts | Bins with >2000 counts | High rate bins dominated by noise | Noise dominated (total time) | Noise dominated (detector-on time) | Marked lightcurve |
|---|---|---|---|---|---|---|---|
| A | 16432 | 11567 | 215 | 215 | 1.31% | 1.86% | 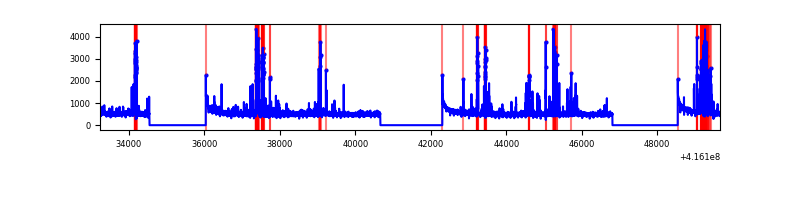 |
| B | 16432 | 11567 | 57 | 57 | 0.35% | 0.49% | 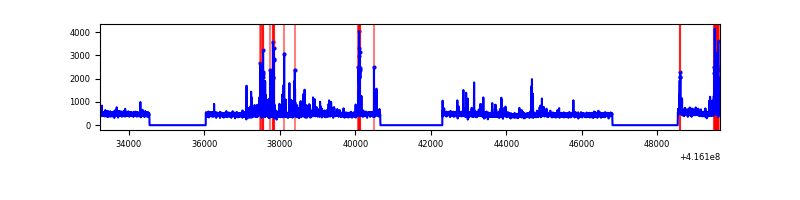 |
| C | 16432 | 11567 | 41 | 41 | 0.25% | 0.35% | 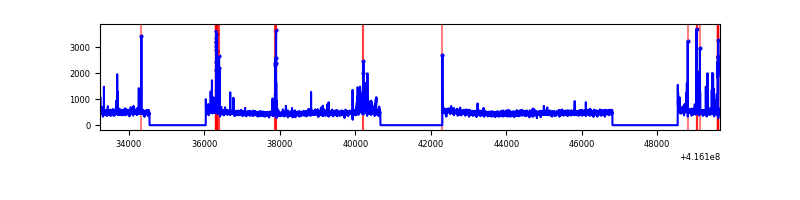 |
| D | 16432 | 11567 | 515 | 515 | 3.13% | 4.45% | 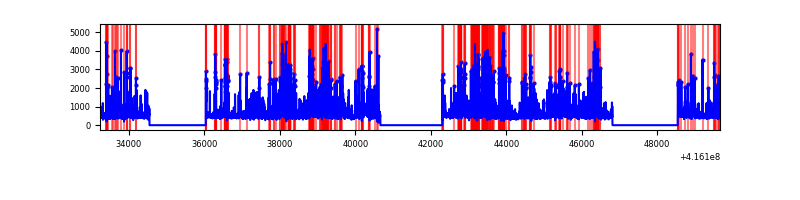 |
Top three noisy pixels from each quadrant. If the there are fewer than three noisy pixels in the level2.evt file, extra rows are filled as -1
| Pixel properties | Quadrant properties | ||||||
|---|---|---|---|---|---|---|---|
| Quadrant | DetID | PixID | Counts | Sigma | Mean | Median | Sigma |
| A | 13 | 248 | 936231 | 3591.17 | 1290 | 1266 | 260.4 |
| A | 10 | 83 | 912443 | 3499.8 | 1290 | 1266 | 260.4 |
| A | 6 | 10 | 96801 | 366.95 | 1290 | 1266 | 260.4 |
| B | 0 | 245 | 272664 | 1101.41 | 1296 | 1260 | 246.4 |
| B | 5 | 255 | 175998 | 709.12 | 1296 | 1260 | 246.4 |
| B | 4 | 171 | 119518 | 479.91 | 1296 | 1260 | 246.4 |
| C | 15 | 214 | 485343 | 1639.6 | 1275 | 1284 | 295.2 |
| C | 14 | 254 | 309379 | 1043.57 | 1275 | 1284 | 295.2 |
| C | 15 | 208 | 27159 | 87.64 | 1275 | 1284 | 295.2 |
| D | 12 | 227 | 1752382 | 5789.94 | 1244 | 1210 | 302.5 |
| D | 1 | 47 | 1200359 | 3964.78 | 1244 | 1210 | 302.5 |
| D | 13 | 249 | 295351 | 972.53 | 1244 | 1210 | 302.5 |
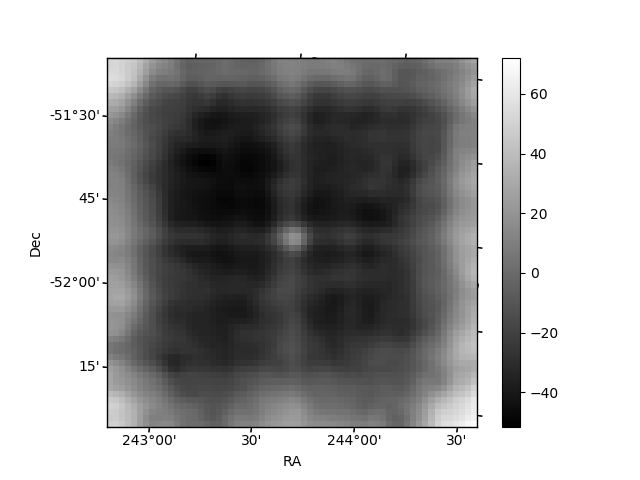
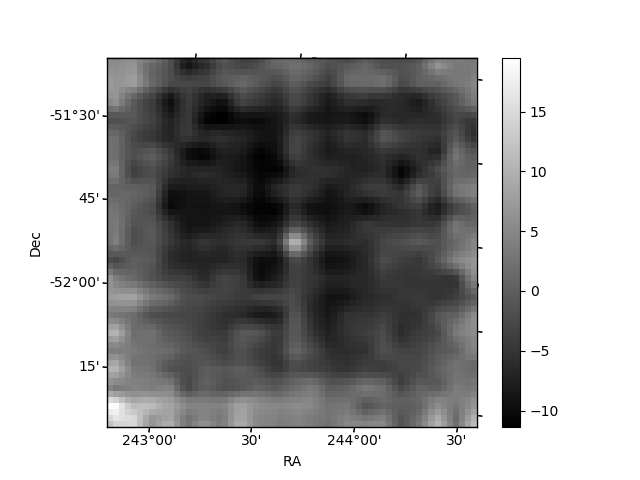
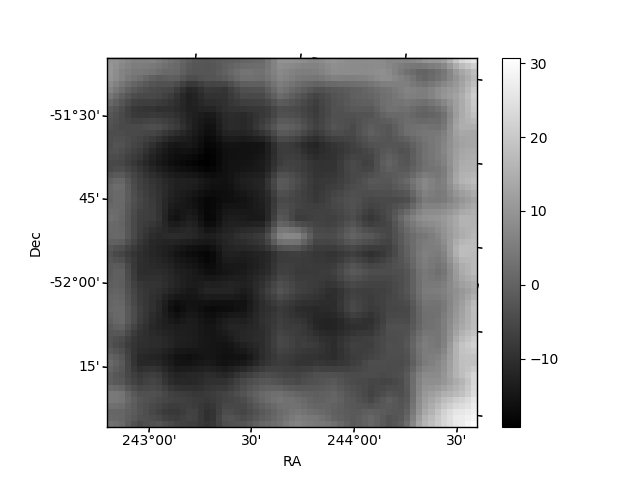
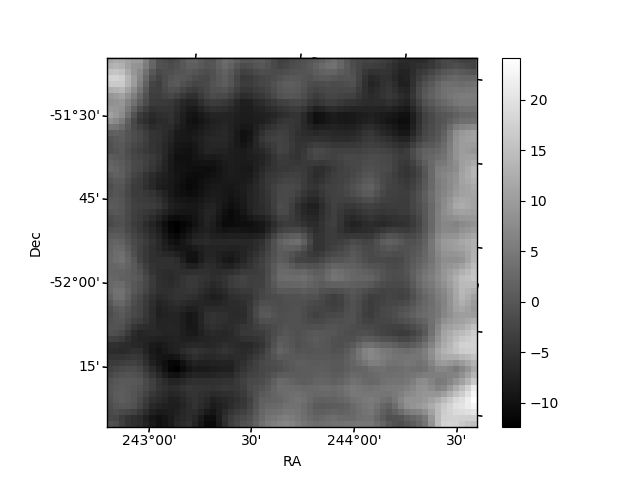
Histogram calculated using DETX and DETY for each event in the final _common_clean file
| Quadrant A | 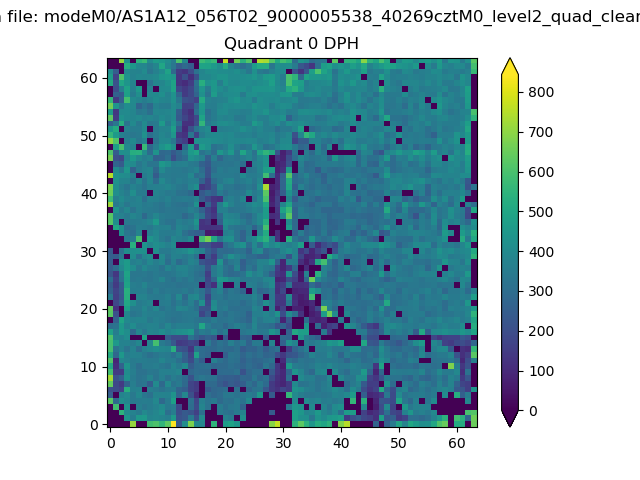 |
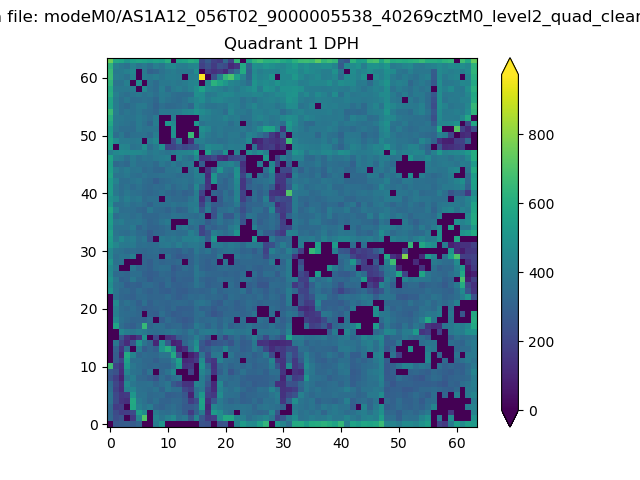 |
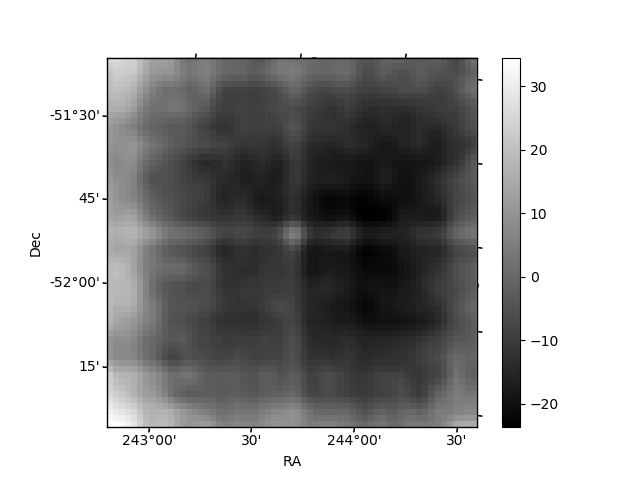
Quadrant B |
|---|---|---|---|
| Quadrant D | 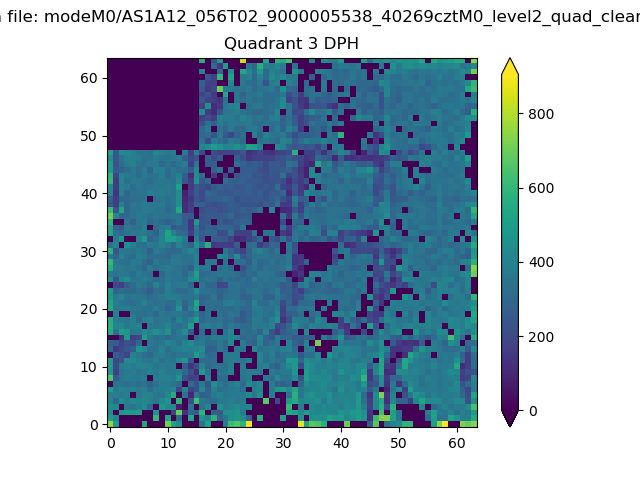 |
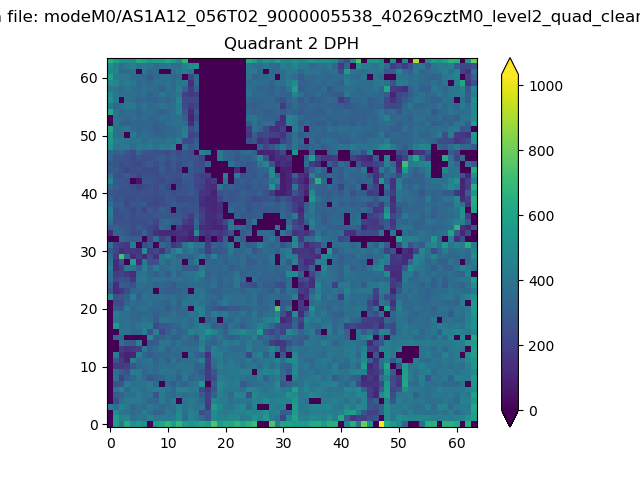 |
Quadrant C |
| Plot type | Count rate plots | Images |
|---|---|---|
| Comparison with Poisson distribution Blue bars denote a histogram of data divided into 1 sec bins. Red curve is a Poisson curve with rate = median count rate of data. |
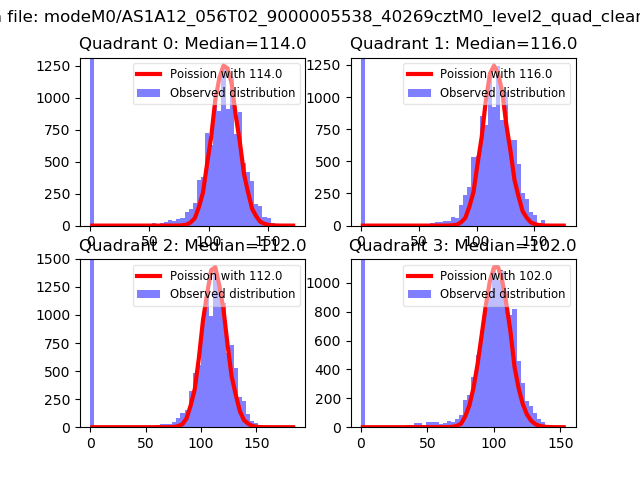 |
 |
| Quadrant-wise count rates Data is divided into 100 sec bins |
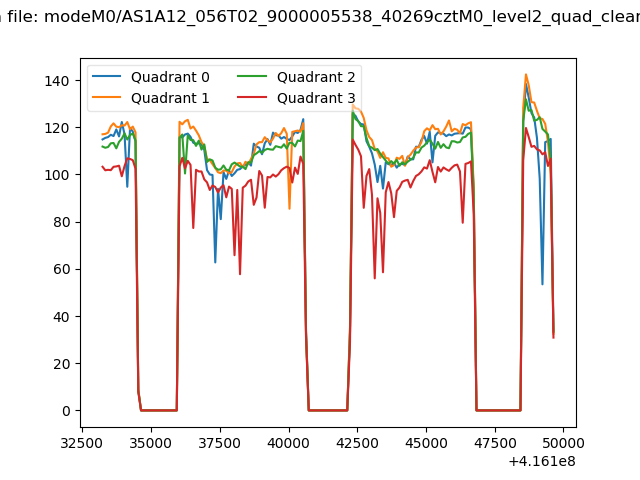 |
|
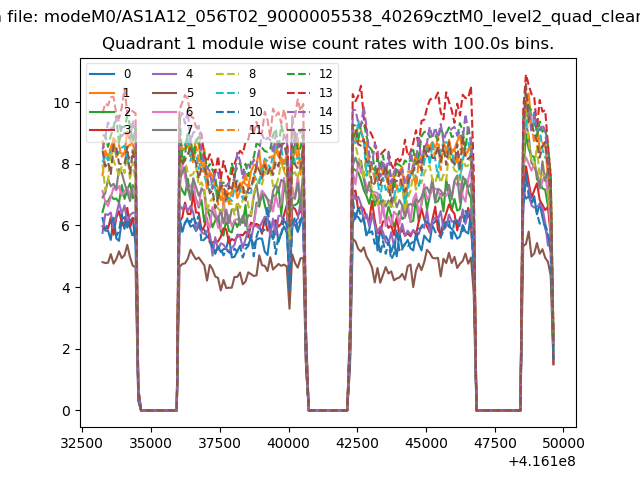
| Module-wise count rates for Quadrant A Data is divided into 100 sec bins |
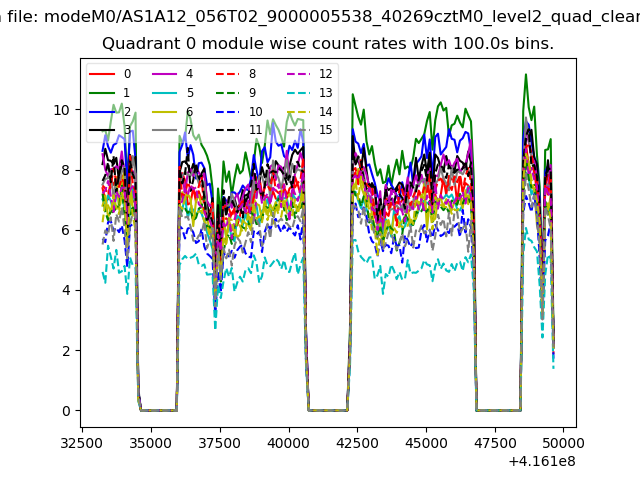 |
 |
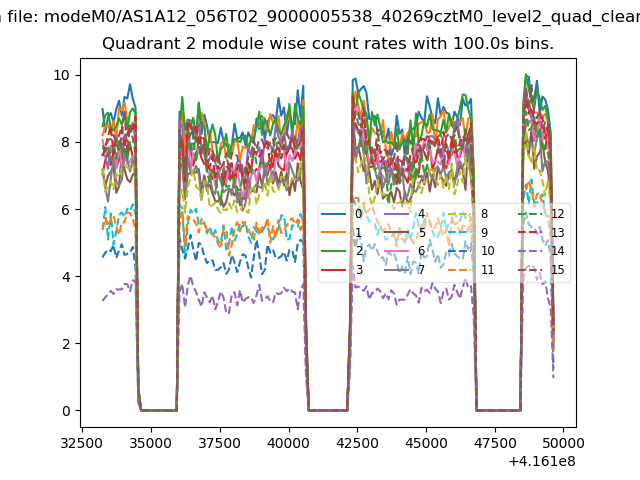
| Module-wise count rates for Quadrant B Data is divided into 100 sec bins |
 |
 |
| Module-wise count rates for Quadrant C Data is divided into 100 sec bins |
 |
 |
| Module-wise count rates for Quadrant D Data is divided into 100 sec bins |
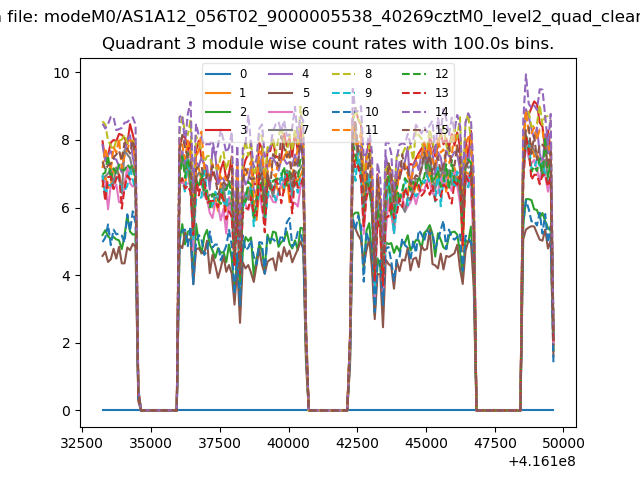 |
 |
| Parameter | Plot |
|---|---|
| CZT HV Monitor | 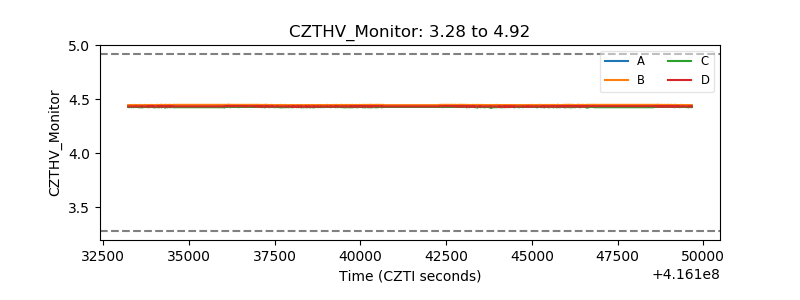 |
| D_VDD | 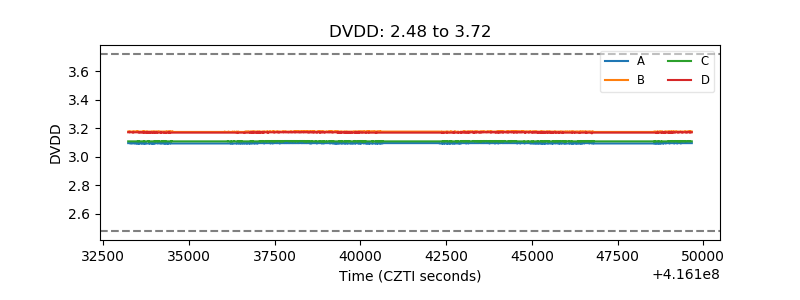 |
| Temperature 1 | 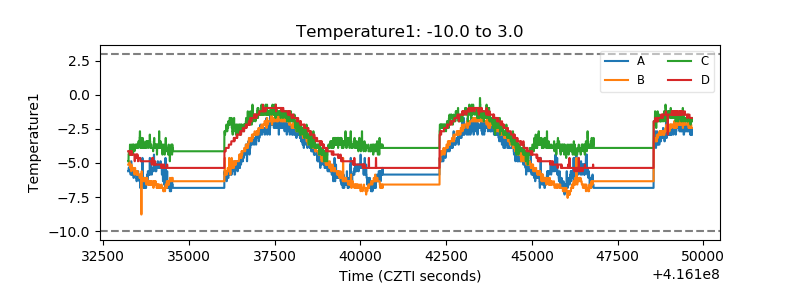 |
| Veto HV Monitor | 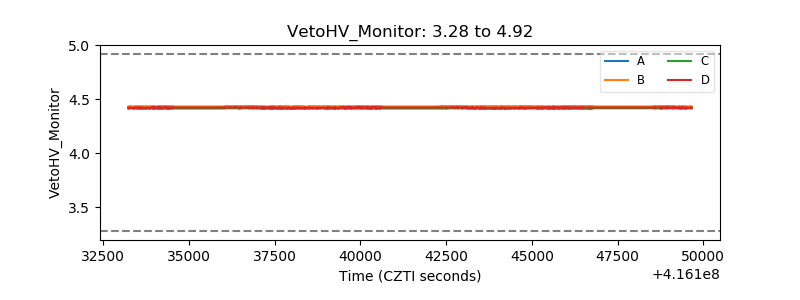 |
| Veto LLD | 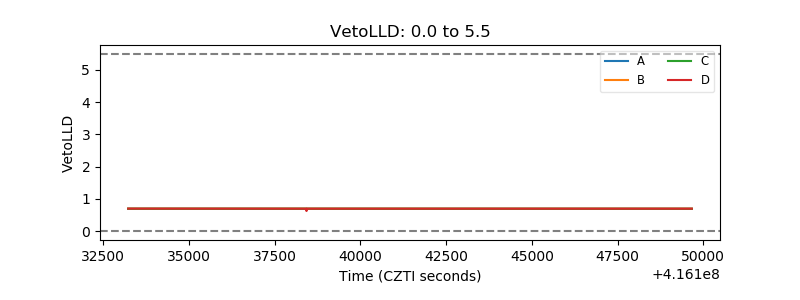 |
| Alpha Counter | 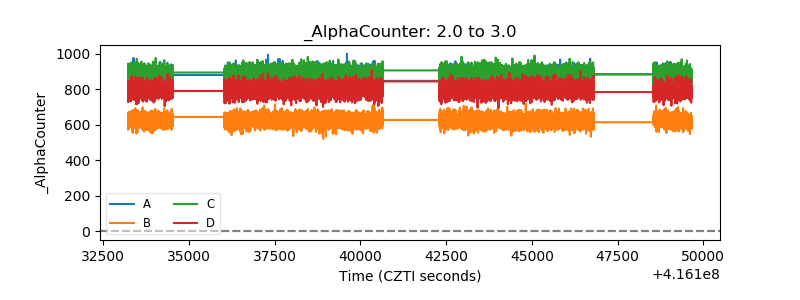 |
| _CPM_Rate |  |
| CZT Counter | 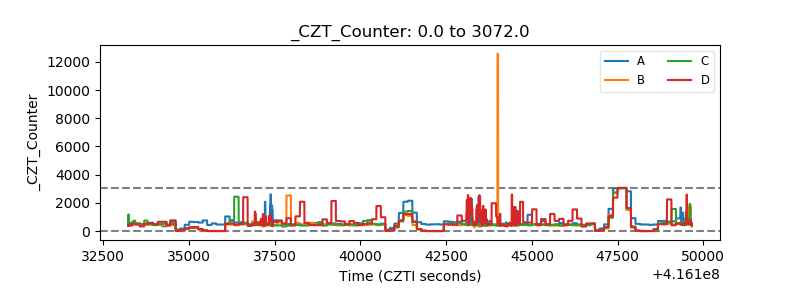 |
| +2.5 Volts monitor | 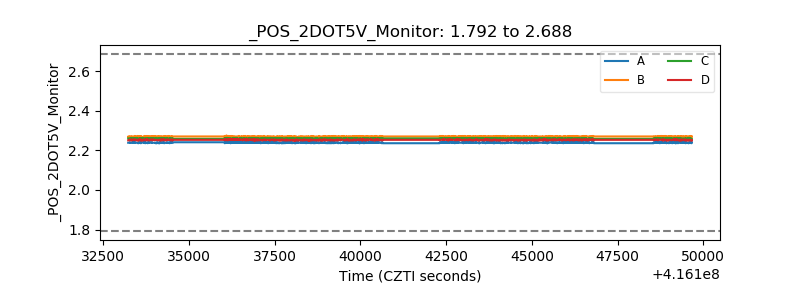 |
| +5 Volts monitor | 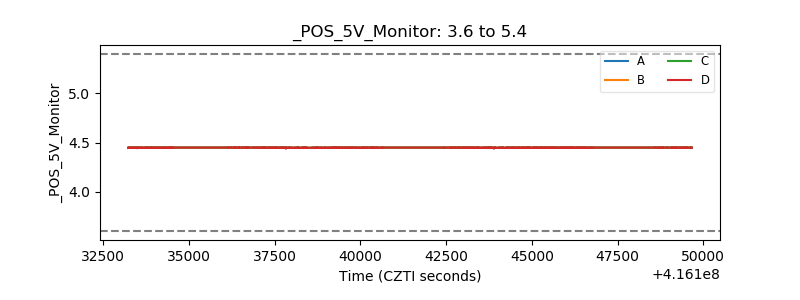 |
| _ROLL_ROT | 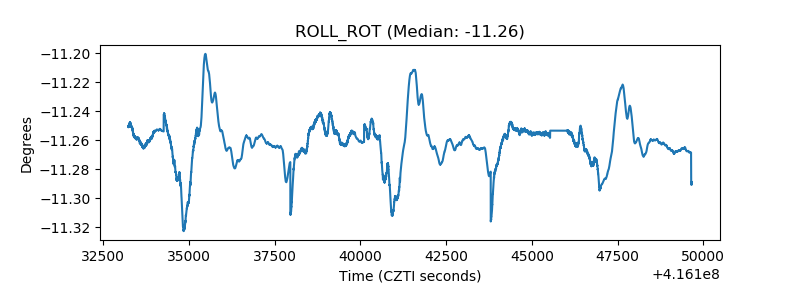 |
| _Roll_DEC | 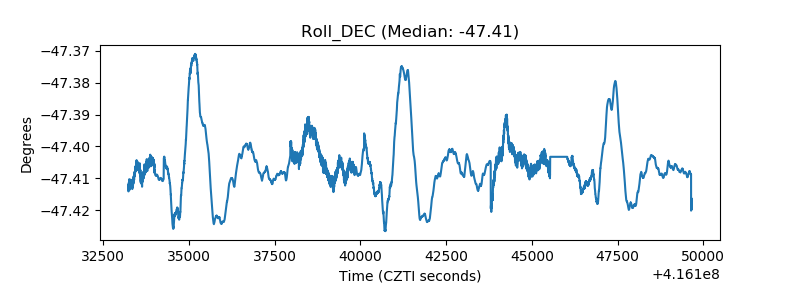 |
| _Roll_RA | 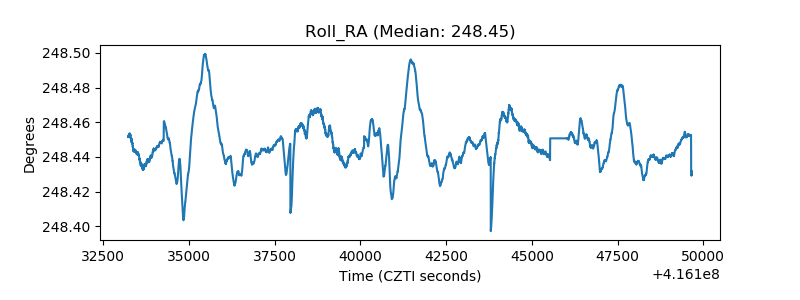 |
| Veto Counter | 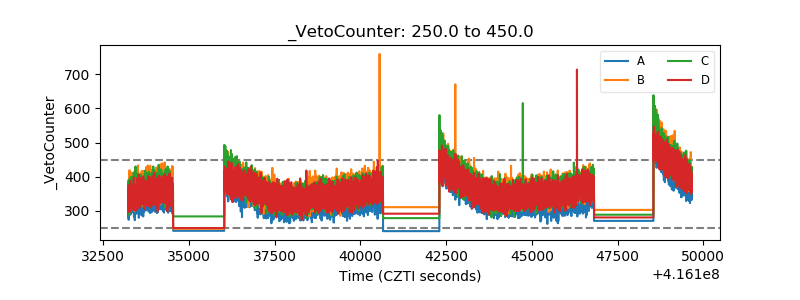 |