| Param | Original file | Final file |
|---|---|---|
| Filename | modeM0/AS1A12_056T02_9000005538_40270cztM0_level2.fits | modeM0/AS1A12_056T02_9000005538_40270cztM0_level2_quad_clean.evt |
| Size (bytes) | 402,033,600 | 95,713,920 |
| Size | 383.4 MB | 91.3 MB |
| Events in quadrant A | 3,395,196 | 656,686 |
| Events in quadrant B | 3,103,216 | 680,457 |
| Events in quadrant C | 2,813,767 | 651,998 |
| Events in quadrant D | 5,147,217 | 529,196 |
| Mode M0 | |||
|---|---|---|---|
| Quadrant | BADHDUFLAG | Total packets | Discarded packets |
| A | 0 | 13412 | 2 |
| B | 0 | 12591 | 1 |
| C | 0 | 11619 | 1 |
| D | 0 | 18990 | 1 |
| Mode M9 | |||
|---|---|---|---|
| Quadrant | BADHDUFLAG | Total packets | Discarded packets |
| A | 0 | 24 | 0 |
| B | 0 | 24 | 0 |
| C | 0 | 24 | 0 |
| D | 0 | 25 | 0 |
| Mode SS | |||
|---|---|---|---|
| Quadrant | BADHDUFLAG | Total packets | Discarded packets |
| A | 0 | 110 | 0 |
| B | 0 | 110 | 0 |
| C | 0 | 110 | 0 |
| D | 0 | 110 | 0 |
| Quadrant | Total seconds | Saturated seconds | Saturation percentage |
|---|---|---|---|
| A | 5431 | 152 | 2.798748% |
| B | 5431 | 103 | 1.896520% |
| C | 5431 | 30 | 0.552384% |
| D | 5431 | 788 | 14.509298% |
Noise dominated data is calculated using 1-second bins in cleaned event files. If a bin has >2000 counts, and if more than 50% of those come from <1% of pixels, then it is considered to be noise-dominated and hence unusable.
| Quadrant | # 1 sec bins | Bins with >0 counts | Bins with >2000 counts | High rate bins dominated by noise | Noise dominated (total time) | Noise dominated (detector-on time) | Marked lightcurve |
|---|---|---|---|---|---|---|---|
| A | 7313 | 5432 | 102 | 102 | 1.39% | 1.88% | 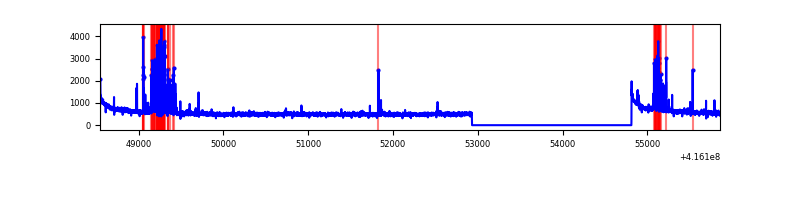 |
| B | 7313 | 5432 | 64 | 64 | 0.88% | 1.18% | 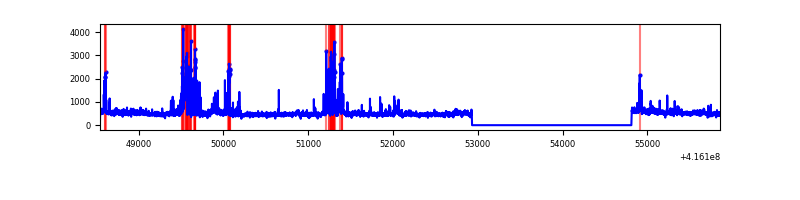 |
| C | 7313 | 5432 | 27 | 27 | 0.37% | 0.50% | 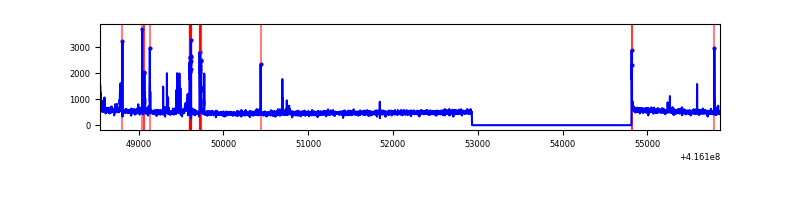 |
| D | 7312 | 5431 | 711 | 711 | 9.72% | 13.09% | 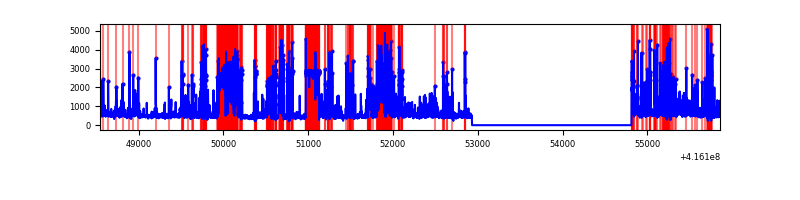 |
Top three noisy pixels from each quadrant. If the there are fewer than three noisy pixels in the level2.evt file, extra rows are filled as -1
| Pixel properties | Quadrant properties | ||||||
|---|---|---|---|---|---|---|---|
| Quadrant | DetID | PixID | Counts | Sigma | Mean | Median | Sigma |
| A | 10 | 83 | 482852 | 3793.19 | 630 | 619 | 127.1 |
| A | 13 | 248 | 428226 | 3363.51 | 630 | 619 | 127.1 |
| A | 12 | 189 | 18112 | 137.6 | 630 | 619 | 127.1 |
| B | 0 | 245 | 325662 | 2690.98 | 630 | 615 | 120.8 |
| B | 5 | 255 | 203403 | 1678.83 | 630 | 615 | 120.8 |
| B | 15 | 85 | 34310 | 278.95 | 630 | 615 | 120.8 |
| C | 15 | 214 | 229590 | 1610.79 | 616 | 620 | 142.1 |
| C | 14 | 254 | 149290 | 1045.88 | 616 | 620 | 142.1 |
| C | 0 | 10 | 12914 | 86.49 | 616 | 620 | 142.1 |
| D | 12 | 227 | 1382912 | 9943.12 | 569 | 553 | 139.0 |
| D | 1 | 47 | 1319240 | 9485.13 | 569 | 553 | 139.0 |
| D | 2 | 250 | 76074 | 543.21 | 569 | 553 | 139.0 |
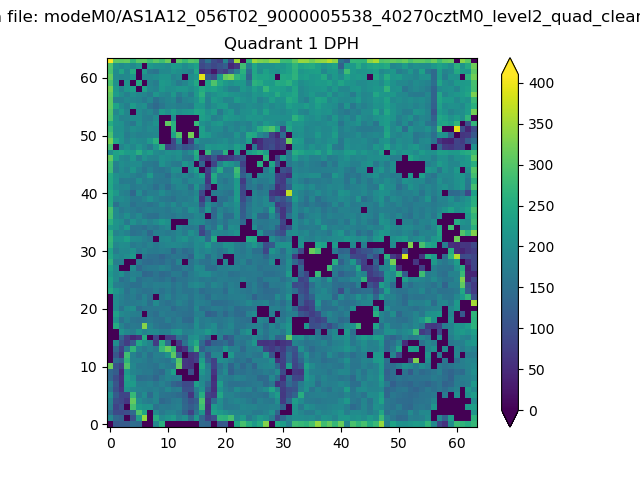
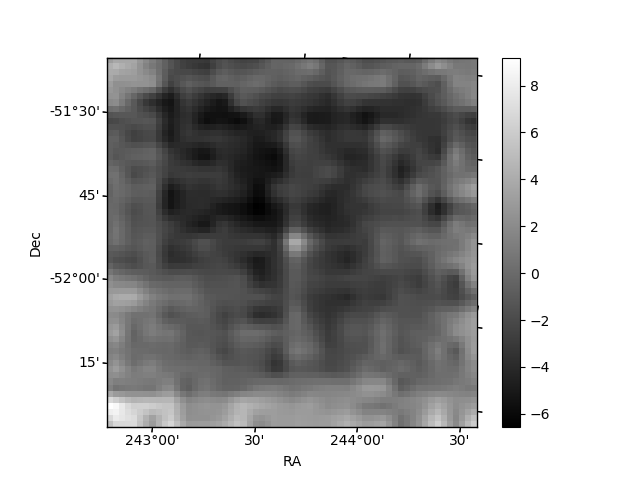
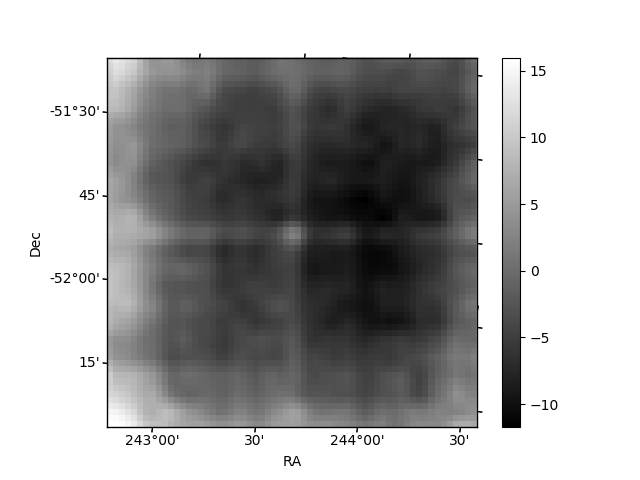
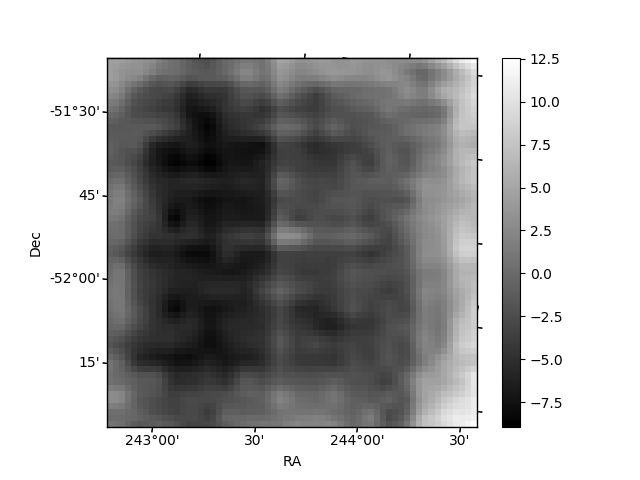
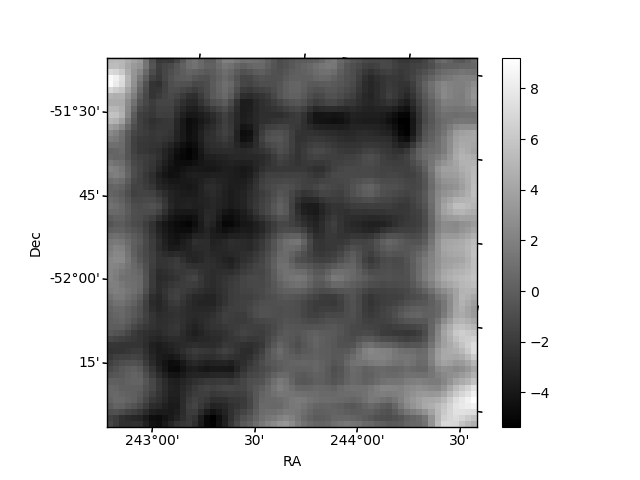
Histogram calculated using DETX and DETY for each event in the final _common_clean file
| Quadrant A |  |
 |
Quadrant B |
|---|---|---|---|
| Quadrant D | 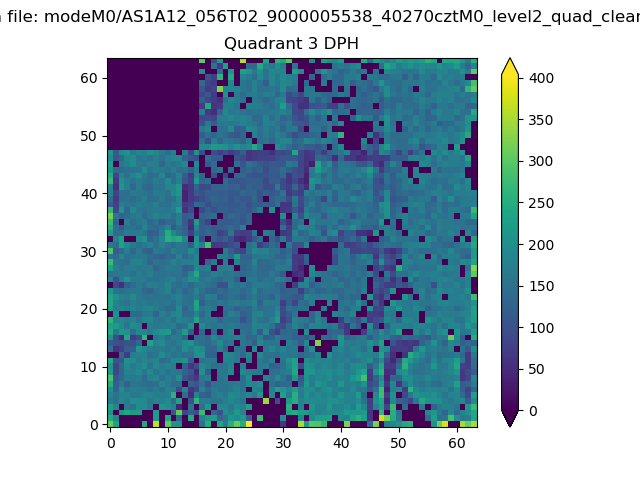 |
 |
Quadrant C |
| Plot type | Count rate plots | Images |
|---|---|---|
| Comparison with Poisson distribution Blue bars denote a histogram of data divided into 1 sec bins. Red curve is a Poisson curve with rate = median count rate of data. |
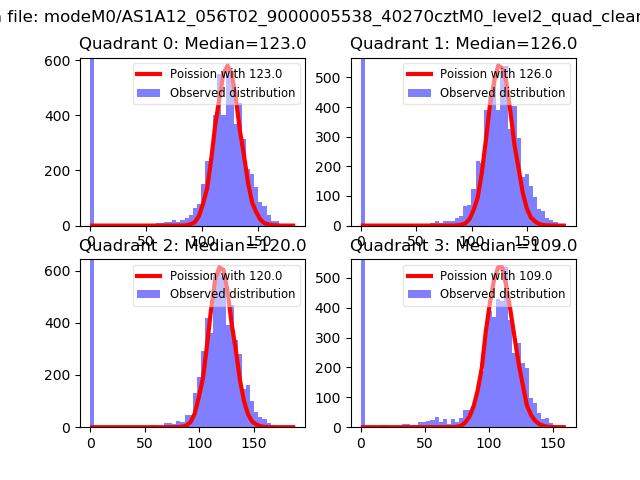 |
 |
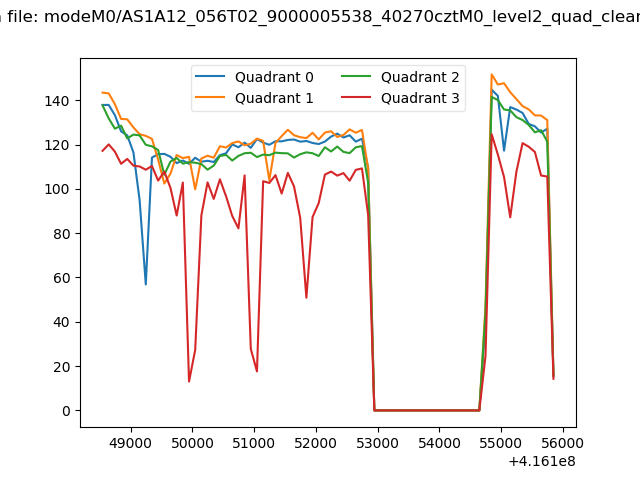
| Quadrant-wise count rates Data is divided into 100 sec bins |
 |
|
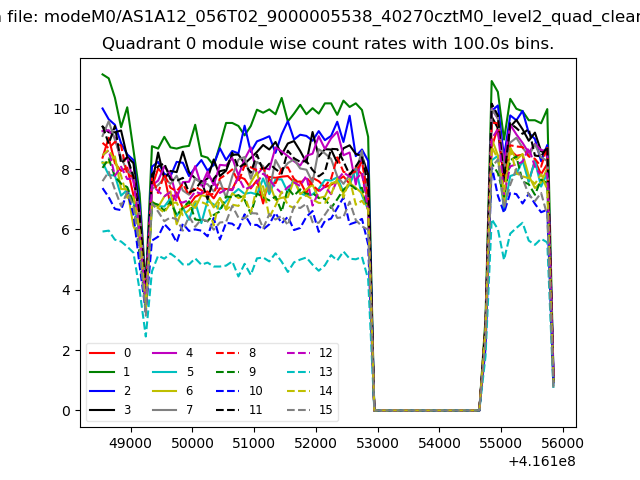
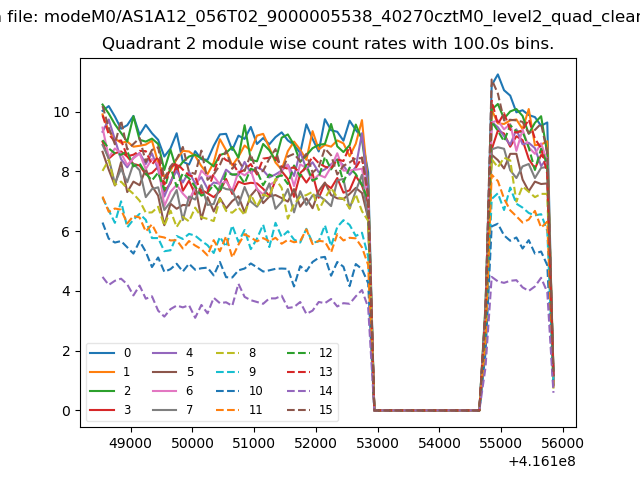
| Module-wise count rates for Quadrant A Data is divided into 100 sec bins |
 |
 |
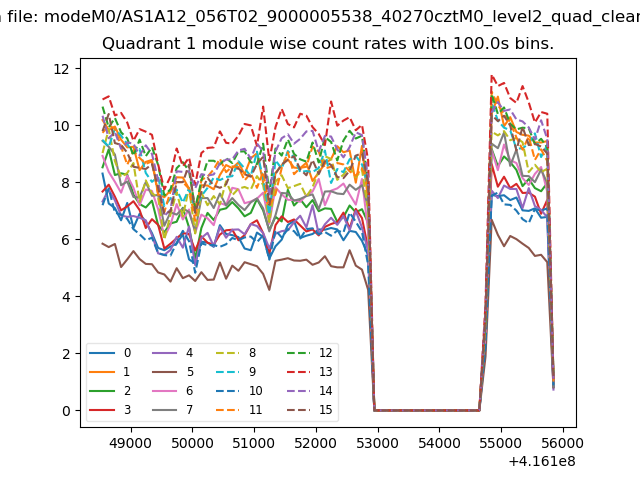
| Module-wise count rates for Quadrant B Data is divided into 100 sec bins |
 |
 |
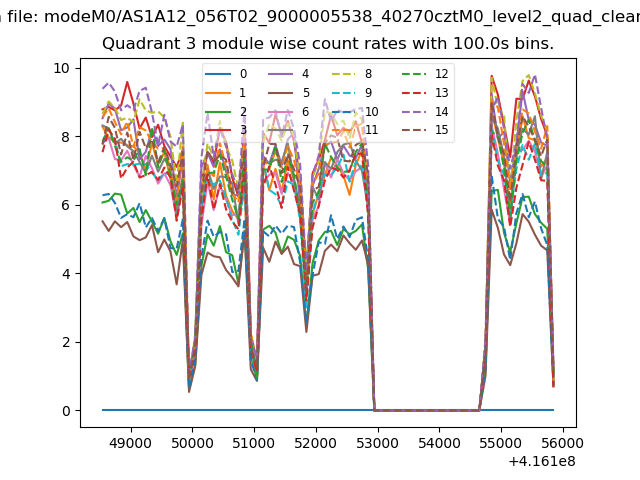
| Module-wise count rates for Quadrant C Data is divided into 100 sec bins |
 |
 |
| Module-wise count rates for Quadrant D Data is divided into 100 sec bins |
 |
 |
| Parameter | Plot |
|---|---|
| CZT HV Monitor | 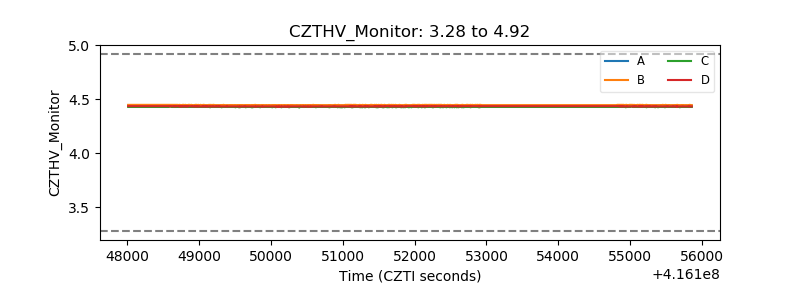 |
| D_VDD | 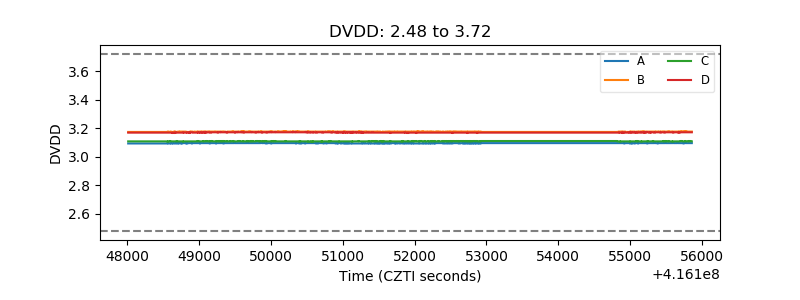 |
| Temperature 1 | 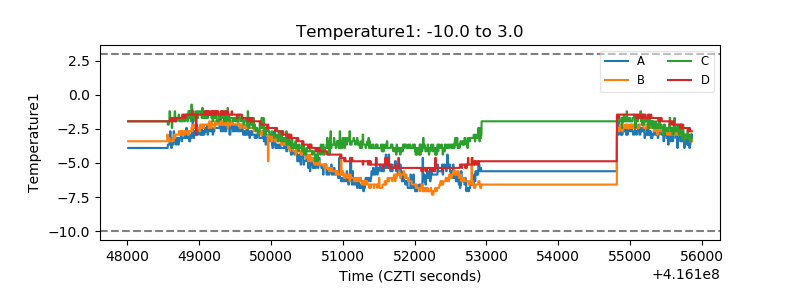 |
| Veto HV Monitor |  |
| Veto LLD | 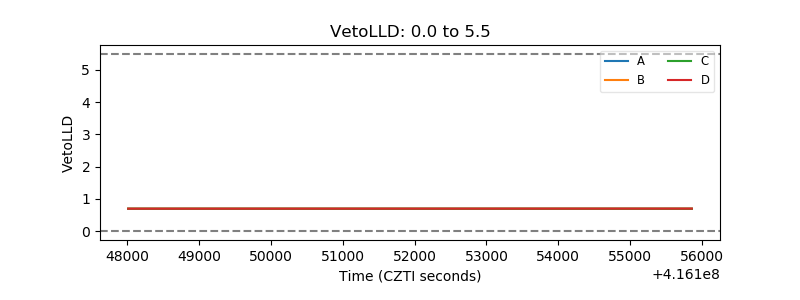 |
| Alpha Counter | 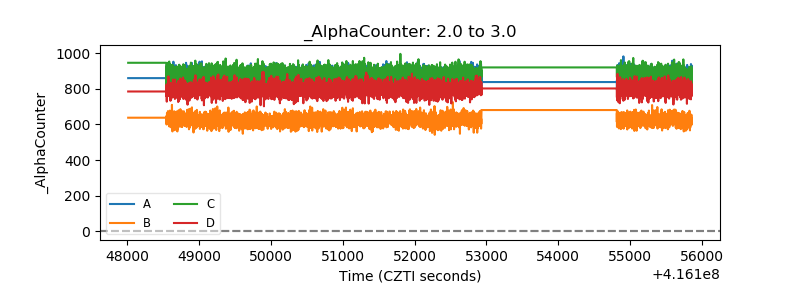 |
| _CPM_Rate | 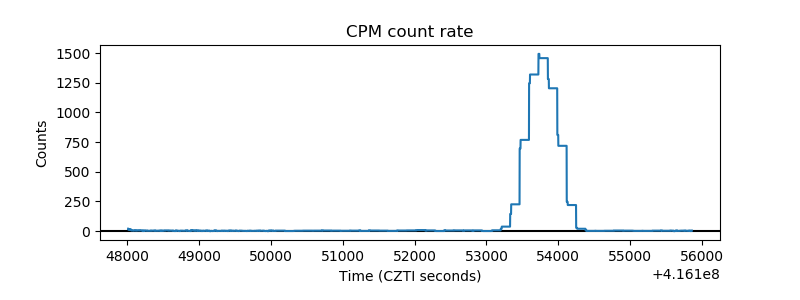 |
| CZT Counter | 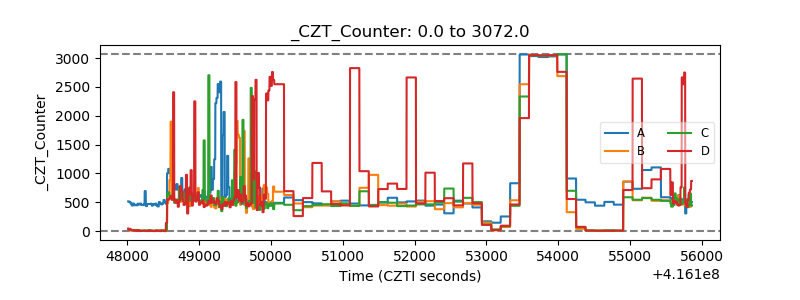 |
| +2.5 Volts monitor |  |
| +5 Volts monitor | 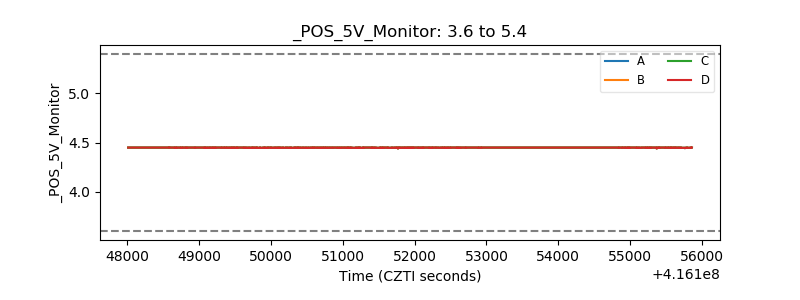 |
| _ROLL_ROT | 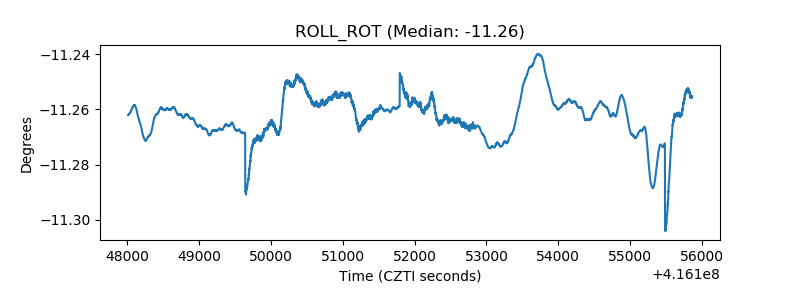 |
| _Roll_DEC | 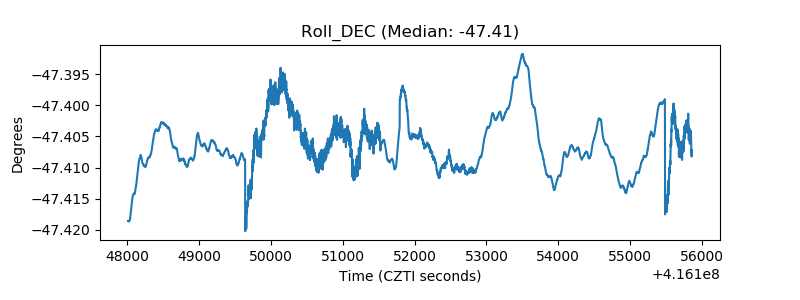 |
| _Roll_RA | 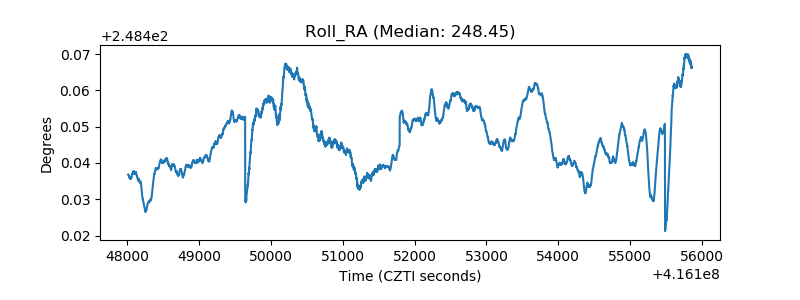 |
| Veto Counter | 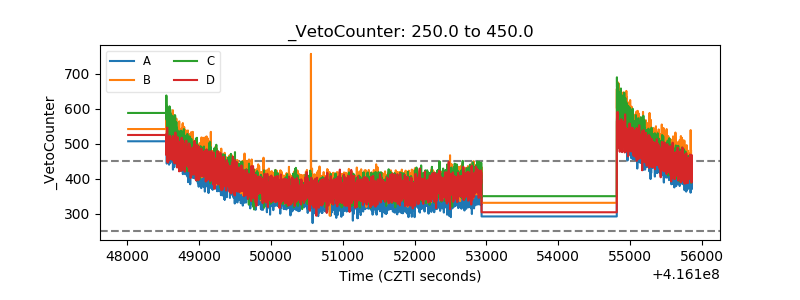 |