| Param | Original file | Final file |
|---|---|---|
| Filename | modeM0/AS1A12_056T02_9000005538_40271cztM0_level2.fits | modeM0/AS1A12_056T02_9000005538_40271cztM0_level2_quad_clean.evt |
| Size (bytes) | 359,858,880 | 98,786,880 |
| Size | 343.2 MB | 94.2 MB |
| Events in quadrant A | 3,142,972 | 681,745 |
| Events in quadrant B | 2,697,401 | 703,799 |
| Events in quadrant C | 2,722,595 | 660,014 |
| Events in quadrant D | 4,348,045 | 577,523 |
| Mode M0 | |||
|---|---|---|---|
| Quadrant | BADHDUFLAG | Total packets | Discarded packets |
| A | 0 | 12524 | 2 |
| B | 0 | 11281 | 1 |
| C | 0 | 11079 | 1 |
| D | 0 | 16487 | 1 |
| Mode M9 | |||
|---|---|---|---|
| Quadrant | BADHDUFLAG | Total packets | Discarded packets |
| A | 0 | 26 | 0 |
| B | 0 | 26 | 0 |
| C | 0 | 26 | 0 |
| D | 0 | 27 | 0 |
| Mode SS | |||
|---|---|---|---|
| Quadrant | BADHDUFLAG | Total packets | Discarded packets |
| A | 0 | 106 | 0 |
| B | 0 | 106 | 0 |
| C | 0 | 106 | 0 |
| D | 0 | 106 | 0 |
| Quadrant | Total seconds | Saturated seconds | Saturation percentage |
|---|---|---|---|
| A | 5265 | 55 | 1.044634% |
| B | 5265 | 17 | 0.322887% |
| C | 5265 | 17 | 0.322887% |
| D | 5265 | 409 | 7.768281% |
Noise dominated data is calculated using 1-second bins in cleaned event files. If a bin has >2000 counts, and if more than 50% of those come from <1% of pixels, then it is considered to be noise-dominated and hence unusable.
| Quadrant | # 1 sec bins | Bins with >0 counts | Bins with >2000 counts | High rate bins dominated by noise | Noise dominated (total time) | Noise dominated (detector-on time) | Marked lightcurve |
|---|---|---|---|---|---|---|---|
| A | 7269 | 5266 | 25 | 25 | 0.34% | 0.47% | 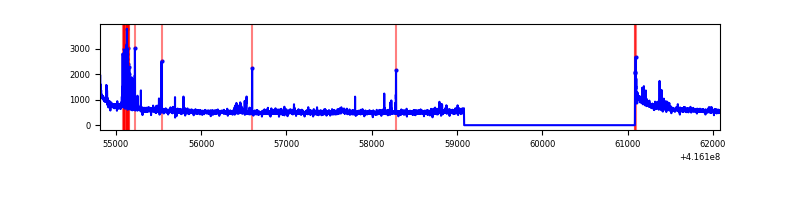 |
| B | 7269 | 5266 | 2 | 2 | 0.03% | 0.04% | 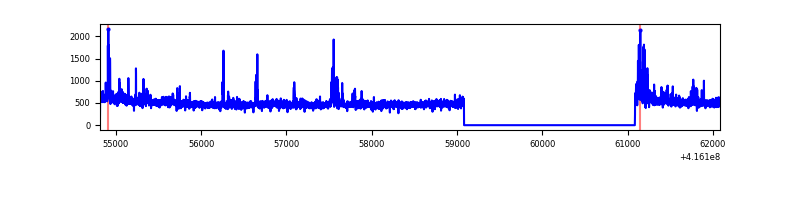 |
| C | 7269 | 5266 | 11 | 11 | 0.15% | 0.21% | 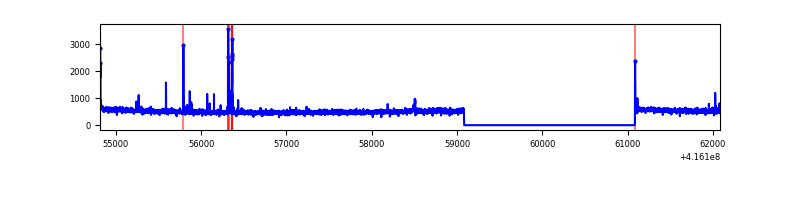 |
| D | 7269 | 5266 | 356 | 356 | 4.90% | 6.76% | 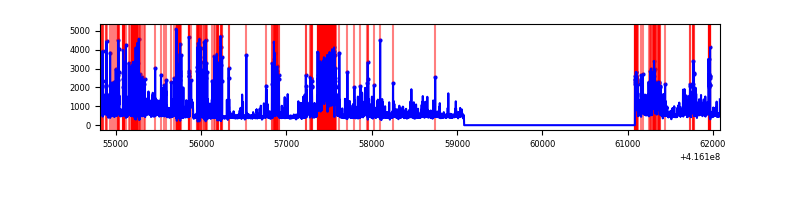 |
Top three noisy pixels from each quadrant. If the there are fewer than three noisy pixels in the level2.evt file, extra rows are filled as -1
| Pixel properties | Quadrant properties | ||||||
|---|---|---|---|---|---|---|---|
| Quadrant | DetID | PixID | Counts | Sigma | Mean | Median | Sigma |
| A | 10 | 83 | 476598 | 3735.84 | 634 | 625 | 127.4 |
| A | 13 | 248 | 145614 | 1138.0 | 634 | 625 | 127.4 |
| A | 12 | 189 | 46541 | 360.39 | 634 | 625 | 127.4 |
| B | 0 | 245 | 90944 | 756.51 | 632 | 617 | 119.4 |
| B | 5 | 255 | 79291 | 658.91 | 632 | 617 | 119.4 |
| B | 4 | 170 | 22583 | 183.97 | 632 | 617 | 119.4 |
| C | 15 | 214 | 224677 | 1580.56 | 614 | 620 | 141.8 |
| C | 14 | 254 | 65028 | 454.35 | 614 | 620 | 141.8 |
| C | 0 | 10 | 15805 | 107.12 | 614 | 620 | 141.8 |
| D | 12 | 227 | 940335 | 6565.22 | 589 | 574 | 143.1 |
| D | 1 | 47 | 812107 | 5669.41 | 589 | 574 | 143.1 |
| D | 9 | 19 | 110259 | 766.26 | 589 | 574 | 143.1 |
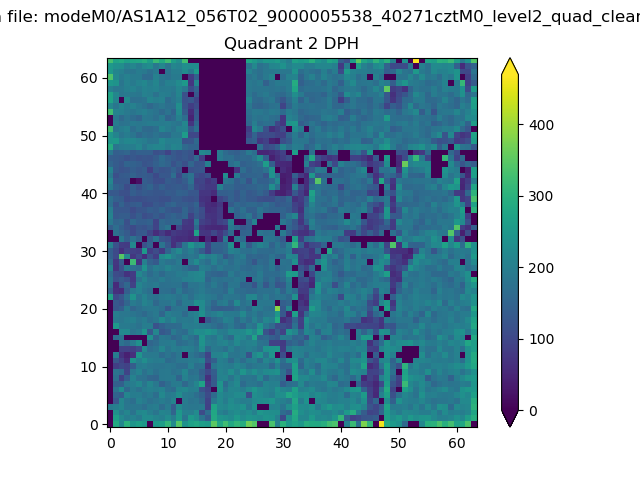
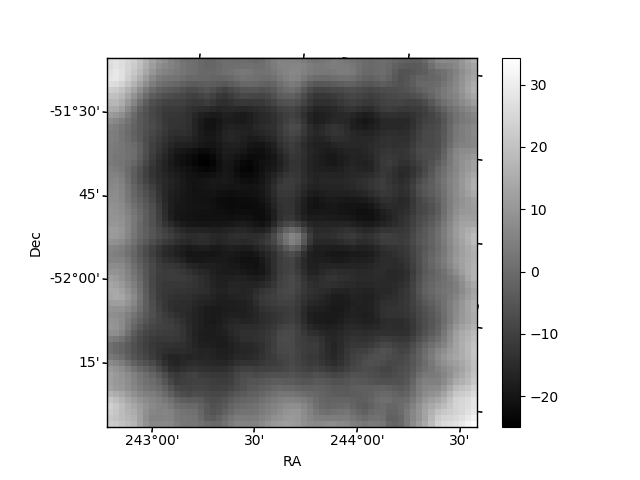
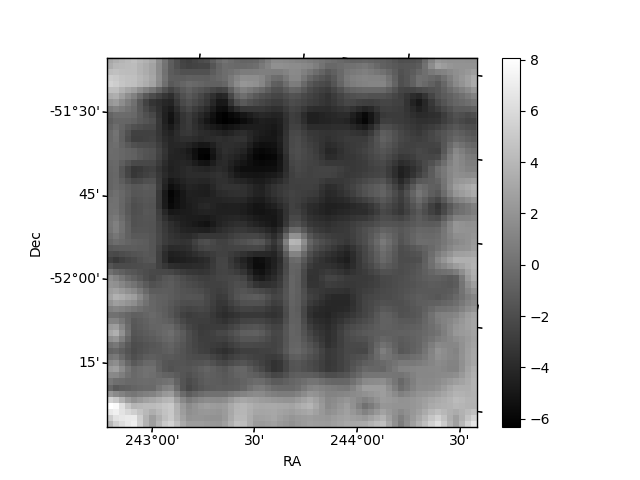
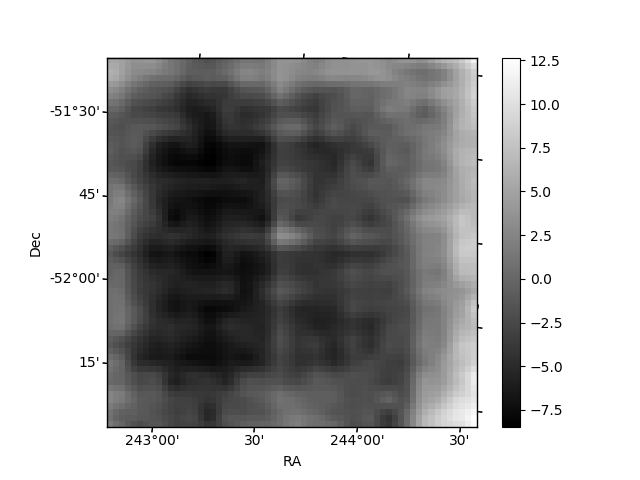
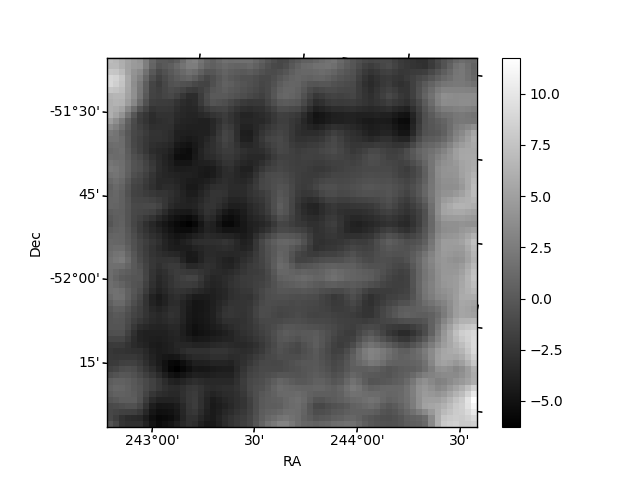
Histogram calculated using DETX and DETY for each event in the final _common_clean file
| Quadrant A | 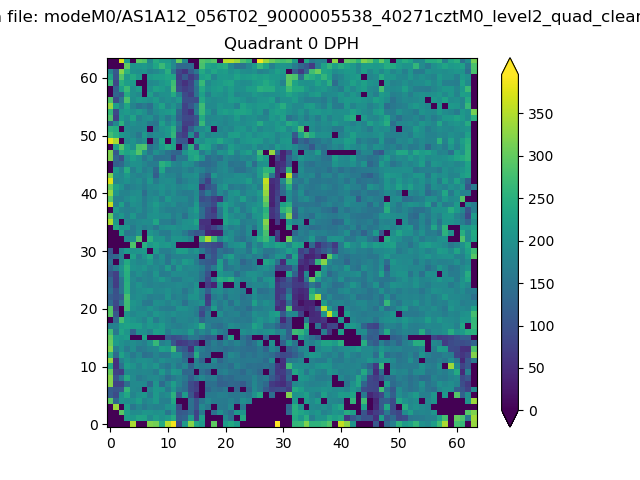 |
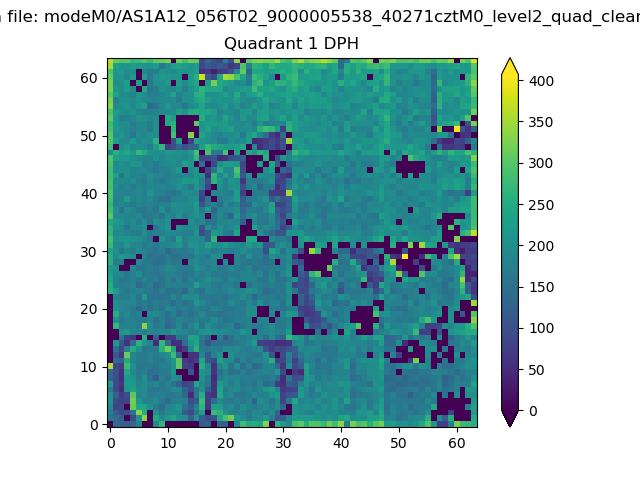 |
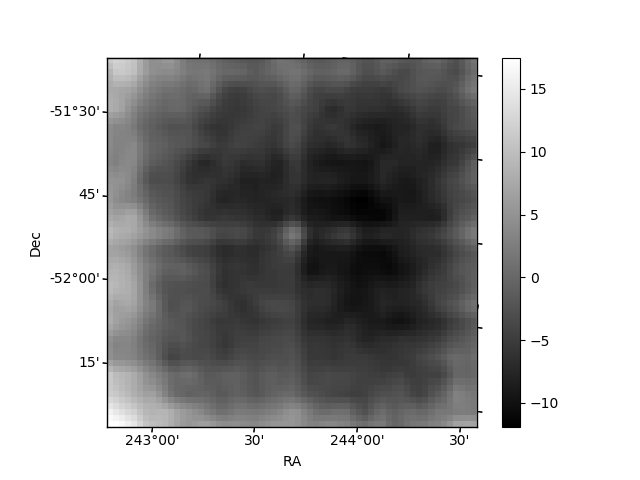
Quadrant B |
|---|---|---|---|
| Quadrant D | 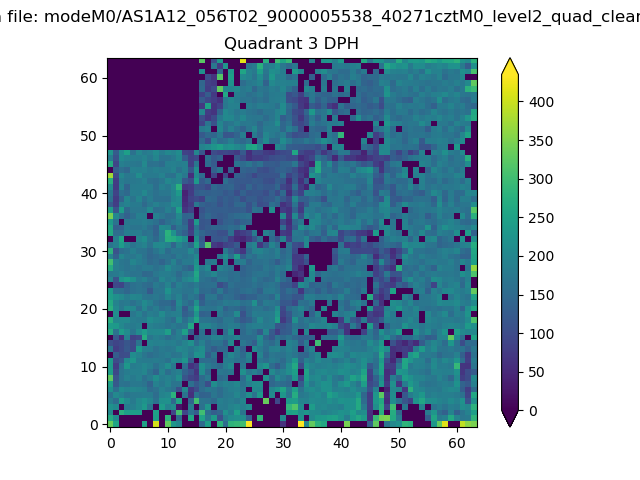 |
 |
Quadrant C |
| Plot type | Count rate plots | Images |
|---|---|---|
| Comparison with Poisson distribution Blue bars denote a histogram of data divided into 1 sec bins. Red curve is a Poisson curve with rate = median count rate of data. |
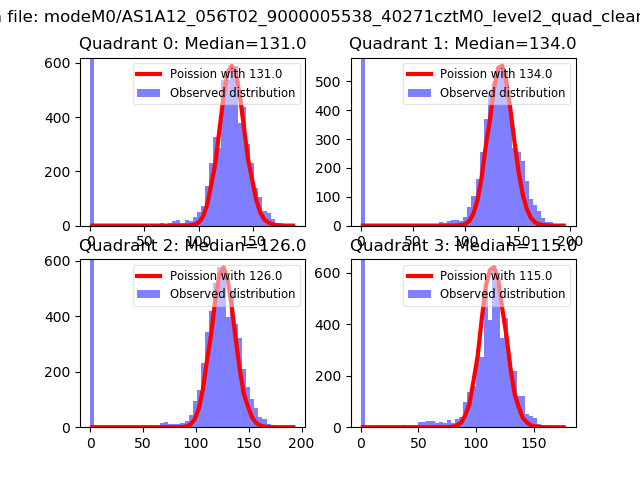 |
 |
| Quadrant-wise count rates Data is divided into 100 sec bins |
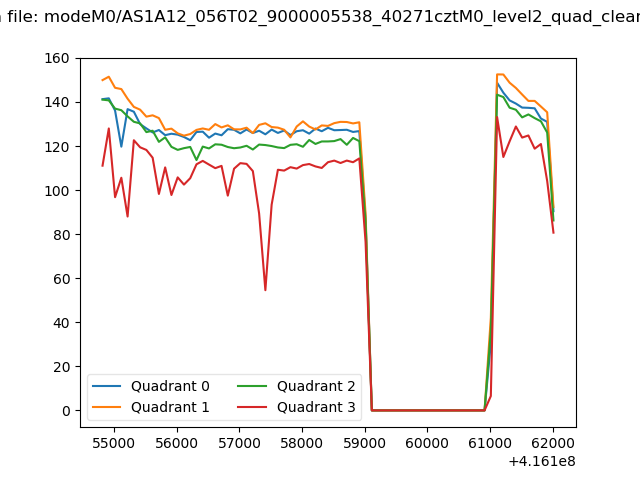 |
|
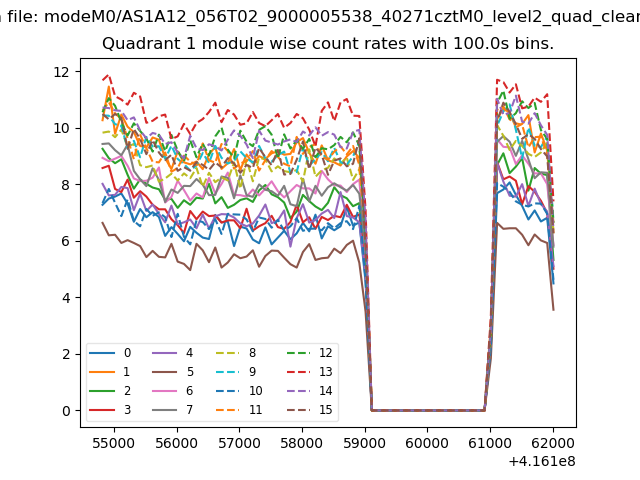
| Module-wise count rates for Quadrant A Data is divided into 100 sec bins |
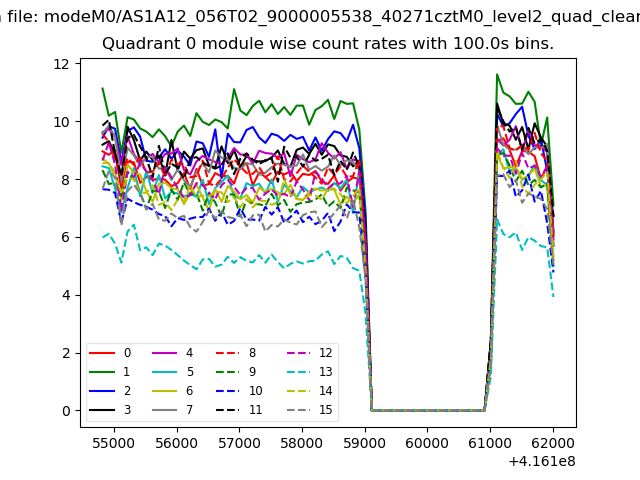 |
 |
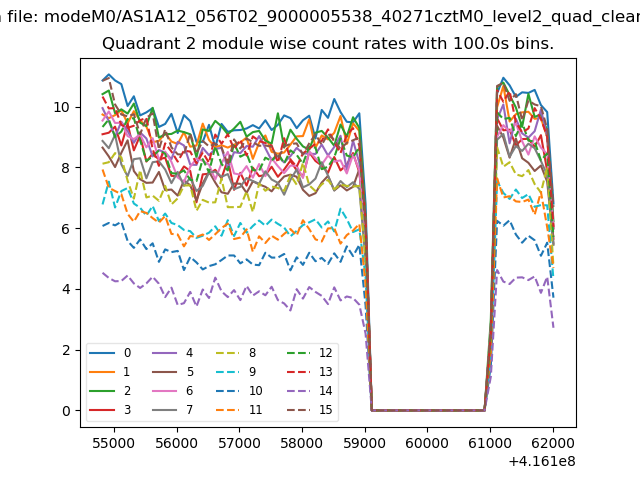
| Module-wise count rates for Quadrant B Data is divided into 100 sec bins |
 |
 |
| Module-wise count rates for Quadrant C Data is divided into 100 sec bins |
 |
 |
| Module-wise count rates for Quadrant D Data is divided into 100 sec bins |
 |
 |
| Parameter | Plot |
|---|---|
| CZT HV Monitor | 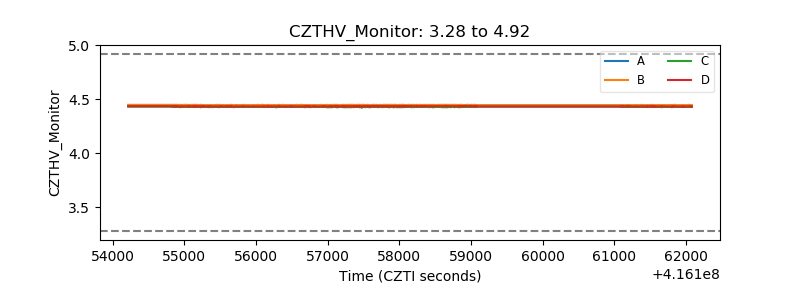 |
| D_VDD | 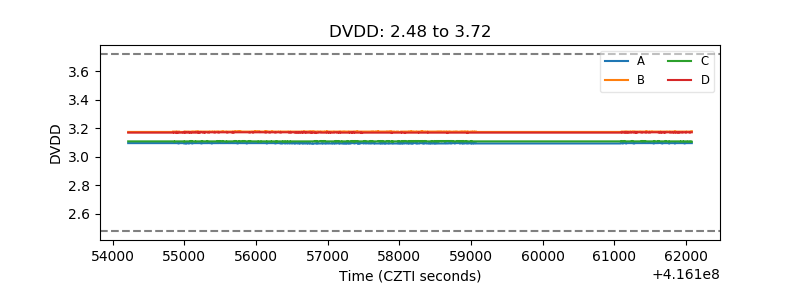 |
| Temperature 1 | 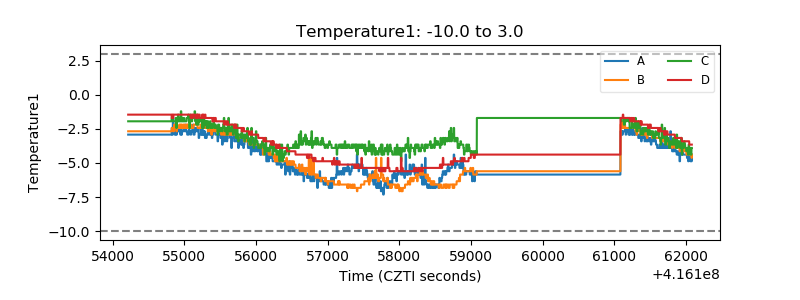 |
| Veto HV Monitor | 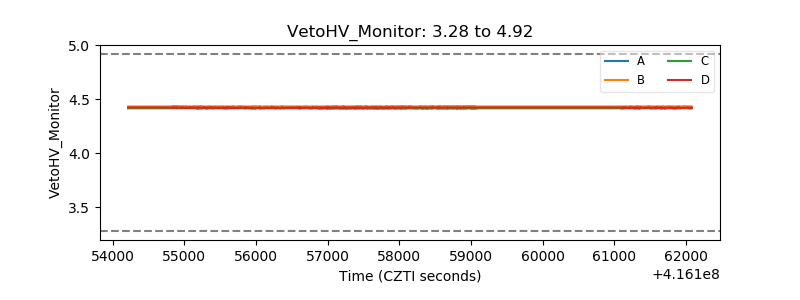 |
| Veto LLD | 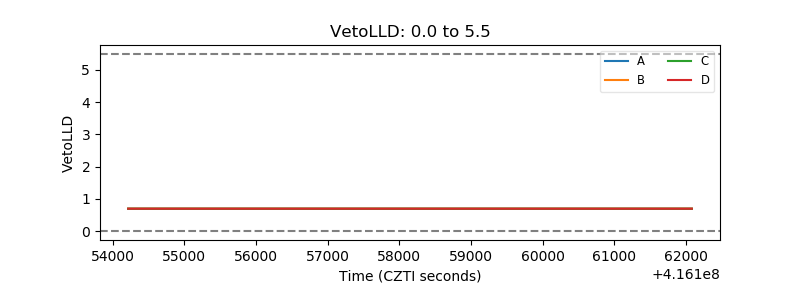 |
| Alpha Counter | 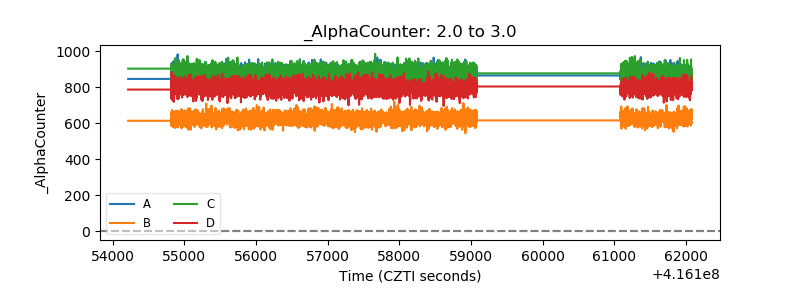 |
| _CPM_Rate |  |
| CZT Counter | 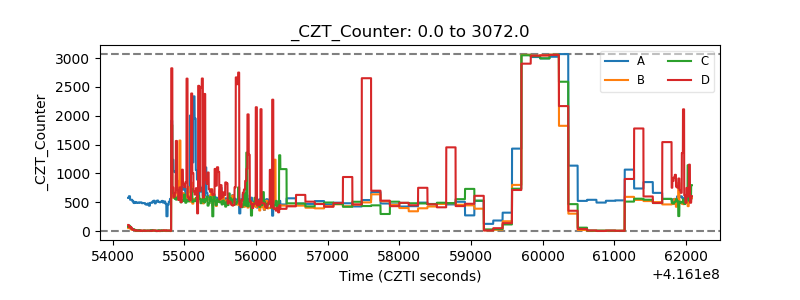 |
| +2.5 Volts monitor | 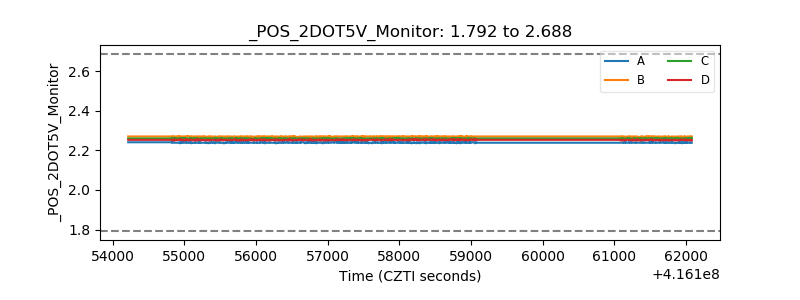 |
| +5 Volts monitor | 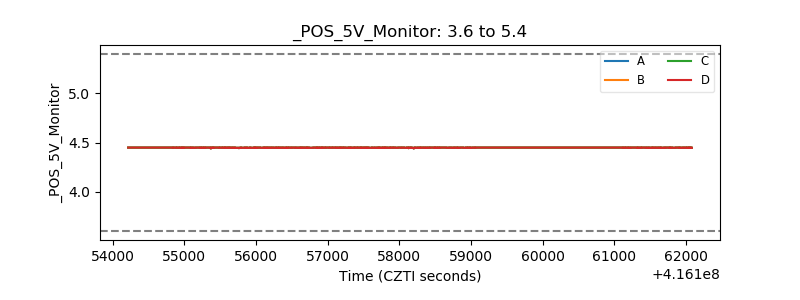 |
| _ROLL_ROT | 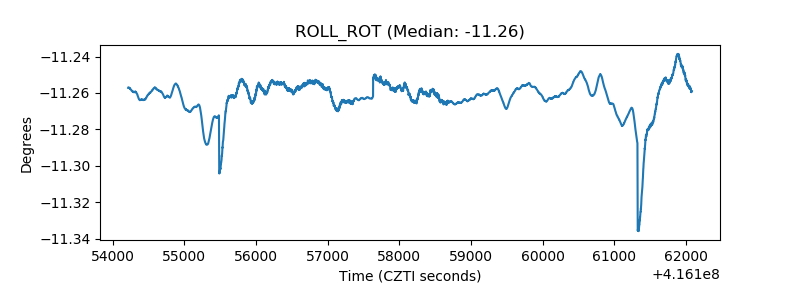 |
| _Roll_DEC | 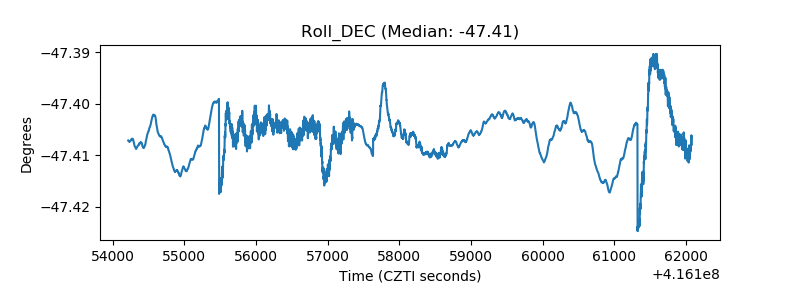 |
| _Roll_RA | 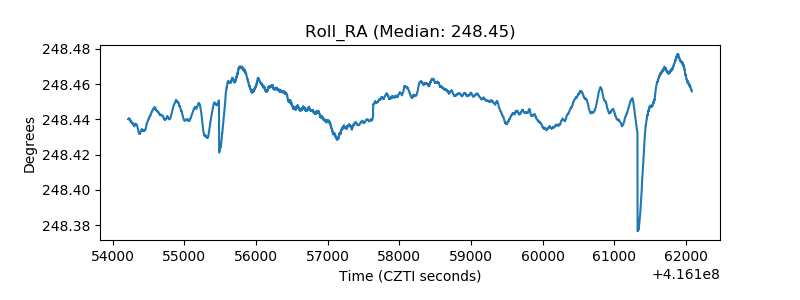 |
| Veto Counter | 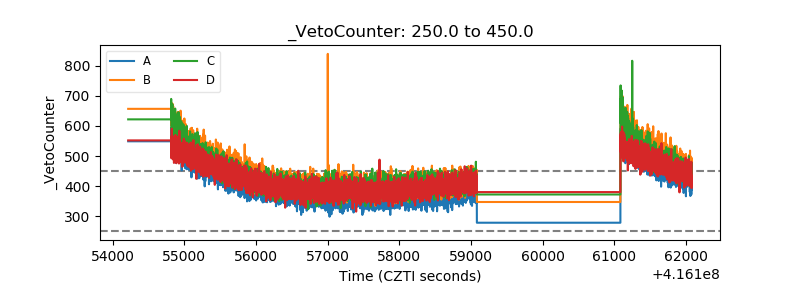 |