| Param | Original file | Final file |
|---|---|---|
| Filename | modeM0/AS1A12_056T02_9000005538_40272cztM0_level2.fits | modeM0/AS1A12_056T02_9000005538_40272cztM0_level2_quad_clean.evt |
| Size (bytes) | 324,509,760 | 94,299,840 |
| Size | 309.5 MB | 89.9 MB |
| Events in quadrant A | 2,859,908 | 653,913 |
| Events in quadrant B | 2,530,059 | 672,868 |
| Events in quadrant C | 2,543,097 | 626,959 |
| Events in quadrant D | 3,694,113 | 555,137 |
| Mode M0 | |||
|---|---|---|---|
| Quadrant | BADHDUFLAG | Total packets | Discarded packets |
| A | 0 | 11445 | 3 |
| B | 0 | 10459 | 2 |
| C | 0 | 10343 | 2 |
| D | 0 | 14289 | 2 |
| Mode M9 | |||
|---|---|---|---|
| Quadrant | BADHDUFLAG | Total packets | Discarded packets |
| A | 0 | 21 | 0 |
| B | 0 | 21 | 0 |
| C | 0 | 21 | 0 |
| D | 0 | 21 | 0 |
| Mode SS | |||
|---|---|---|---|
| Quadrant | BADHDUFLAG | Total packets | Discarded packets |
| A | 0 | 102 | 0 |
| B | 0 | 102 | 0 |
| C | 0 | 102 | 0 |
| D | 0 | 102 | 0 |
| Quadrant | Total seconds | Saturated seconds | Saturation percentage |
|---|---|---|---|
| A | 4944 | 26 | 0.525890% |
| B | 4944 | 16 | 0.323625% |
| C | 4944 | 13 | 0.262945% |
| D | 4945 | 251 | 5.075834% |
Noise dominated data is calculated using 1-second bins in cleaned event files. If a bin has >2000 counts, and if more than 50% of those come from <1% of pixels, then it is considered to be noise-dominated and hence unusable.
| Quadrant | # 1 sec bins | Bins with >0 counts | Bins with >2000 counts | High rate bins dominated by noise | Noise dominated (total time) | Noise dominated (detector-on time) | Marked lightcurve |
|---|---|---|---|---|---|---|---|
| A | 7037 | 4945 | 8 | 8 | 0.11% | 0.16% | 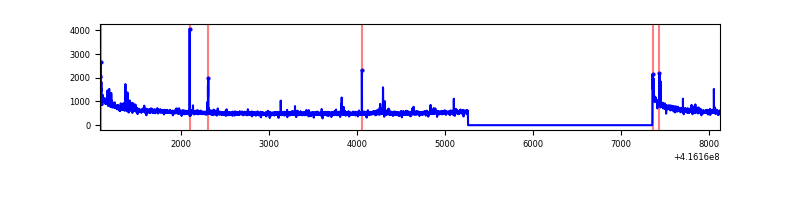 |
| B | 7037 | 4945 | 2 | 2 | 0.03% | 0.04% | 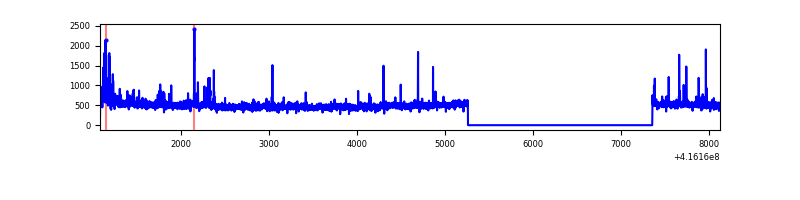 |
| C | 7037 | 4945 | 5 | 5 | 0.07% | 0.10% | 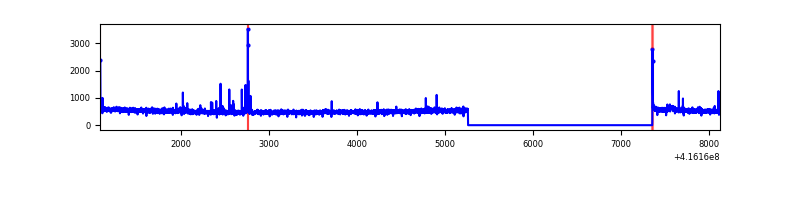 |
| D | 7038 | 4946 | 225 | 225 | 3.20% | 4.55% | 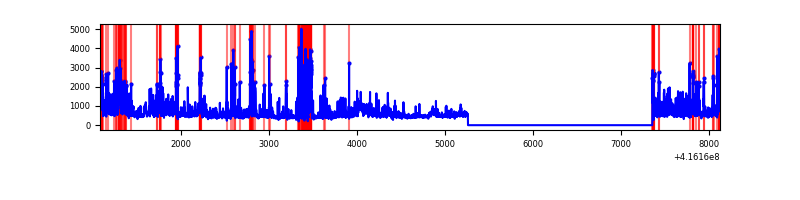 |
Top three noisy pixels from each quadrant. If the there are fewer than three noisy pixels in the level2.evt file, extra rows are filled as -1
| Pixel properties | Quadrant properties | ||||||
|---|---|---|---|---|---|---|---|
| Quadrant | DetID | PixID | Counts | Sigma | Mean | Median | Sigma |
| A | 10 | 83 | 456911 | 3797.14 | 598 | 590 | 120.2 |
| A | 13 | 248 | 47349 | 389.09 | 598 | 590 | 120.2 |
| A | 12 | 189 | 10730 | 84.38 | 598 | 590 | 120.2 |
| B | 0 | 245 | 78270 | 688.81 | 596 | 582 | 112.8 |
| B | 5 | 255 | 50292 | 440.74 | 596 | 582 | 112.8 |
| B | 0 | 230 | 42310 | 369.97 | 596 | 582 | 112.8 |
| C | 15 | 214 | 211845 | 1581.66 | 578 | 584 | 133.6 |
| C | 14 | 254 | 42944 | 317.14 | 578 | 584 | 133.6 |
| C | 0 | 10 | 15455 | 111.34 | 578 | 584 | 133.6 |
| D | 12 | 227 | 963762 | 7149.07 | 559 | 544 | 134.7 |
| D | 1 | 47 | 159139 | 1177.1 | 559 | 544 | 134.7 |
| D | 13 | 249 | 147540 | 1091.01 | 559 | 544 | 134.7 |
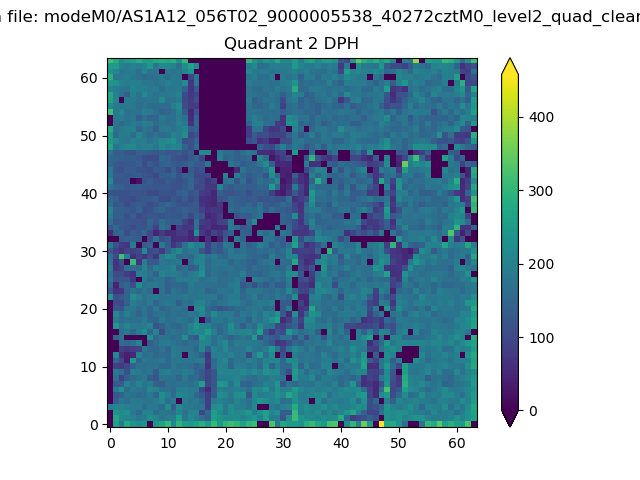
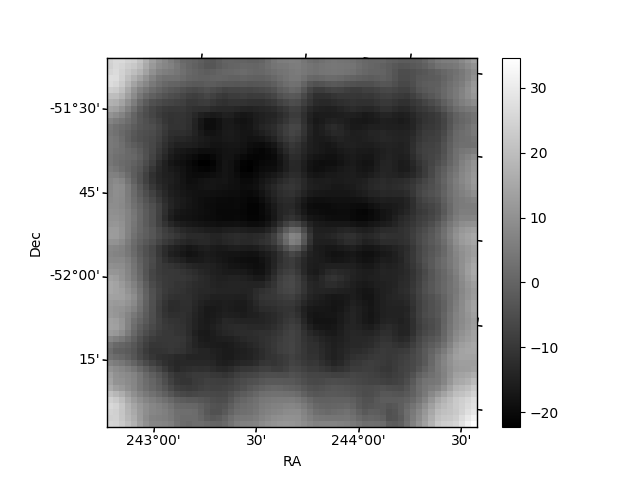
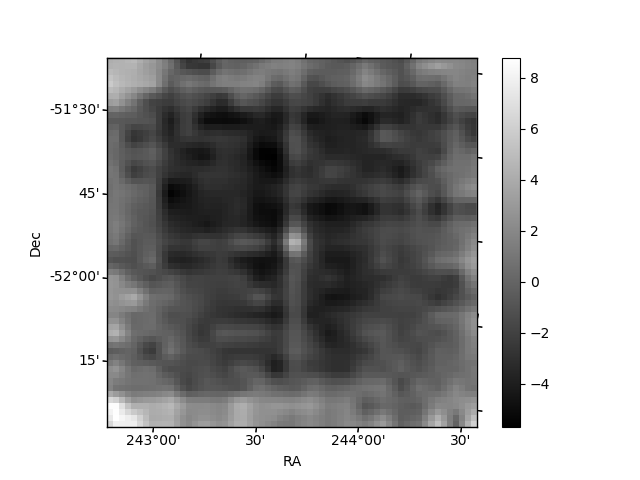
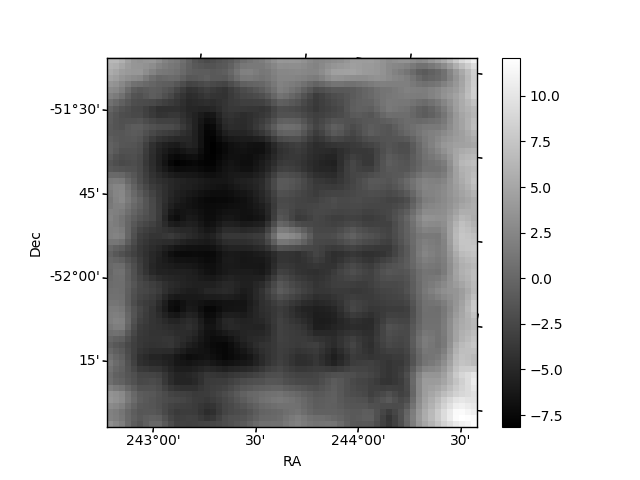
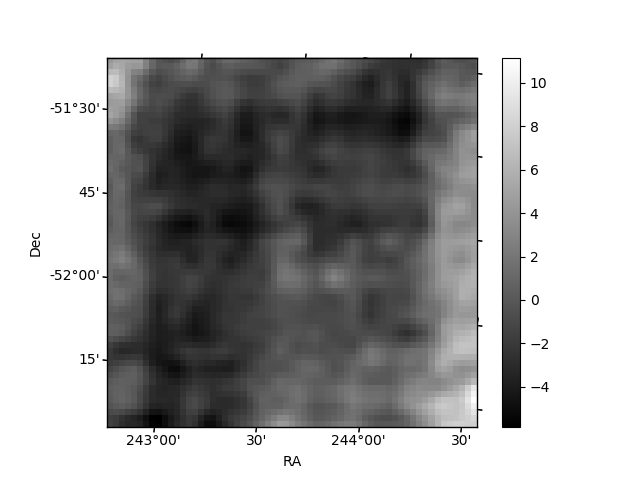
Histogram calculated using DETX and DETY for each event in the final _common_clean file
| Quadrant A | 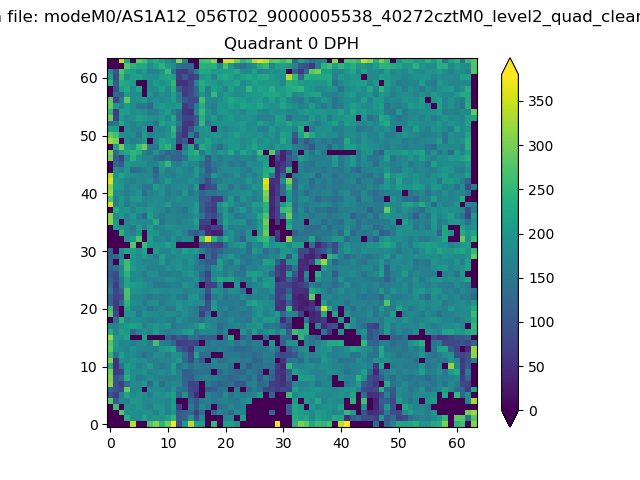 |
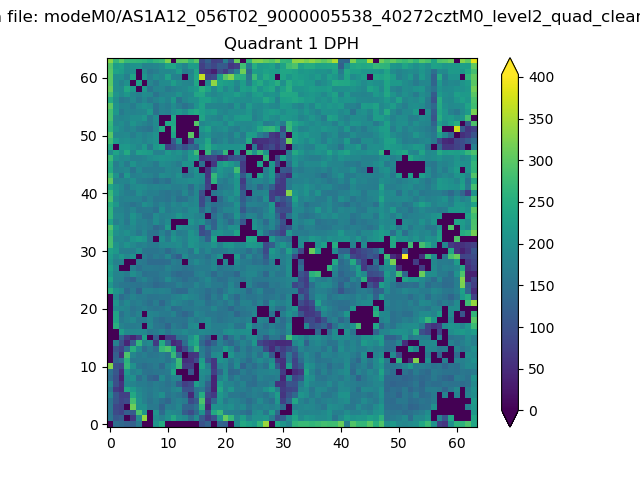 |
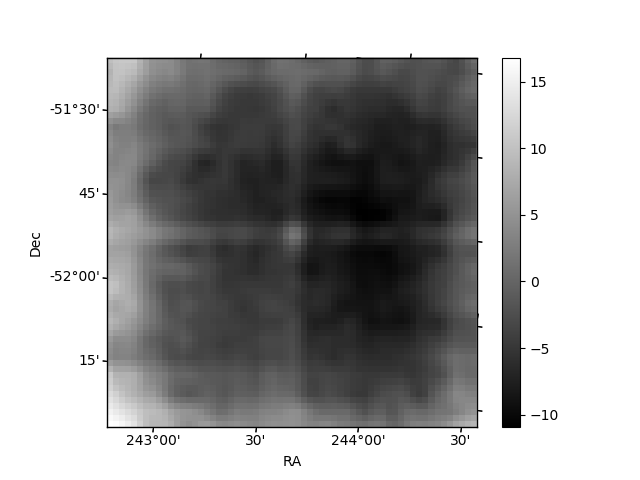
Quadrant B |
|---|---|---|---|
| Quadrant D | 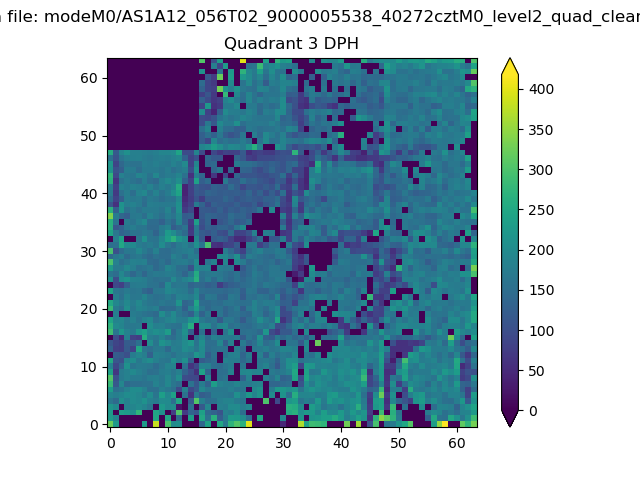 |
 |
Quadrant C |
| Plot type | Count rate plots | Images |
|---|---|---|
| Comparison with Poisson distribution Blue bars denote a histogram of data divided into 1 sec bins. Red curve is a Poisson curve with rate = median count rate of data. |
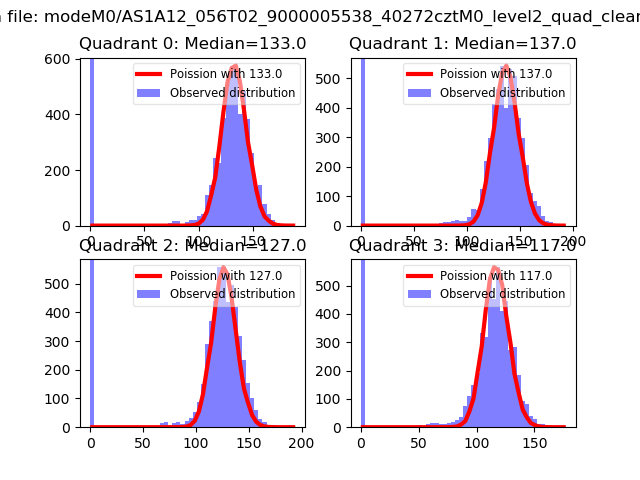 |
 |
| Quadrant-wise count rates Data is divided into 100 sec bins |
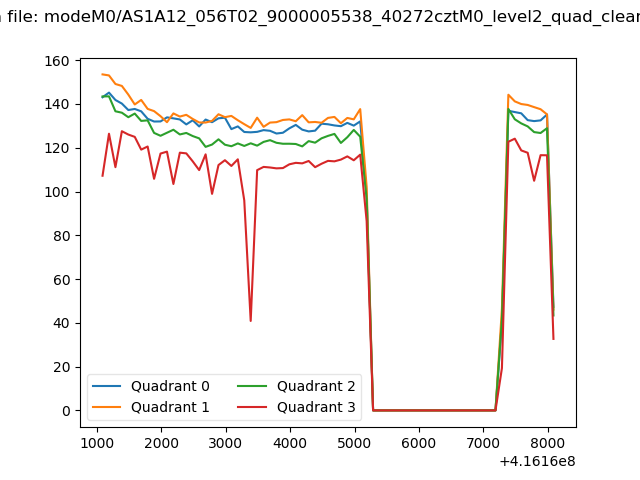 |
|
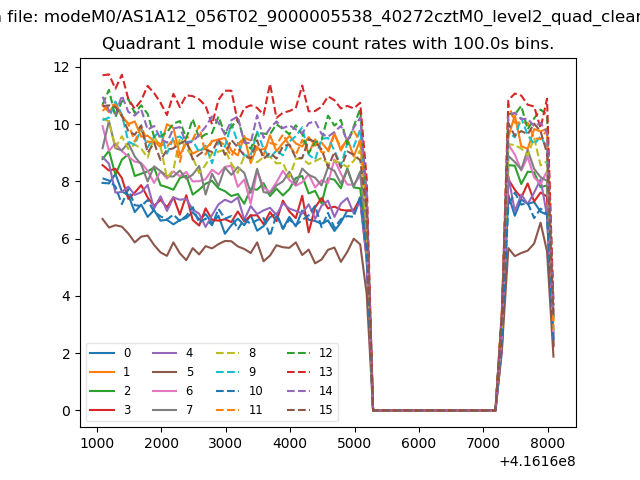
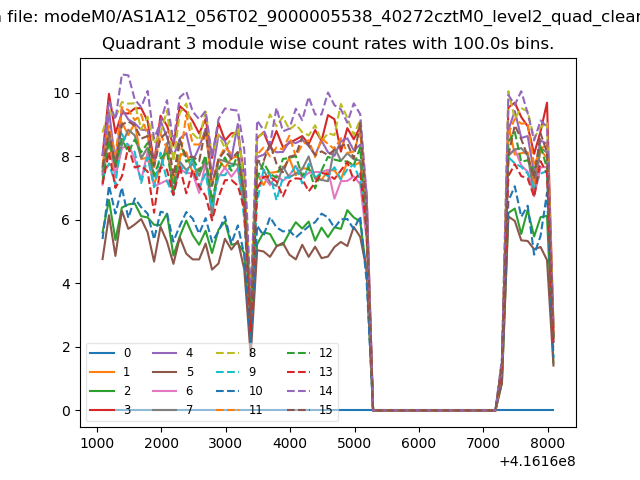
| Module-wise count rates for Quadrant A Data is divided into 100 sec bins |
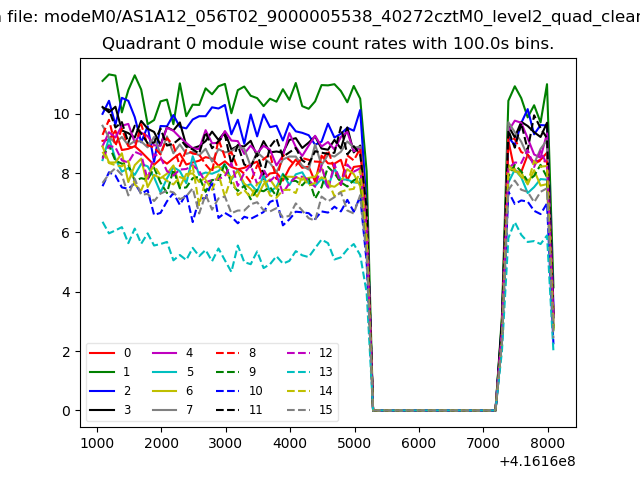 |
 |
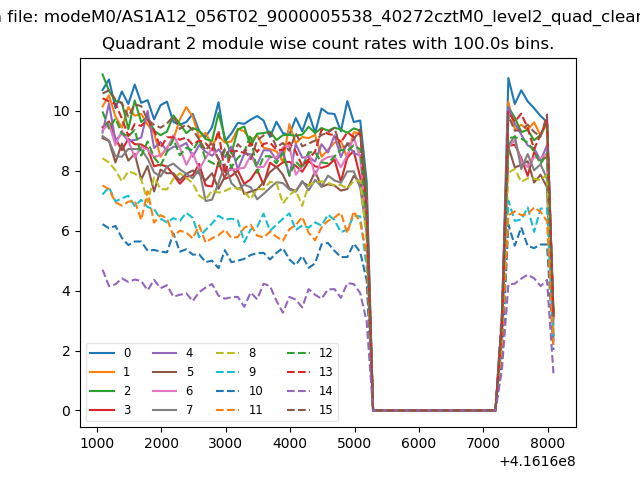
| Module-wise count rates for Quadrant B Data is divided into 100 sec bins |
 |
 |
| Module-wise count rates for Quadrant C Data is divided into 100 sec bins |
 |
 |
| Module-wise count rates for Quadrant D Data is divided into 100 sec bins |
 |
 |
| Parameter | Plot |
|---|---|
| CZT HV Monitor |  |
| D_VDD | 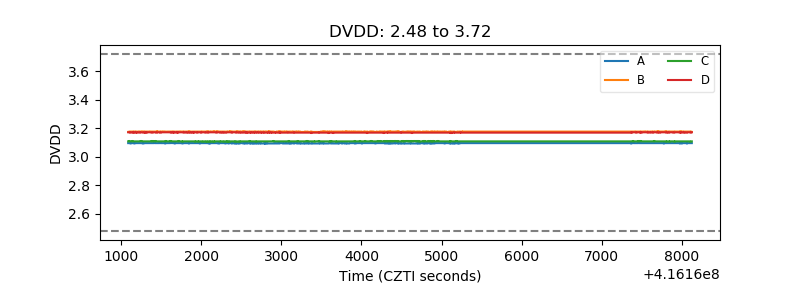 |
| Temperature 1 | 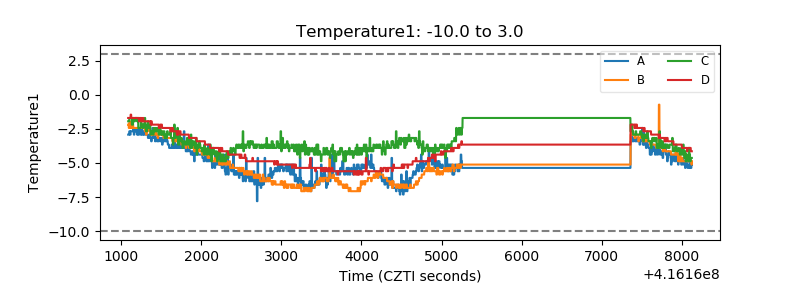 |
| Veto HV Monitor | 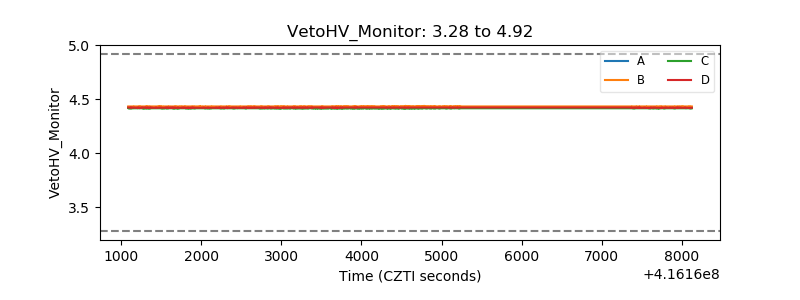 |
| Veto LLD | 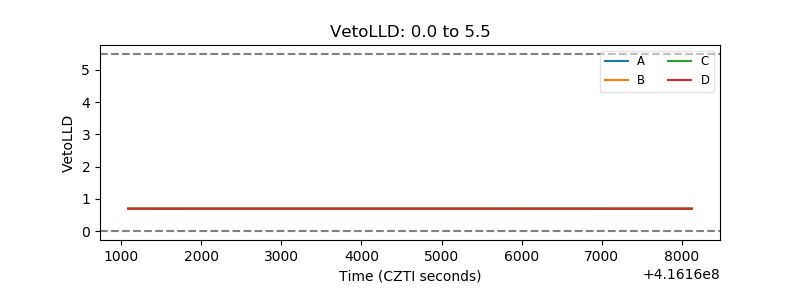 |
| Alpha Counter | 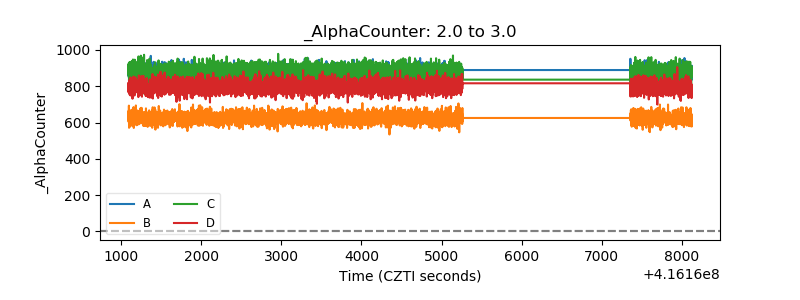 |
| _CPM_Rate | 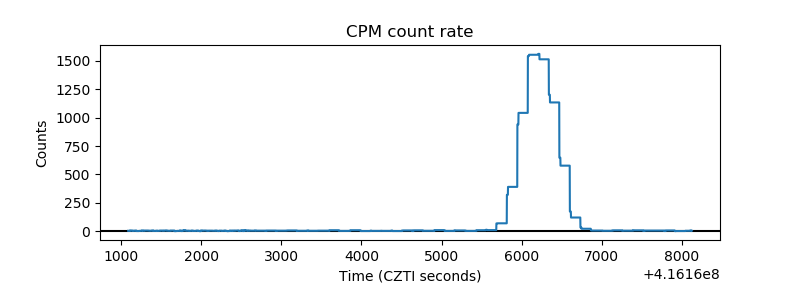 |
| CZT Counter | 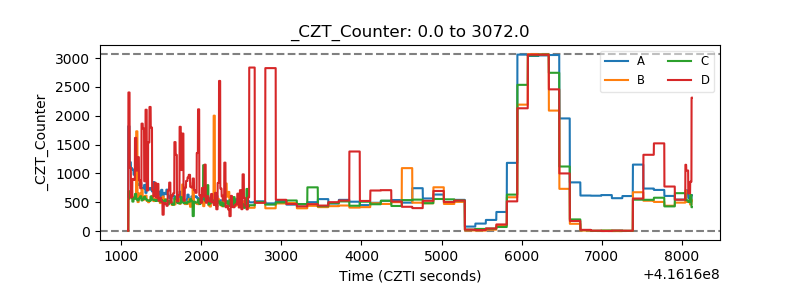 |
| +2.5 Volts monitor | 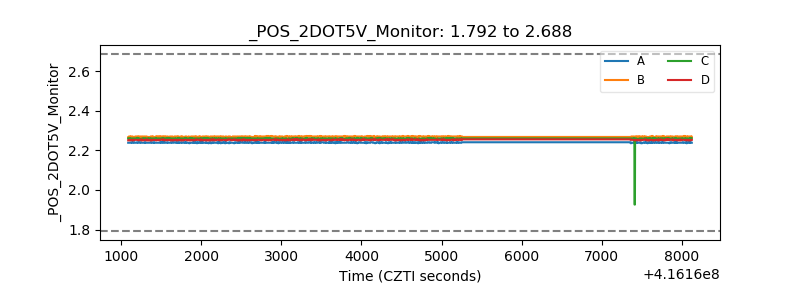 |
| +5 Volts monitor | 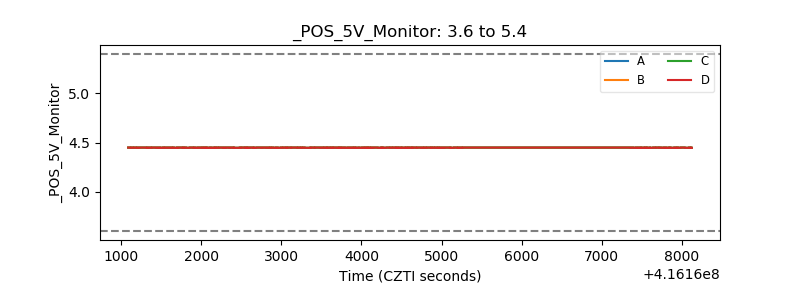 |
| _ROLL_ROT | 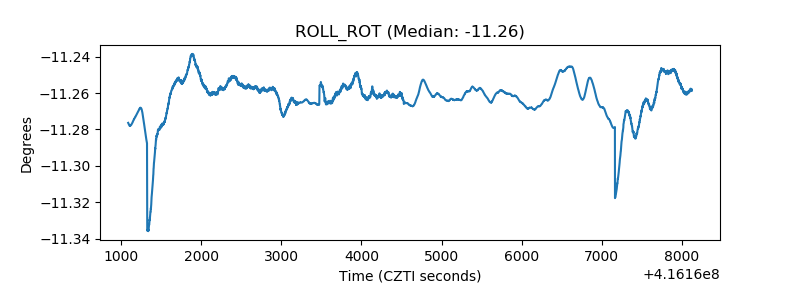 |
| _Roll_DEC | 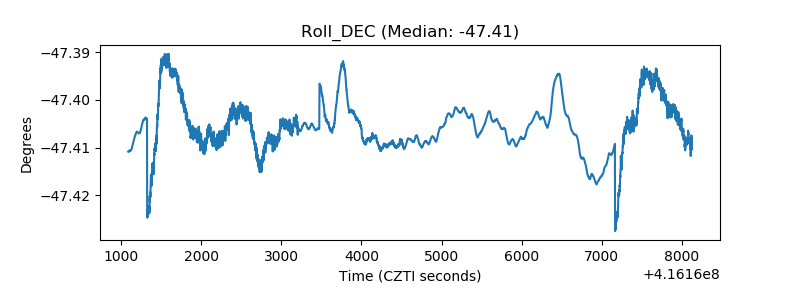 |
| _Roll_RA | 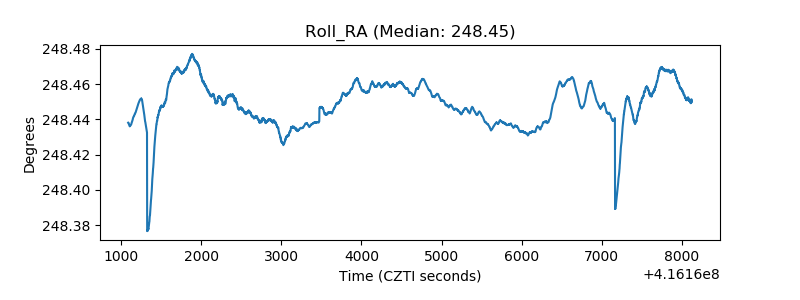 |
| Veto Counter | 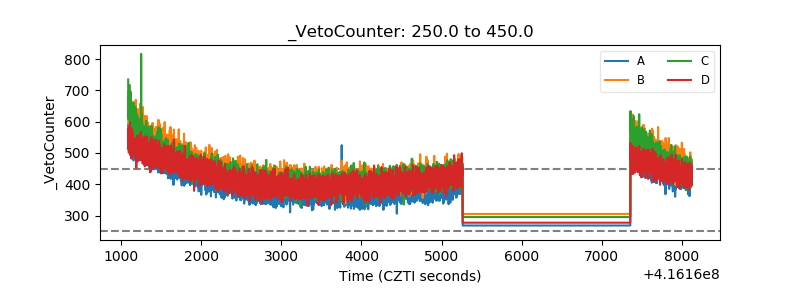 |