| Param | Original file | Final file |
|---|---|---|
| Filename | modeM0/AS1A12_056T02_9000005538_40273cztM0_level2.fits | modeM0/AS1A12_056T02_9000005538_40273cztM0_level2_quad_clean.evt |
| Size (bytes) | 310,248,000 | 89,225,280 |
| Size | 295.9 MB | 85.1 MB |
| Events in quadrant A | 2,711,633 | 616,873 |
| Events in quadrant B | 2,452,230 | 630,606 |
| Events in quadrant C | 2,418,968 | 591,302 |
| Events in quadrant D | 3,526,211 | 525,290 |
| Mode M0 | |||
|---|---|---|---|
| Quadrant | BADHDUFLAG | Total packets | Discarded packets |
| A | 0 | 10966 | 3 |
| B | 0 | 10298 | 2 |
| C | 0 | 9985 | 2 |
| D | 0 | 13802 | 2 |
| Mode M9 | |||
|---|---|---|---|
| Quadrant | BADHDUFLAG | Total packets | Discarded packets |
| A | 0 | 35 | 0 |
| B | 0 | 35 | 0 |
| C | 0 | 35 | 0 |
| D | 0 | 36 | 0 |
| Mode SS | |||
|---|---|---|---|
| Quadrant | BADHDUFLAG | Total packets | Discarded packets |
| A | 0 | 98 | 0 |
| B | 0 | 98 | 0 |
| C | 0 | 98 | 0 |
| D | 0 | 98 | 0 |
| Quadrant | Total seconds | Saturated seconds | Saturation percentage |
|---|---|---|---|
| A | 4816 | 19 | 0.394518% |
| B | 4816 | 54 | 1.121262% |
| C | 4816 | 15 | 0.311462% |
| D | 4816 | 225 | 4.671927% |
Noise dominated data is calculated using 1-second bins in cleaned event files. If a bin has >2000 counts, and if more than 50% of those come from <1% of pixels, then it is considered to be noise-dominated and hence unusable.
| Quadrant | # 1 sec bins | Bins with >0 counts | Bins with >2000 counts | High rate bins dominated by noise | Noise dominated (total time) | Noise dominated (detector-on time) | Marked lightcurve |
|---|---|---|---|---|---|---|---|
| A | 6969 | 4817 | 4 | 4 | 0.06% | 0.08% | 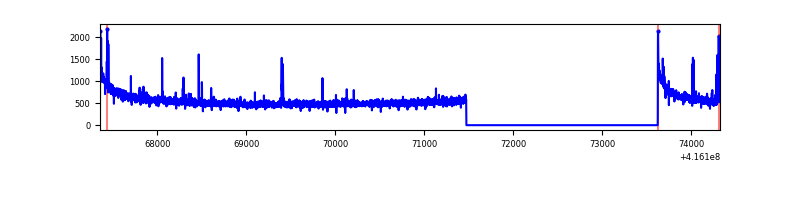 |
| B | 6969 | 4817 | 36 | 36 | 0.52% | 0.75% | 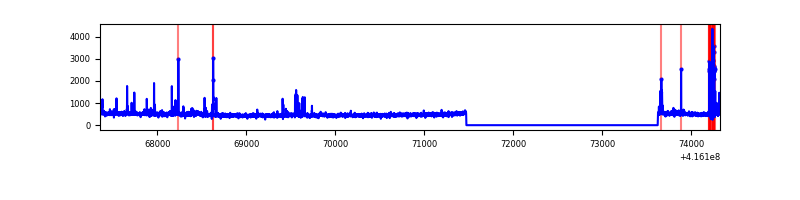 |
| C | 6969 | 4817 | 7 | 7 | 0.10% | 0.15% | 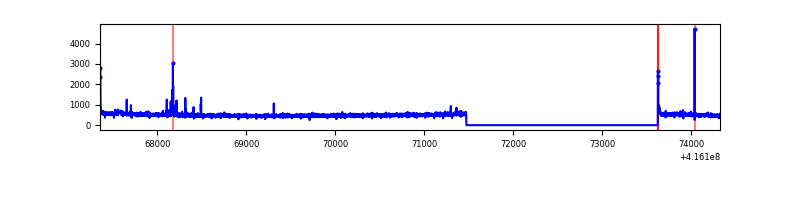 |
| D | 6969 | 4817 | 201 | 201 | 2.88% | 4.17% | 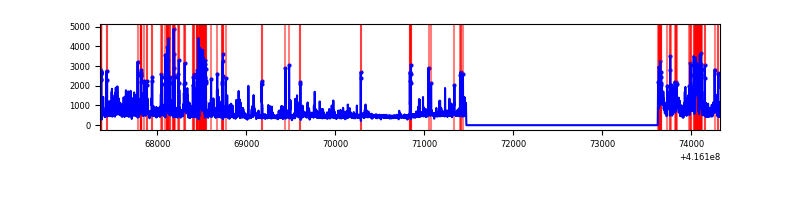 |
Top three noisy pixels from each quadrant. If the there are fewer than three noisy pixels in the level2.evt file, extra rows are filled as -1
| Pixel properties | Quadrant properties | ||||||
|---|---|---|---|---|---|---|---|
| Quadrant | DetID | PixID | Counts | Sigma | Mean | Median | Sigma |
| A | 10 | 83 | 443629 | 3864.45 | 566 | 557 | 114.7 |
| A | 13 | 248 | 54961 | 474.51 | 566 | 557 | 114.7 |
| A | 13 | 6 | 11585 | 96.19 | 566 | 557 | 114.7 |
| B | 0 | 245 | 139171 | 1293.1 | 564 | 550 | 107.2 |
| B | 5 | 255 | 60027 | 554.82 | 564 | 550 | 107.2 |
| B | 0 | 230 | 28330 | 259.14 | 564 | 550 | 107.2 |
| C | 15 | 214 | 208665 | 1633.82 | 549 | 553 | 127.4 |
| C | 14 | 254 | 29452 | 226.88 | 549 | 553 | 127.4 |
| C | 0 | 10 | 23690 | 181.64 | 549 | 553 | 127.4 |
| D | 12 | 227 | 491417 | 3802.64 | 532 | 518 | 129.1 |
| D | 12 | 0 | 344540 | 2664.89 | 532 | 518 | 129.1 |
| D | 1 | 47 | 314901 | 2435.3 | 532 | 518 | 129.1 |
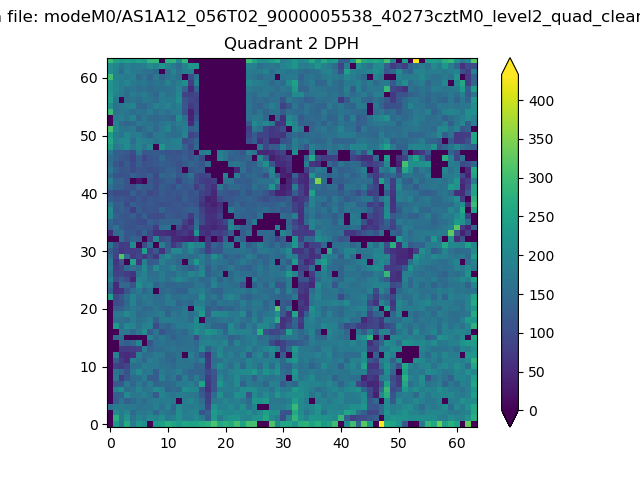
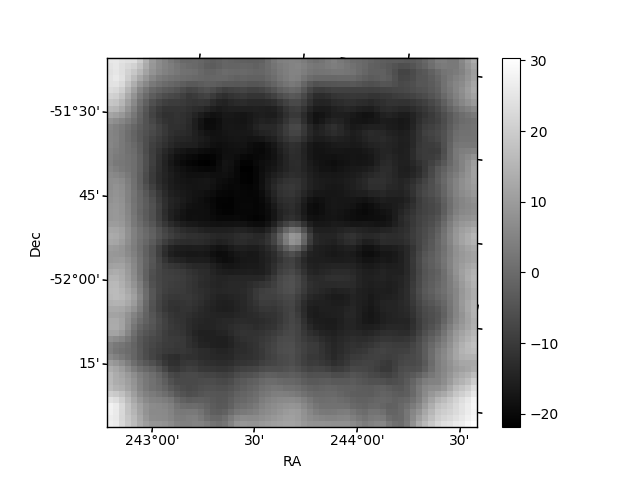
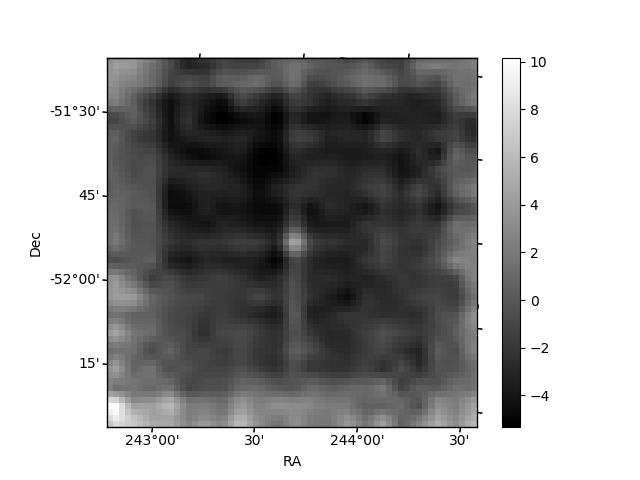
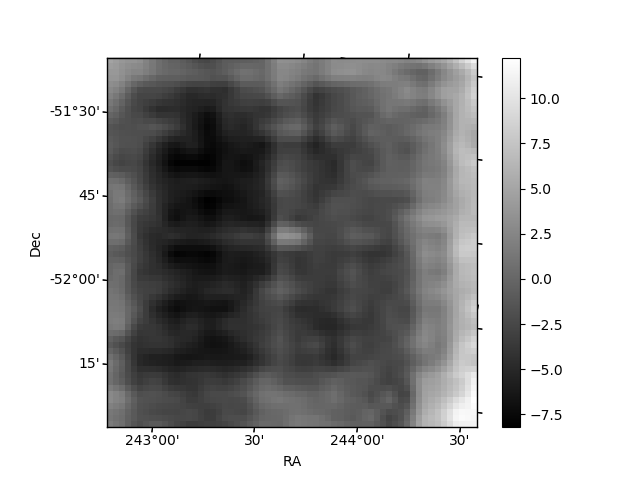
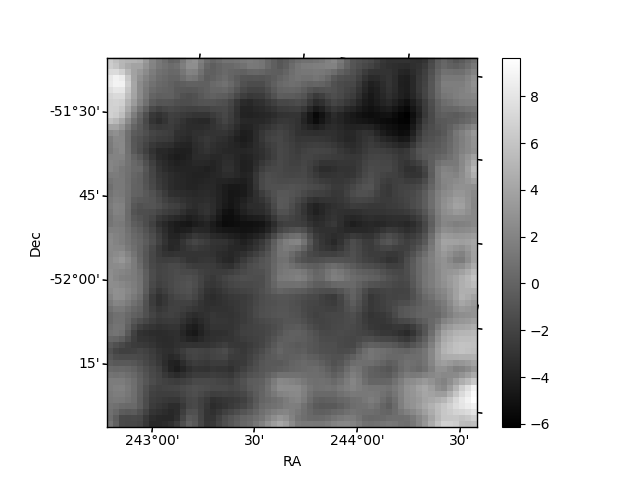
Histogram calculated using DETX and DETY for each event in the final _common_clean file
| Quadrant A | 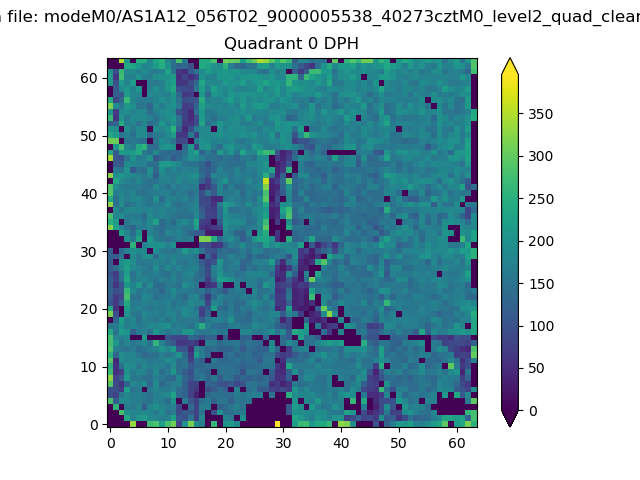 |
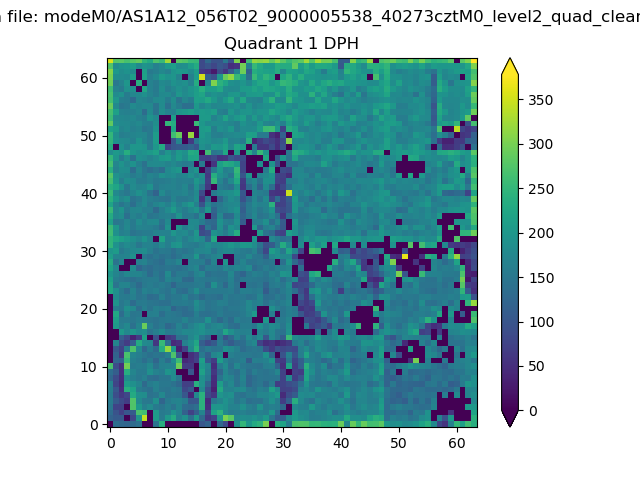 |
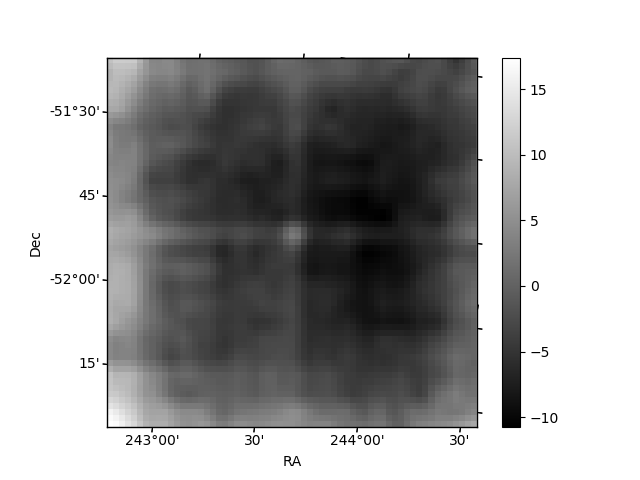
Quadrant B |
|---|---|---|---|
| Quadrant D | 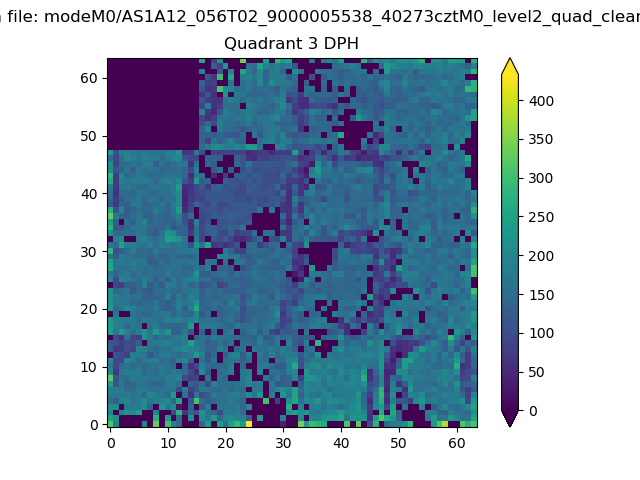 |
 |
Quadrant C |
| Plot type | Count rate plots | Images |
|---|---|---|
| Comparison with Poisson distribution Blue bars denote a histogram of data divided into 1 sec bins. Red curve is a Poisson curve with rate = median count rate of data. |
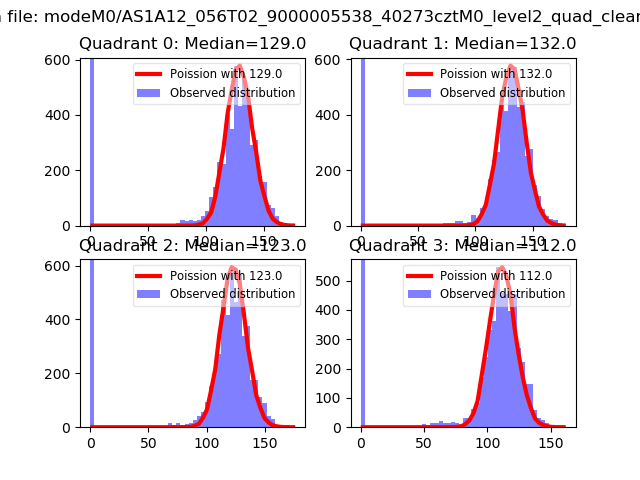 |
 |
| Quadrant-wise count rates Data is divided into 100 sec bins |
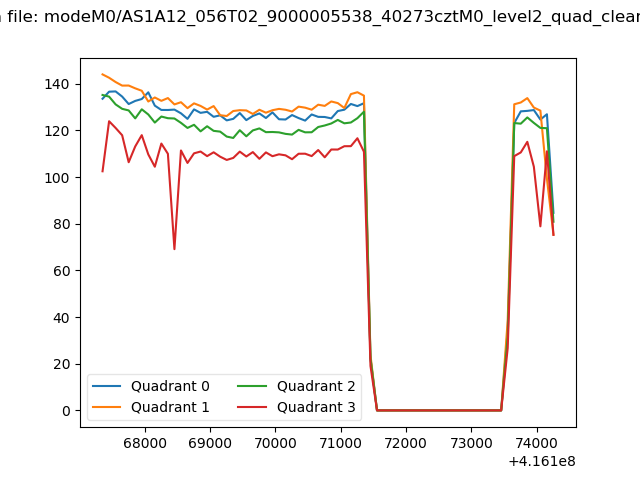 |
|
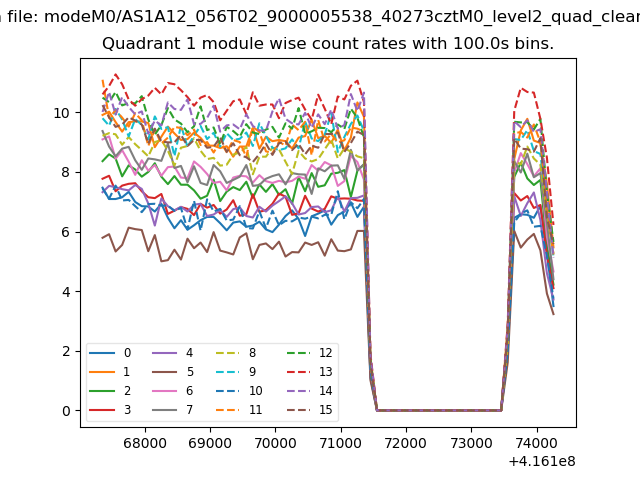
| Module-wise count rates for Quadrant A Data is divided into 100 sec bins |
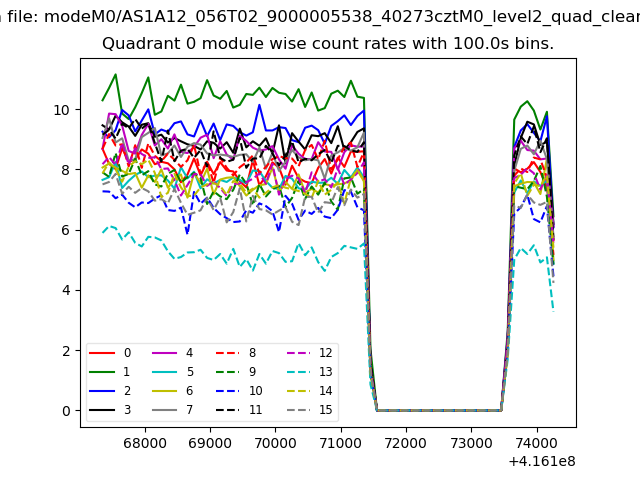 |
 |
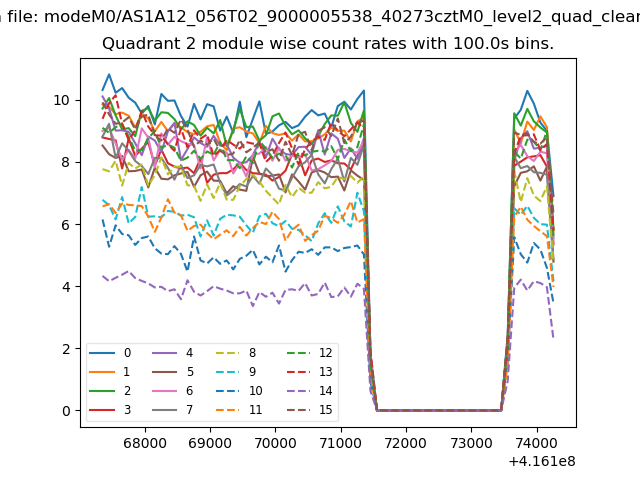
| Module-wise count rates for Quadrant B Data is divided into 100 sec bins |
 |
 |
| Module-wise count rates for Quadrant C Data is divided into 100 sec bins |
 |
 |
| Module-wise count rates for Quadrant D Data is divided into 100 sec bins |
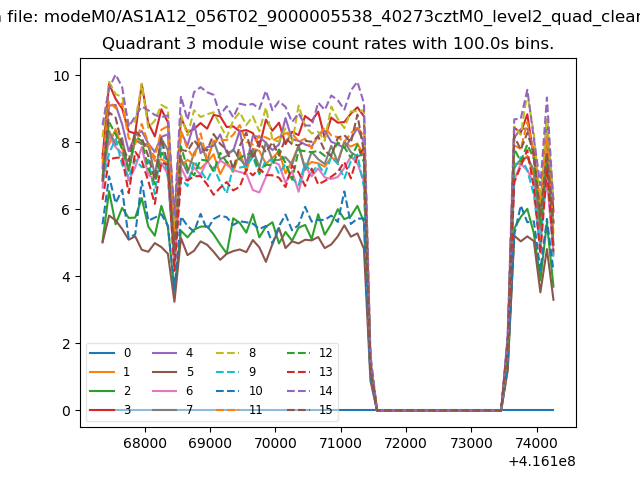 |
 |
| Parameter | Plot |
|---|---|
| CZT HV Monitor | 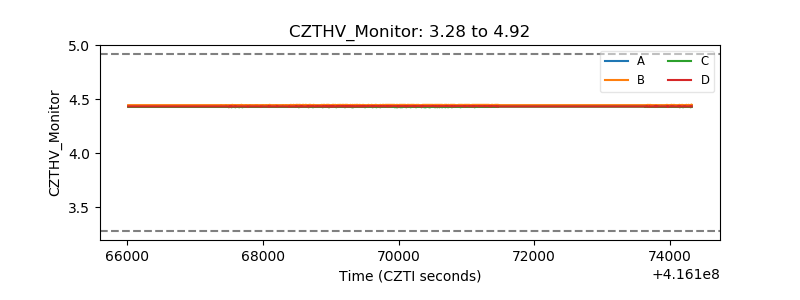 |
| D_VDD | 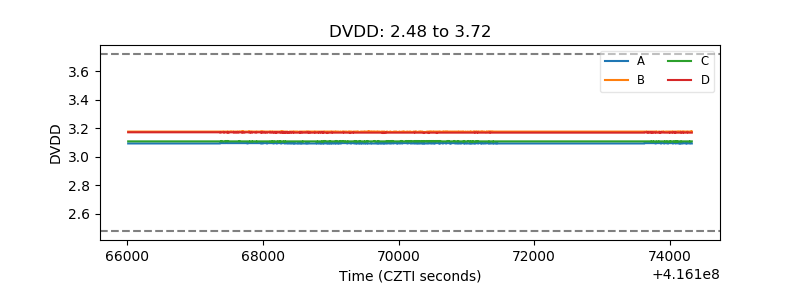 |
| Temperature 1 | 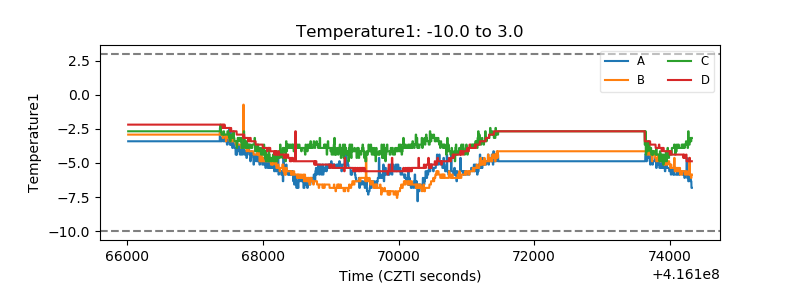 |
| Veto HV Monitor | 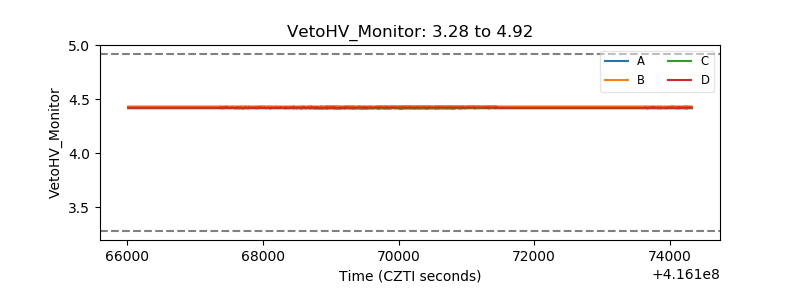 |
| Veto LLD | 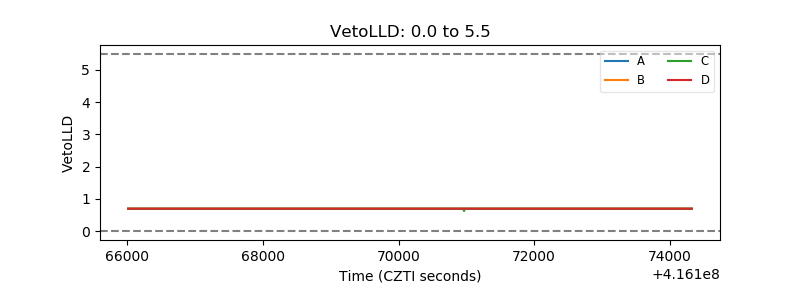 |
| Alpha Counter | 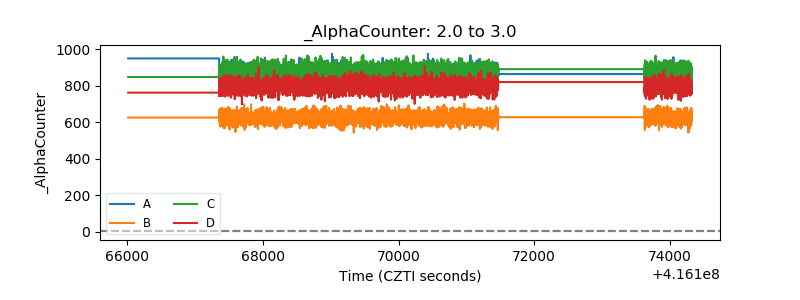 |
| _CPM_Rate | 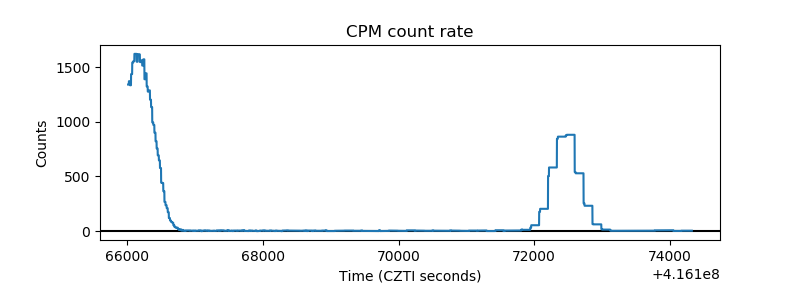 |
| CZT Counter | 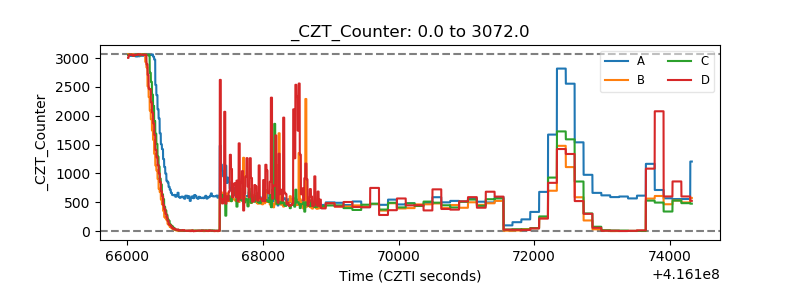 |
| +2.5 Volts monitor | 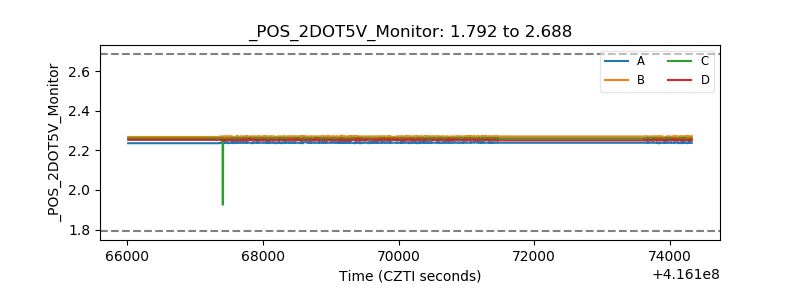 |
| +5 Volts monitor | 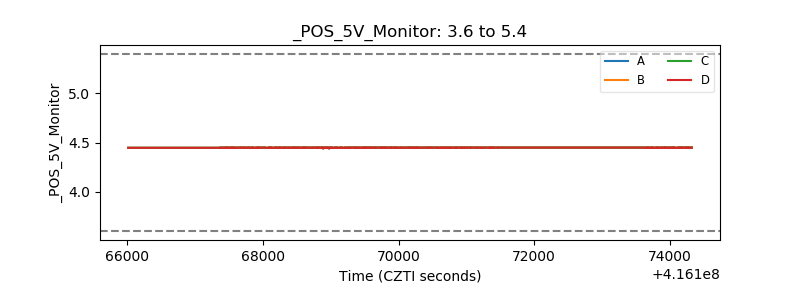 |
| _ROLL_ROT | 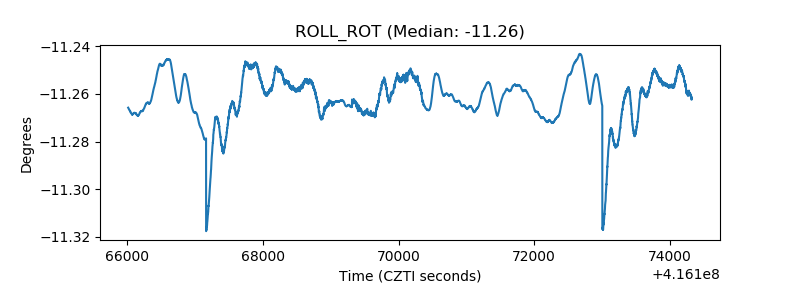 |
| _Roll_DEC | 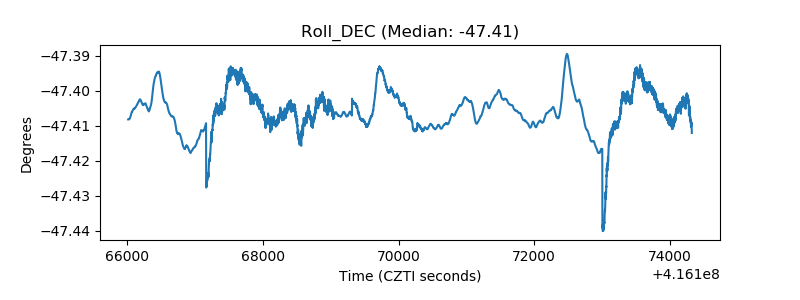 |
| _Roll_RA | 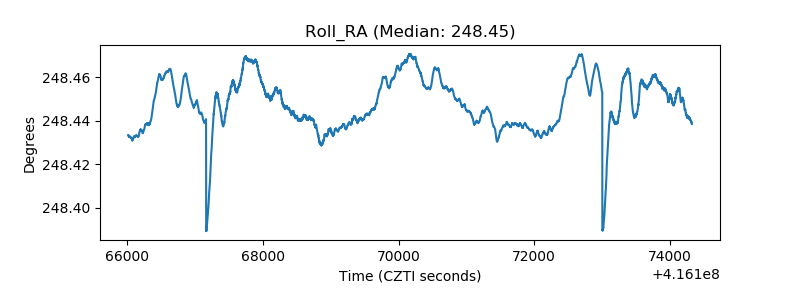 |
| Veto Counter | 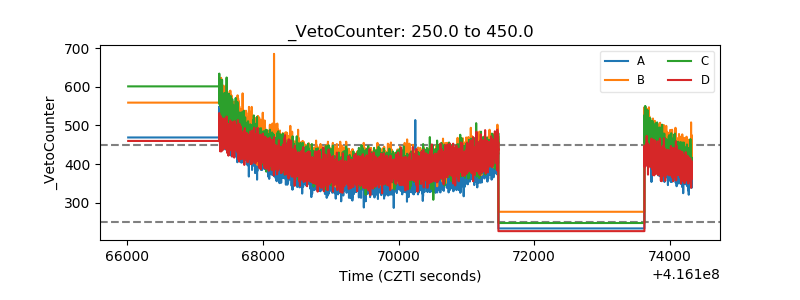 |