| Param | Original file | Final file |
|---|---|---|
| Filename | modeM0/AS1A12_056T02_9000005538_40274cztM0_level2.fits | modeM0/AS1A12_056T02_9000005538_40274cztM0_level2_quad_clean.evt |
| Size (bytes) | 315,120,960 | 85,769,280 |
| Size | 300.5 MB | 81.8 MB |
| Events in quadrant A | 2,652,722 | 588,218 |
| Events in quadrant B | 2,423,489 | 601,400 |
| Events in quadrant C | 2,397,184 | 568,184 |
| Events in quadrant D | 3,816,492 | 501,944 |
| Mode M0 | |||
|---|---|---|---|
| Quadrant | BADHDUFLAG | Total packets | Discarded packets |
| A | 0 | 10809 | 3 |
| B | 0 | 10325 | 2 |
| C | 0 | 9992 | 2 |
| D | 0 | 14685 | 2 |
| Mode M9 | |||
|---|---|---|---|
| Quadrant | BADHDUFLAG | Total packets | Discarded packets |
| A | 0 | 26 | 0 |
| B | 0 | 26 | 0 |
| C | 0 | 26 | 0 |
| D | 0 | 27 | 0 |
| Mode SS | |||
|---|---|---|---|
| Quadrant | BADHDUFLAG | Total packets | Discarded packets |
| A | 0 | 98 | 0 |
| B | 0 | 98 | 0 |
| C | 0 | 98 | 0 |
| D | 0 | 98 | 0 |
| Quadrant | Total seconds | Saturated seconds | Saturation percentage |
|---|---|---|---|
| A | 4809 | 31 | 0.644625% |
| B | 4809 | 64 | 1.330838% |
| C | 4809 | 19 | 0.395093% |
| D | 4809 | 252 | 5.240175% |
Noise dominated data is calculated using 1-second bins in cleaned event files. If a bin has >2000 counts, and if more than 50% of those come from <1% of pixels, then it is considered to be noise-dominated and hence unusable.
| Quadrant | # 1 sec bins | Bins with >0 counts | Bins with >2000 counts | High rate bins dominated by noise | Noise dominated (total time) | Noise dominated (detector-on time) | Marked lightcurve |
|---|---|---|---|---|---|---|---|
| A | 6932 | 4810 | 14 | 14 | 0.20% | 0.29% | 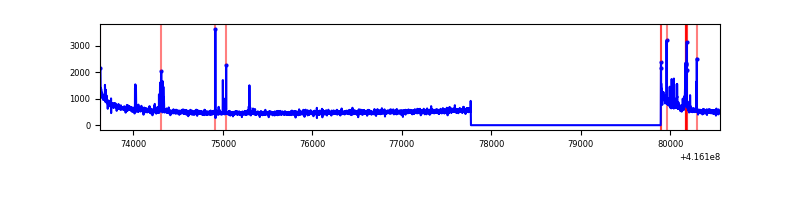 |
| B | 6932 | 4810 | 49 | 49 | 0.71% | 1.02% | 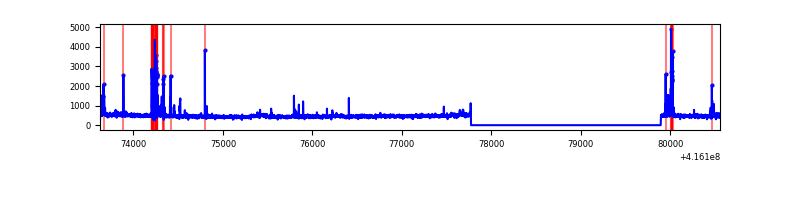 |
| C | 6932 | 4810 | 9 | 9 | 0.13% | 0.19% | 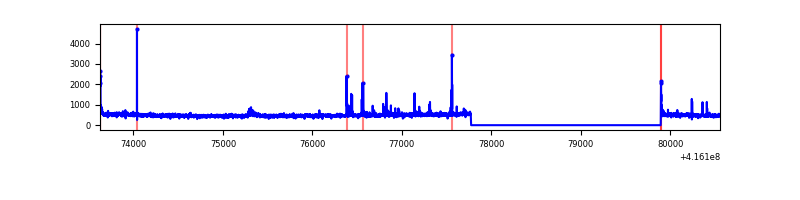 |
| D | 6932 | 4810 | 218 | 218 | 3.14% | 4.53% | 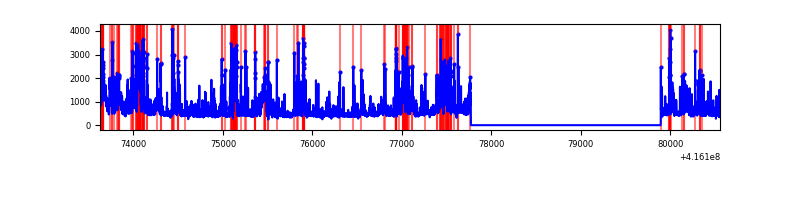 |
Top three noisy pixels from each quadrant. If the there are fewer than three noisy pixels in the level2.evt file, extra rows are filled as -1
| Pixel properties | Quadrant properties | ||||||
|---|---|---|---|---|---|---|---|
| Quadrant | DetID | PixID | Counts | Sigma | Mean | Median | Sigma |
| A | 10 | 83 | 428841 | 3825.82 | 544 | 534 | 112.0 |
| A | 13 | 248 | 103077 | 915.96 | 544 | 534 | 112.0 |
| A | 13 | 6 | 13419 | 115.09 | 544 | 534 | 112.0 |
| B | 0 | 245 | 153518 | 1480.61 | 541 | 527 | 103.3 |
| B | 5 | 255 | 91794 | 883.26 | 541 | 527 | 103.3 |
| B | 0 | 230 | 45312 | 433.42 | 541 | 527 | 103.3 |
| C | 15 | 214 | 208073 | 1660.42 | 533 | 536 | 125.0 |
| C | 14 | 254 | 58533 | 464.01 | 533 | 536 | 125.0 |
| C | 0 | 10 | 25699 | 201.32 | 533 | 536 | 125.0 |
| D | 12 | 227 | 696318 | 5441.98 | 518 | 504 | 127.9 |
| D | 9 | 19 | 314584 | 2456.43 | 518 | 504 | 127.9 |
| D | 12 | 0 | 301377 | 2353.14 | 518 | 504 | 127.9 |
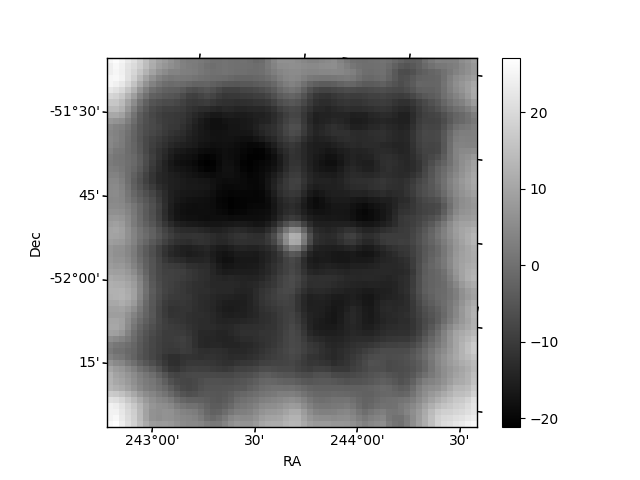
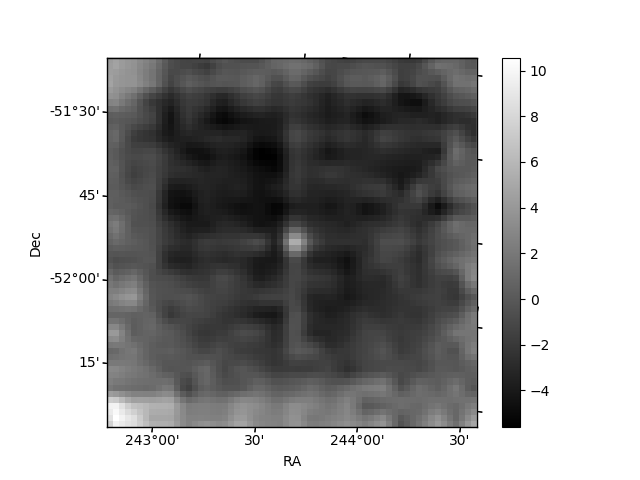
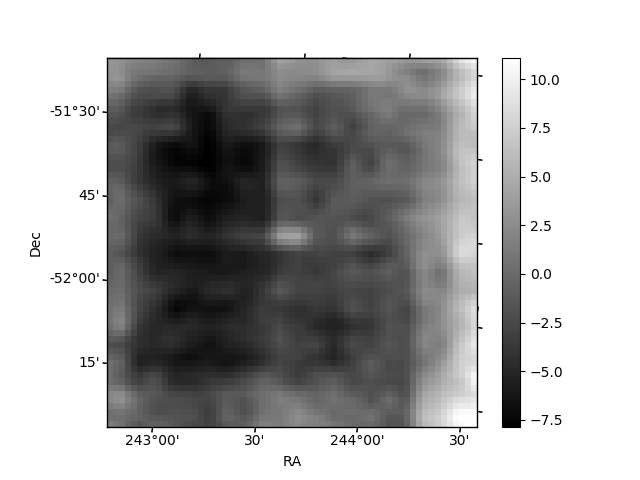
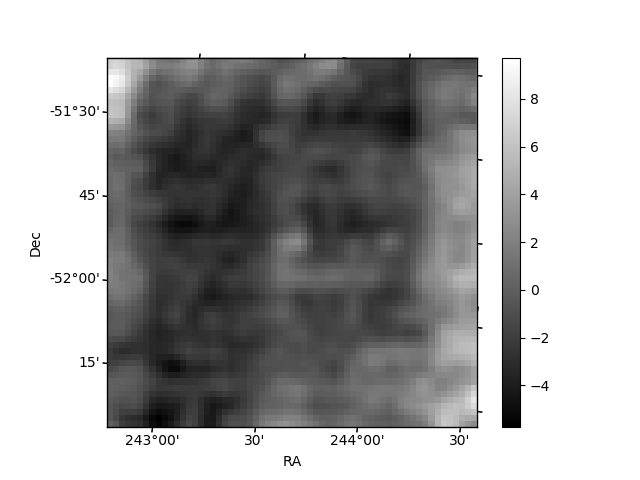
Histogram calculated using DETX and DETY for each event in the final _common_clean file
| Quadrant A | 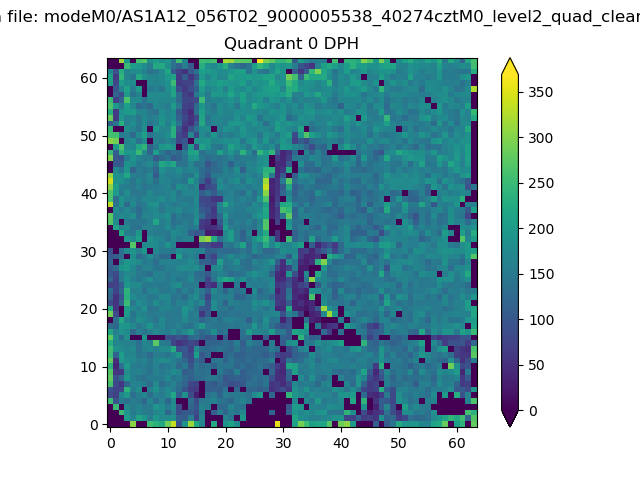 |
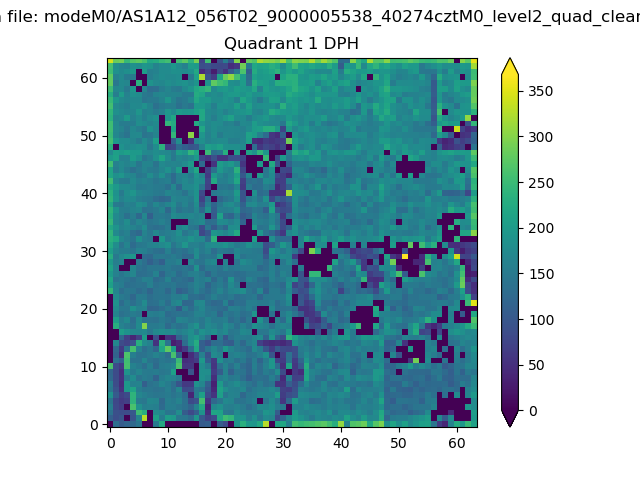 |
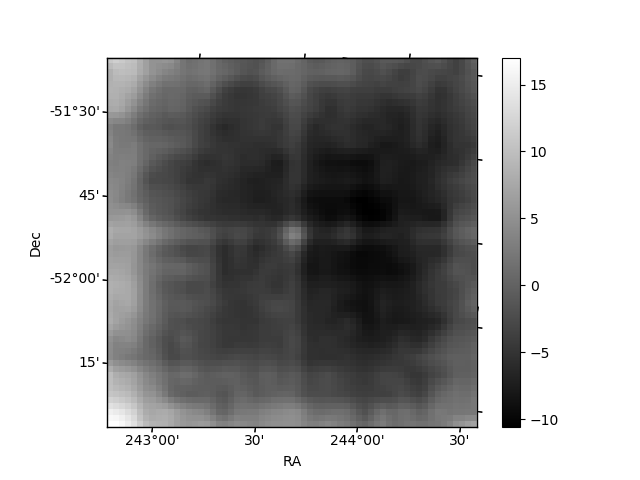
Quadrant B |
|---|---|---|---|
| Quadrant D | 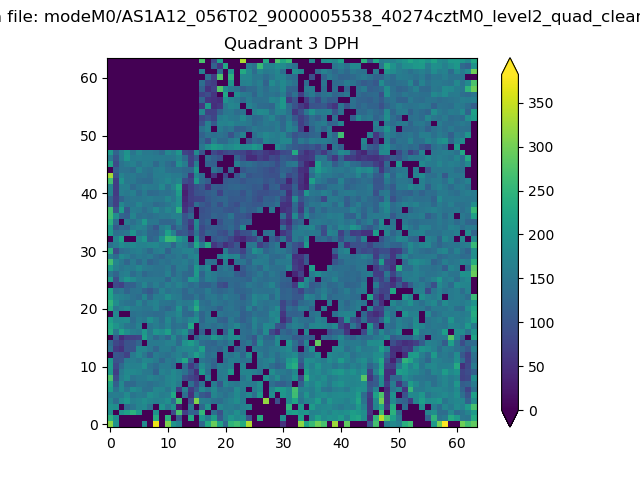 |
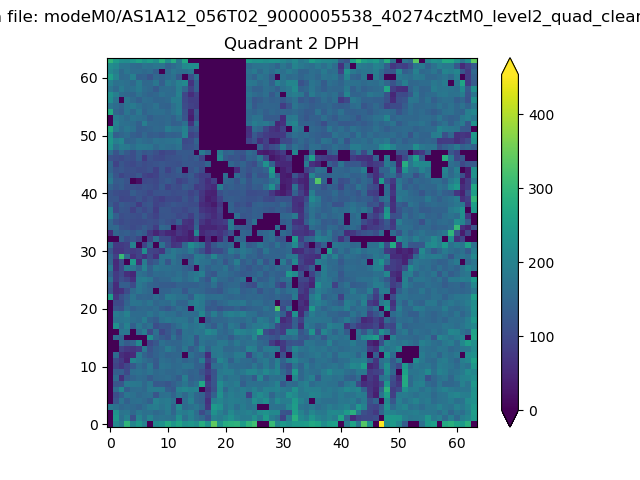 |
Quadrant C |
| Plot type | Count rate plots | Images |
|---|---|---|
| Comparison with Poisson distribution Blue bars denote a histogram of data divided into 1 sec bins. Red curve is a Poisson curve with rate = median count rate of data. |
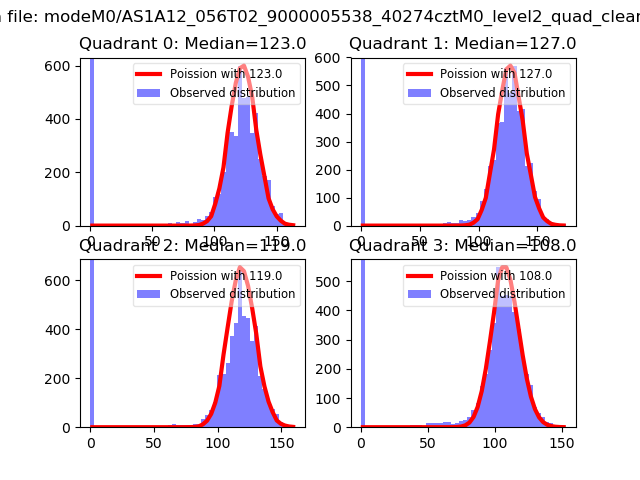 |
 |
| Quadrant-wise count rates Data is divided into 100 sec bins |
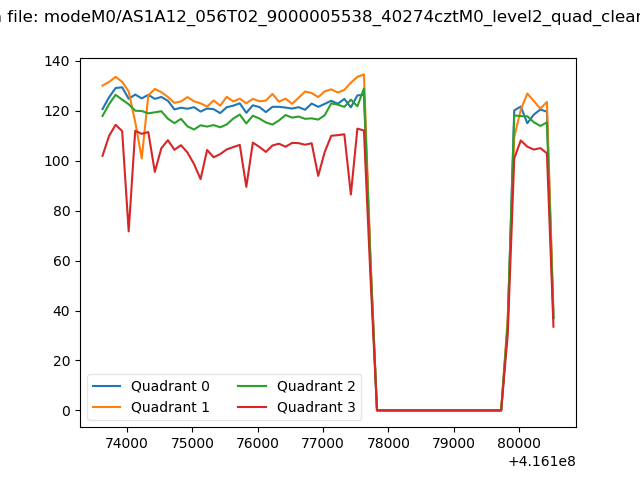 |
|
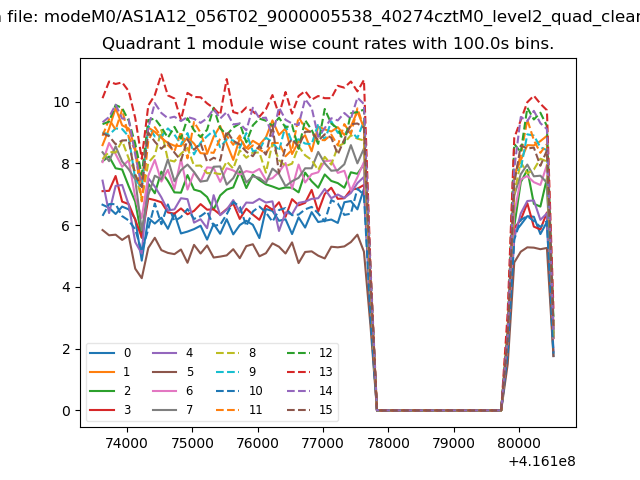
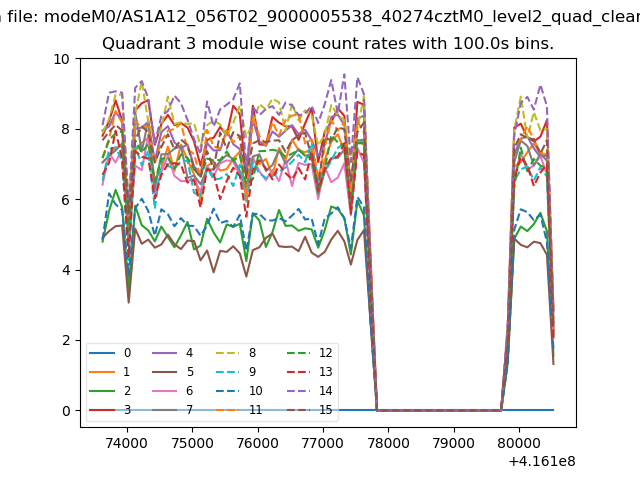
| Module-wise count rates for Quadrant A Data is divided into 100 sec bins |
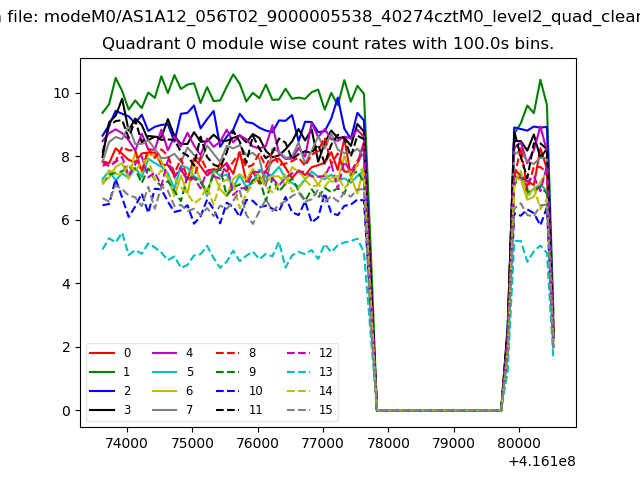 |
 |
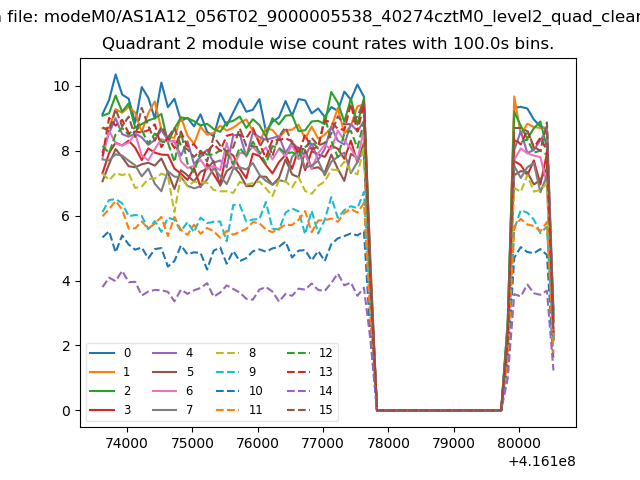
| Module-wise count rates for Quadrant B Data is divided into 100 sec bins |
 |
 |
| Module-wise count rates for Quadrant C Data is divided into 100 sec bins |
 |
 |
| Module-wise count rates for Quadrant D Data is divided into 100 sec bins |
 |
 |
| Parameter | Plot |
|---|---|
| CZT HV Monitor | 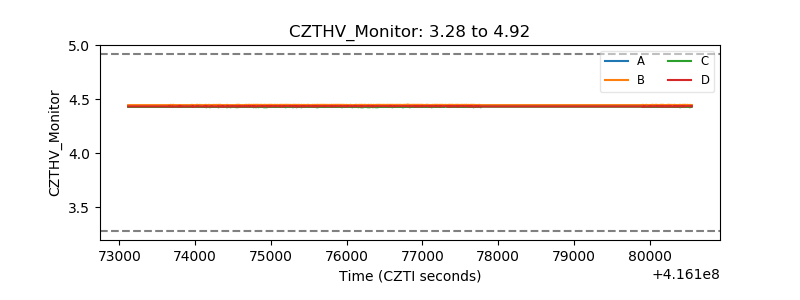 |
| D_VDD | 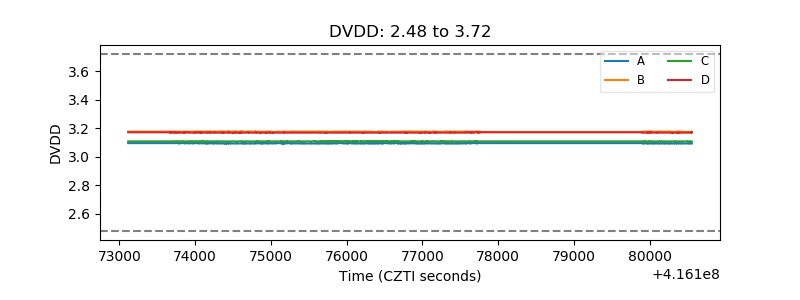 |
| Temperature 1 | 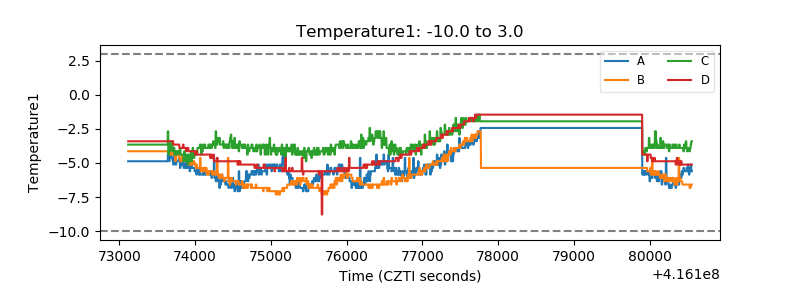 |
| Veto HV Monitor | 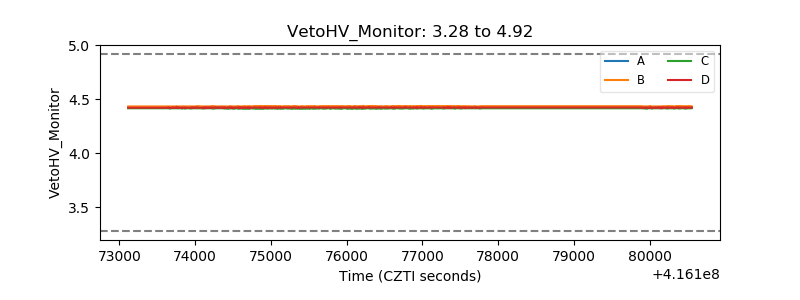 |
| Veto LLD | 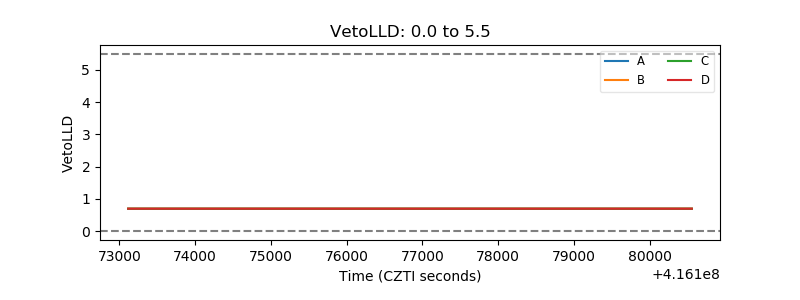 |
| Alpha Counter | 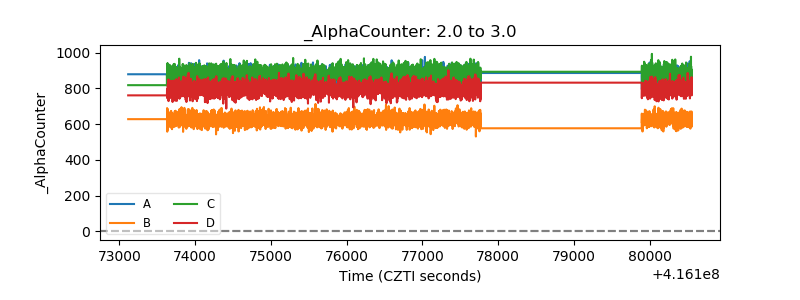 |
| _CPM_Rate | 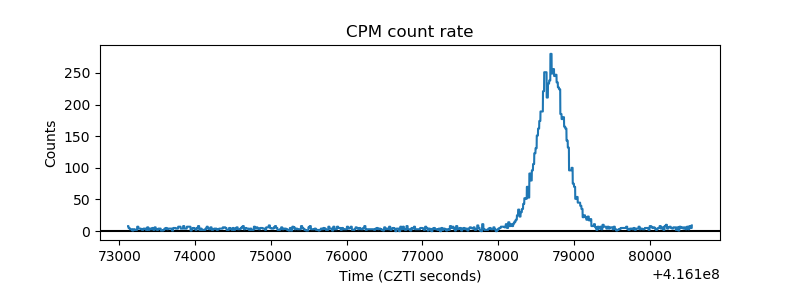 |
| CZT Counter | 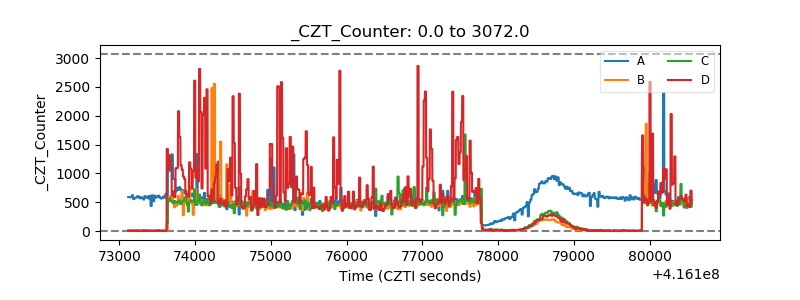 |
| +2.5 Volts monitor | 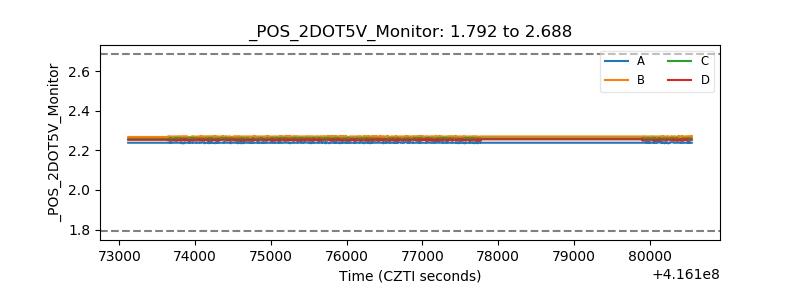 |
| +5 Volts monitor | 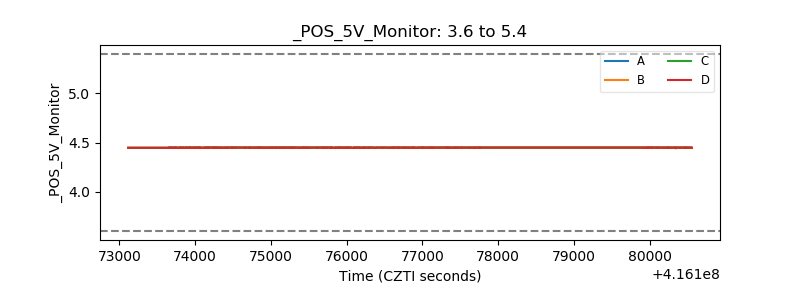 |
| _ROLL_ROT | 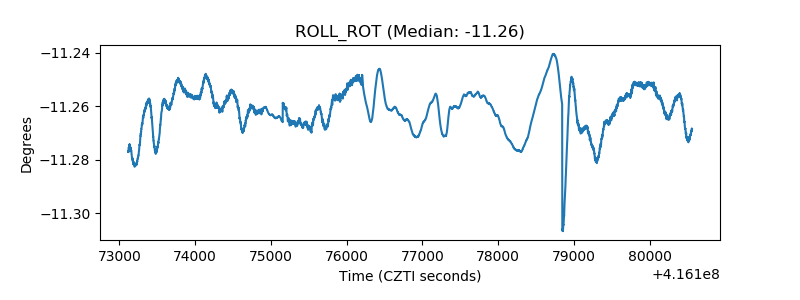 |
| _Roll_DEC | 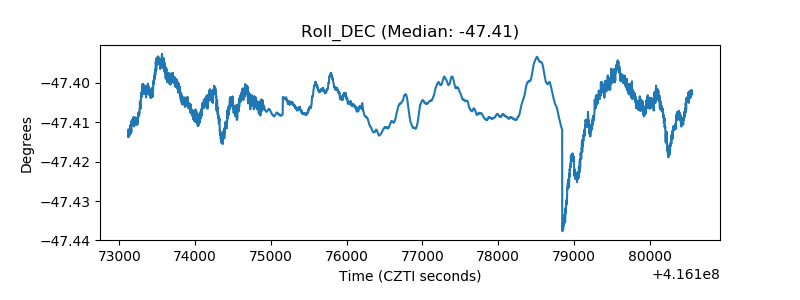 |
| _Roll_RA | 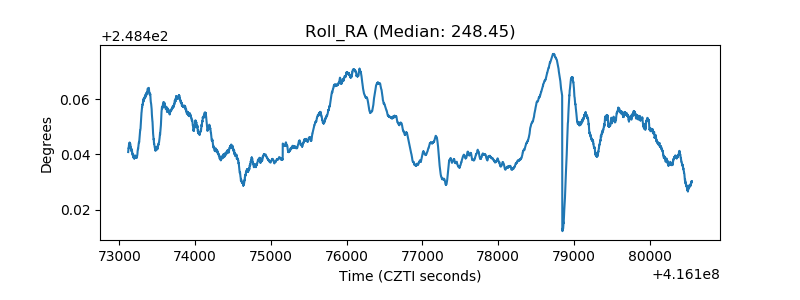 |
| Veto Counter | 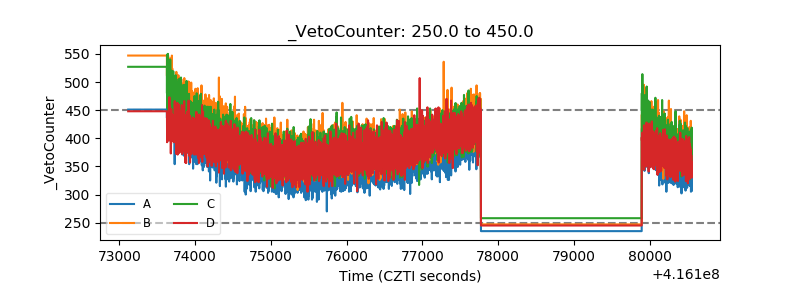 |