| Param | Original file | Final file |
|---|---|---|
| Filename | modeM0/AS1A12_056T02_9000005538_40275cztM0_level2.fits | modeM0/AS1A12_056T02_9000005538_40275cztM0_level2_quad_clean.evt |
| Size (bytes) | 320,964,480 | 91,134,720 |
| Size | 306.1 MB | 86.9 MB |
| Events in quadrant A | 2,899,735 | 615,245 |
| Events in quadrant B | 2,499,348 | 631,144 |
| Events in quadrant C | 2,561,178 | 601,357 |
| Events in quadrant D | 3,510,207 | 543,255 |
| Mode M0 | |||
|---|---|---|---|
| Quadrant | BADHDUFLAG | Total packets | Discarded packets |
| A | 0 | 11852 | 3 |
| B | 0 | 11024 | 2 |
| C | 0 | 10839 | 2 |
| D | 0 | 14087 | 2 |
| Mode M9 | |||
|---|---|---|---|
| Quadrant | BADHDUFLAG | Total packets | Discarded packets |
| A | 0 | 40 | 0 |
| B | 0 | 40 | 0 |
| C | 0 | 40 | 0 |
| D | 0 | 40 | 0 |
| Mode SS | |||
|---|---|---|---|
| Quadrant | BADHDUFLAG | Total packets | Discarded packets |
| A | 0 | 108 | 0 |
| B | 0 | 108 | 0 |
| C | 0 | 108 | 0 |
| D | 0 | 108 | 0 |
| Quadrant | Total seconds | Saturated seconds | Saturation percentage |
|---|---|---|---|
| A | 5268 | 44 | 0.835232% |
| B | 5268 | 37 | 0.702354% |
| C | 5268 | 11 | 0.208808% |
| D | 5268 | 116 | 2.201974% |
Noise dominated data is calculated using 1-second bins in cleaned event files. If a bin has >2000 counts, and if more than 50% of those come from <1% of pixels, then it is considered to be noise-dominated and hence unusable.
| Quadrant | # 1 sec bins | Bins with >0 counts | Bins with >2000 counts | High rate bins dominated by noise | Noise dominated (total time) | Noise dominated (detector-on time) | Marked lightcurve |
|---|---|---|---|---|---|---|---|
| A | 9274 | 5270 | 24 | 24 | 0.26% | 0.46% | 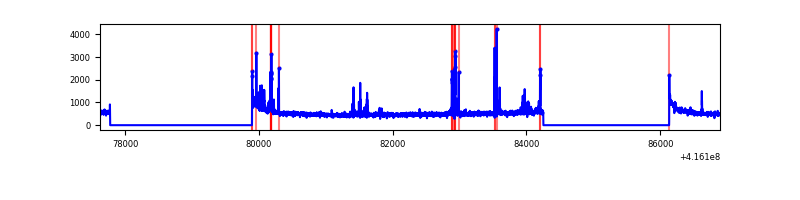 |
| B | 9274 | 5270 | 24 | 24 | 0.26% | 0.46% | 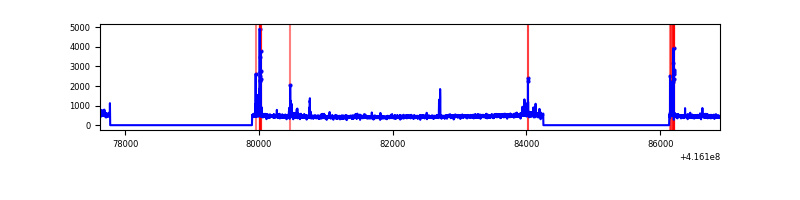 |
| C | 9274 | 5270 | 5 | 5 | 0.05% | 0.09% | 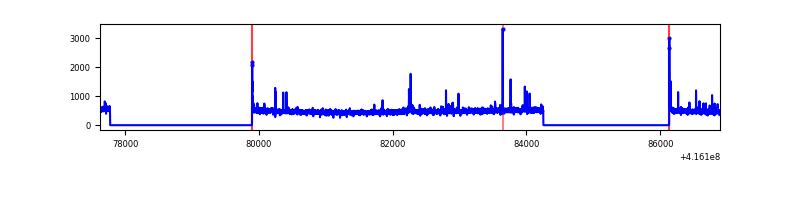 |
| D | 9274 | 5270 | 129 | 129 | 1.39% | 2.45% | 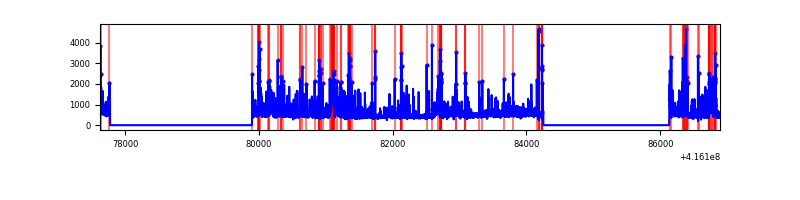 |
Top three noisy pixels from each quadrant. If the there are fewer than three noisy pixels in the level2.evt file, extra rows are filled as -1
| Pixel properties | Quadrant properties | ||||||
|---|---|---|---|---|---|---|---|
| Quadrant | DetID | PixID | Counts | Sigma | Mean | Median | Sigma |
| A | 10 | 83 | 456337 | 3803.15 | 585 | 575 | 119.8 |
| A | 13 | 248 | 166152 | 1381.67 | 585 | 575 | 119.8 |
| A | 13 | 254 | 8393 | 65.24 | 585 | 575 | 119.8 |
| B | 5 | 255 | 111228 | 983.48 | 584 | 569 | 112.5 |
| B | 0 | 245 | 56483 | 496.93 | 584 | 569 | 112.5 |
| B | 0 | 230 | 30552 | 266.47 | 584 | 569 | 112.5 |
| C | 15 | 214 | 224579 | 1656.53 | 577 | 580 | 135.2 |
| C | 14 | 254 | 63618 | 466.18 | 577 | 580 | 135.2 |
| C | 0 | 10 | 23243 | 167.6 | 577 | 580 | 135.2 |
| D | 12 | 227 | 911347 | 6620.26 | 565 | 549 | 137.6 |
| D | 1 | 47 | 93598 | 676.34 | 565 | 549 | 137.6 |
| D | 2 | 250 | 87559 | 632.44 | 565 | 549 | 137.6 |
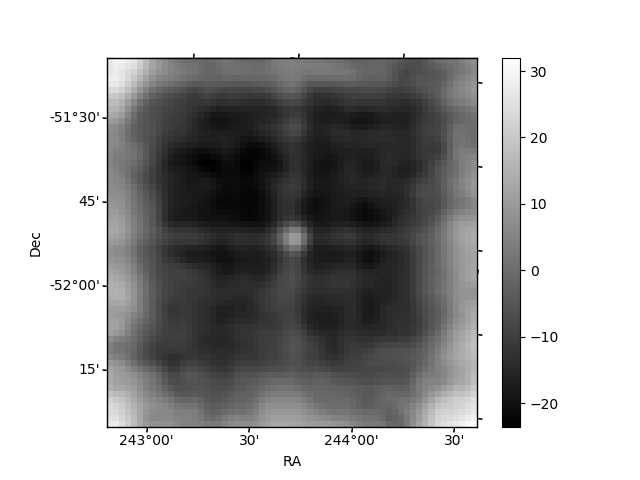
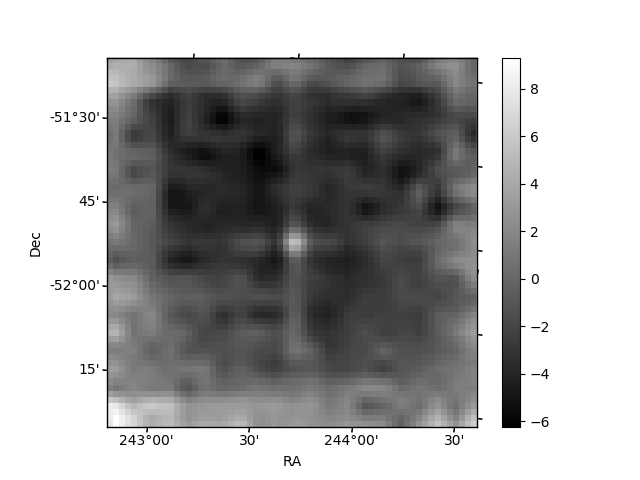
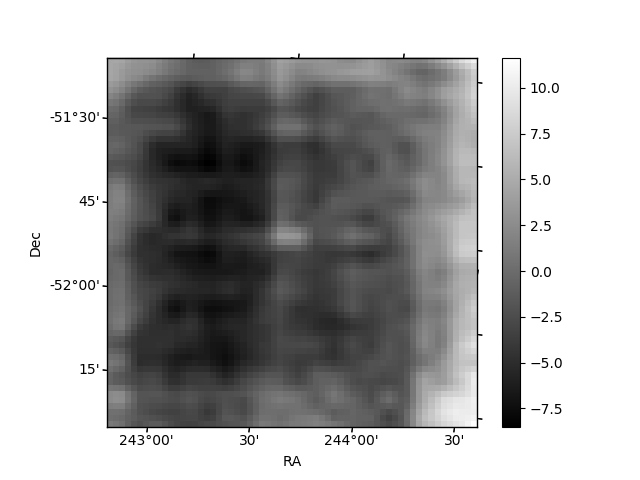
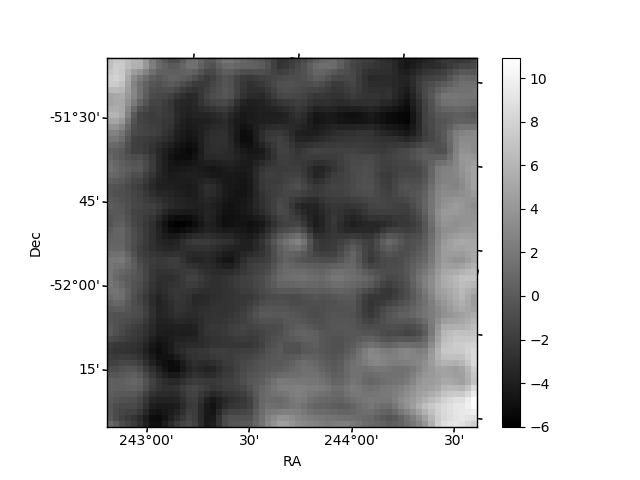
Histogram calculated using DETX and DETY for each event in the final _common_clean file
| Quadrant A | 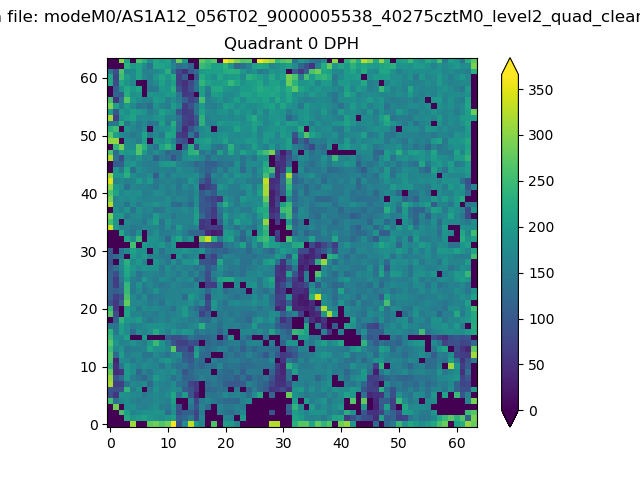 |
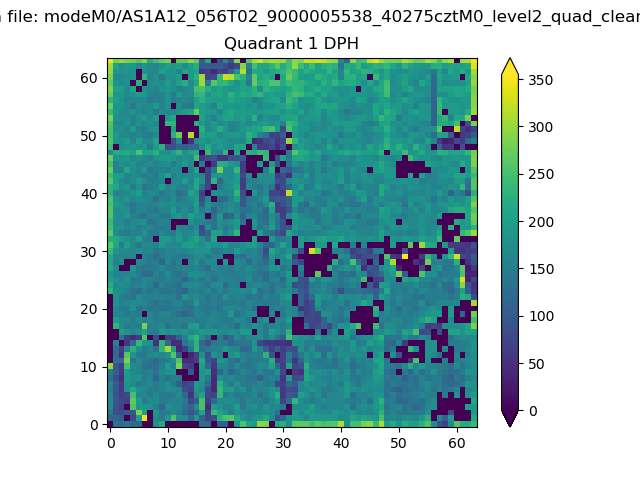 |
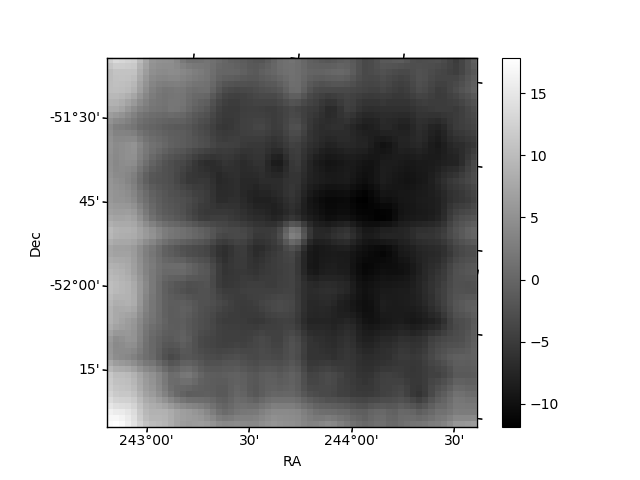
Quadrant B |
|---|---|---|---|
| Quadrant D | 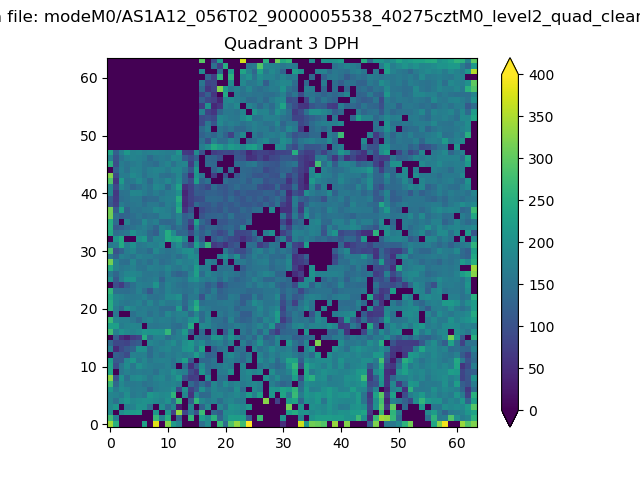 |
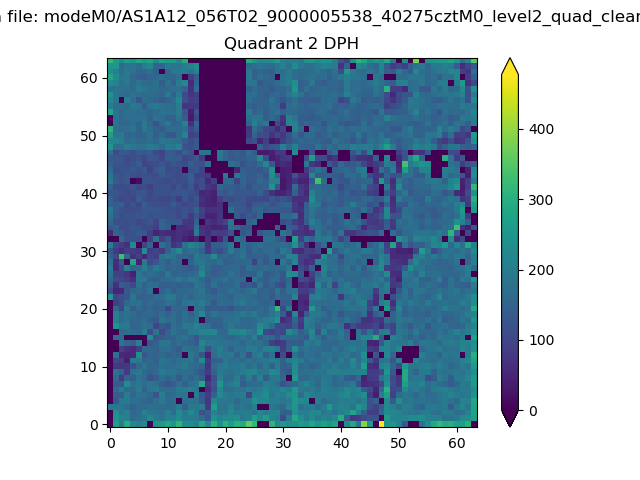 |
Quadrant C |
| Plot type | Count rate plots | Images |
|---|---|---|
| Comparison with Poisson distribution Blue bars denote a histogram of data divided into 1 sec bins. Red curve is a Poisson curve with rate = median count rate of data. |
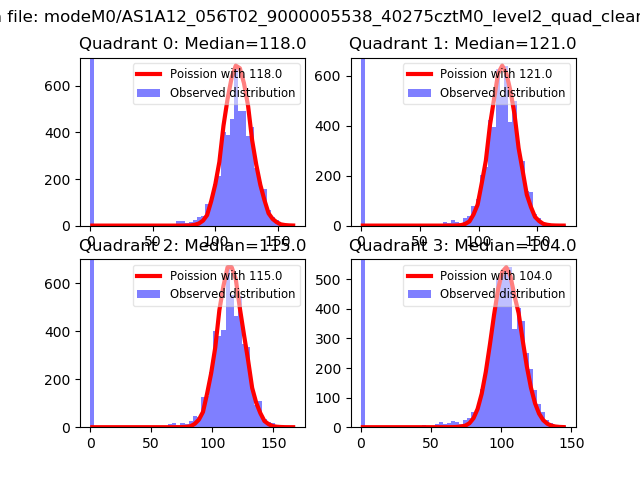 |
 |
| Quadrant-wise count rates Data is divided into 100 sec bins |
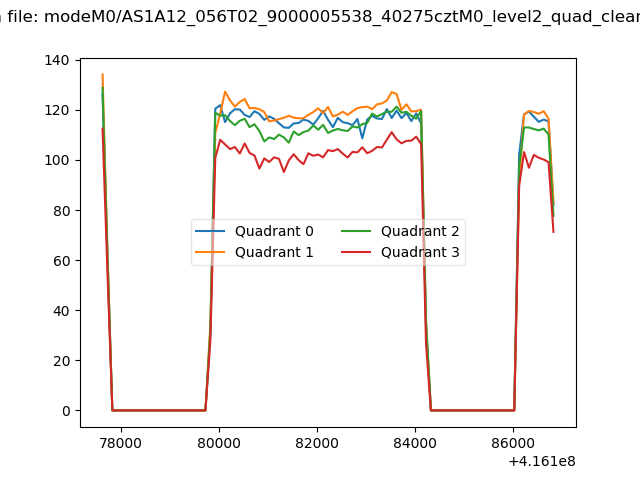 |
|
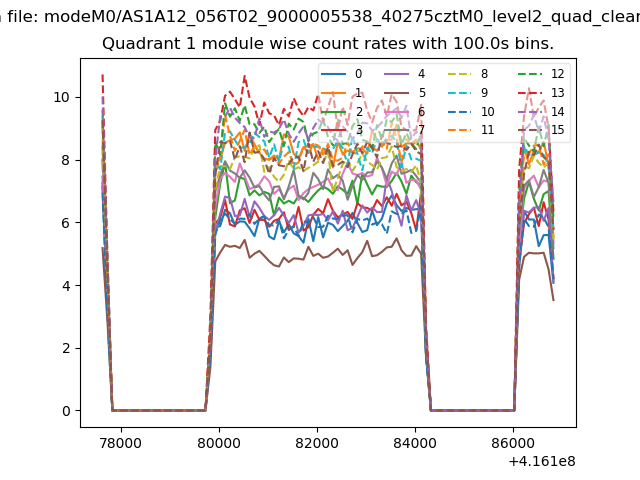
| Module-wise count rates for Quadrant A Data is divided into 100 sec bins |
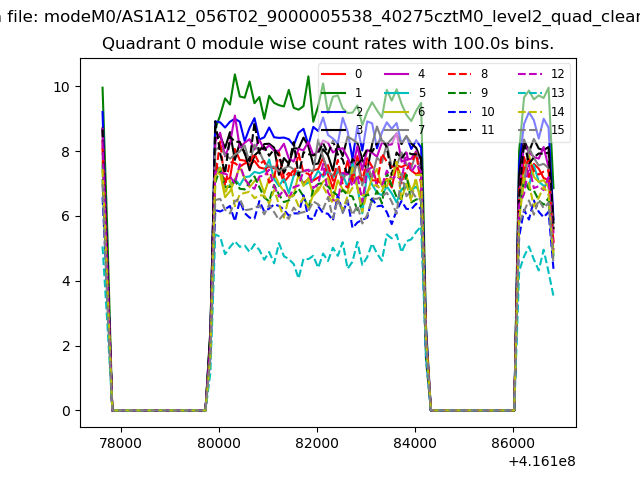 |
 |
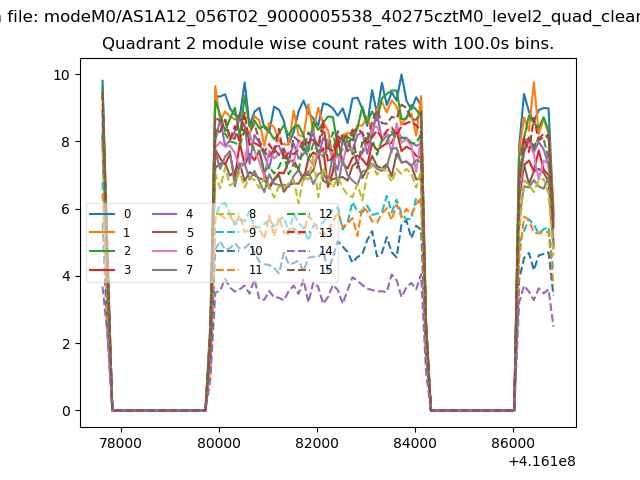
| Module-wise count rates for Quadrant B Data is divided into 100 sec bins |
 |
 |
| Module-wise count rates for Quadrant C Data is divided into 100 sec bins |
 |
 |
| Module-wise count rates for Quadrant D Data is divided into 100 sec bins |
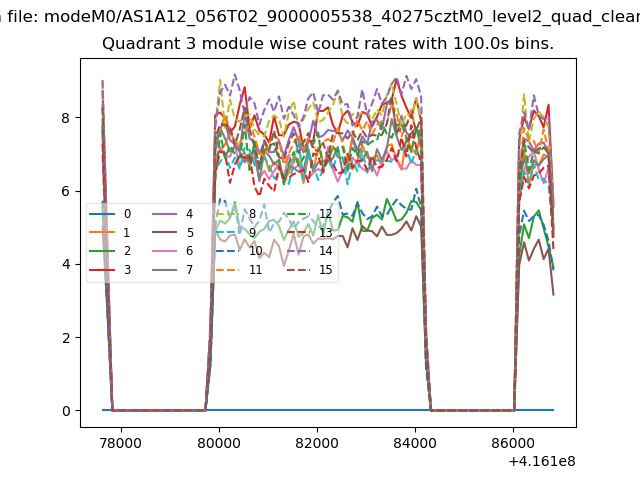 |
 |
| Parameter | Plot |
|---|---|
| CZT HV Monitor | 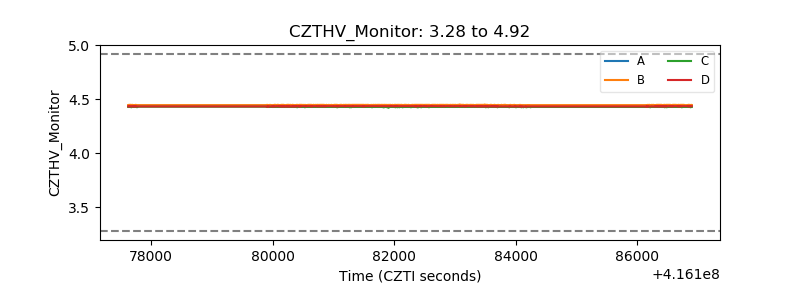 |
| D_VDD | 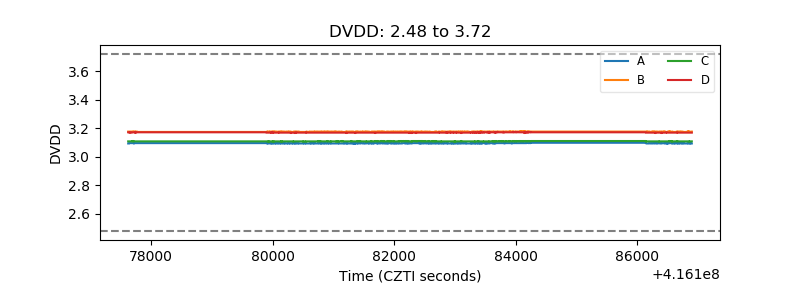 |
| Temperature 1 | 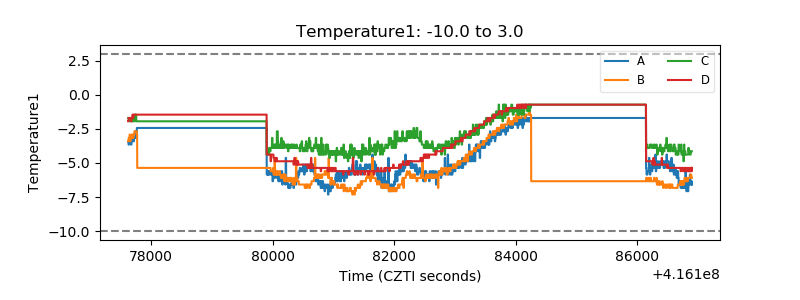 |
| Veto HV Monitor | 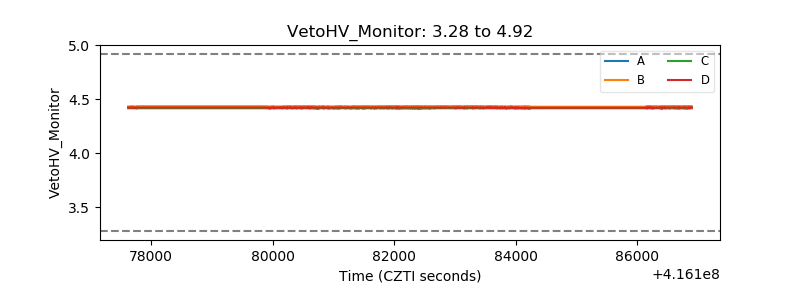 |
| Veto LLD | 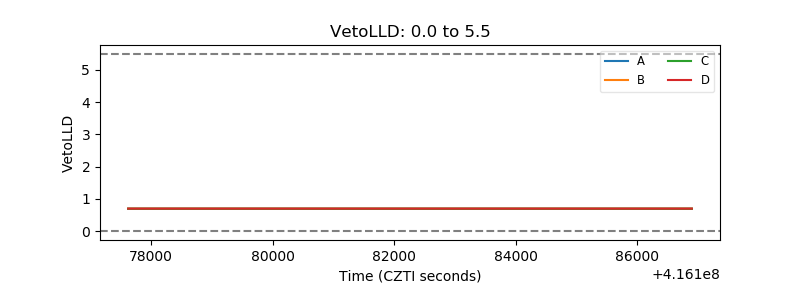 |
| Alpha Counter | 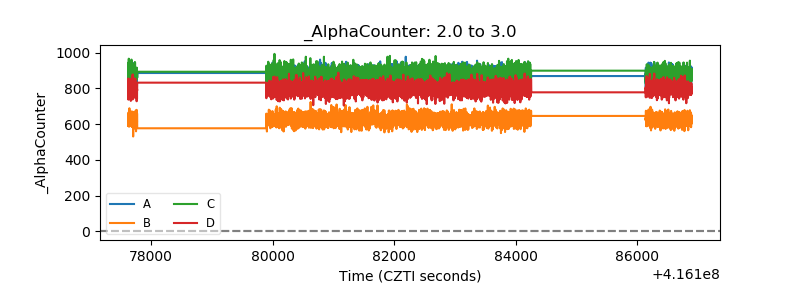 |
| _CPM_Rate | 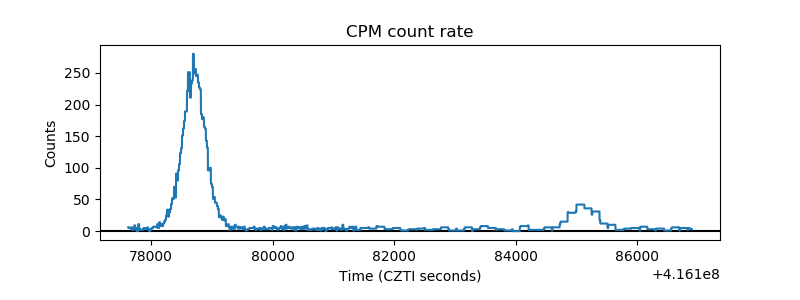 |
| CZT Counter | 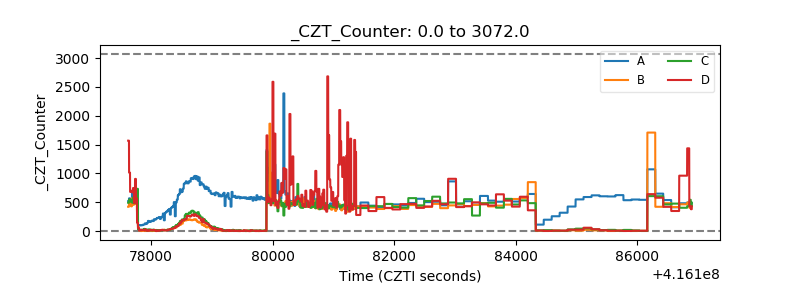 |
| +2.5 Volts monitor | 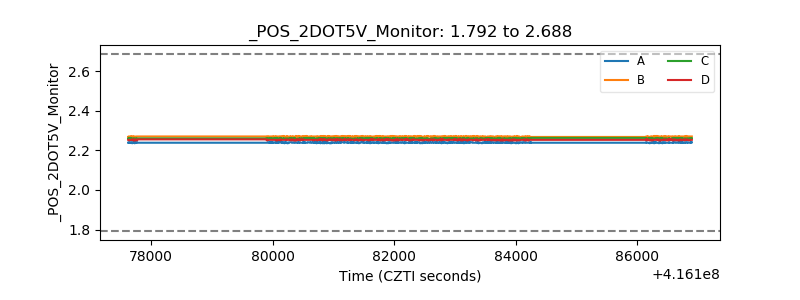 |
| +5 Volts monitor | 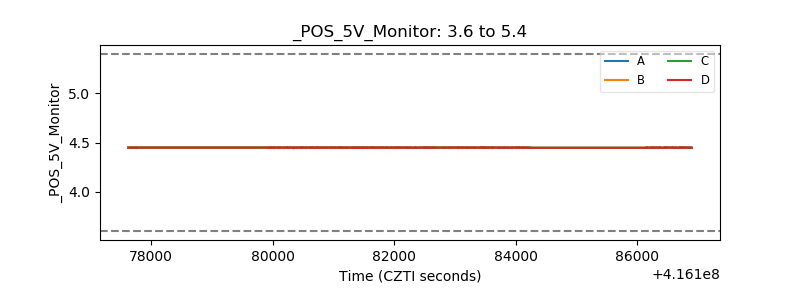 |
| _ROLL_ROT | 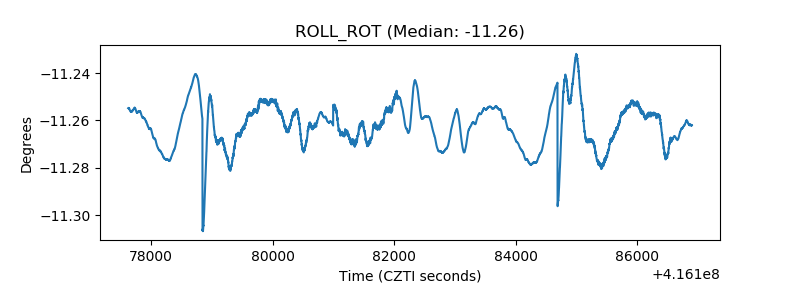 |
| _Roll_DEC | 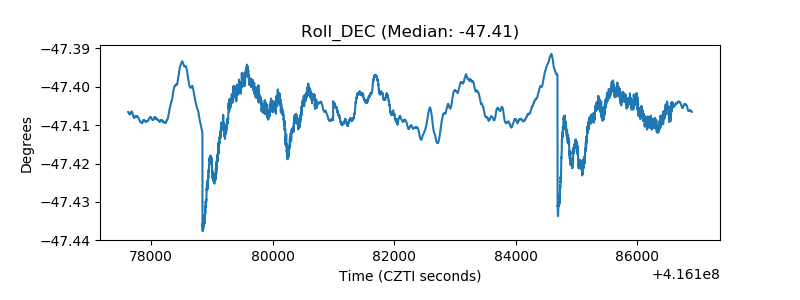 |
| _Roll_RA | 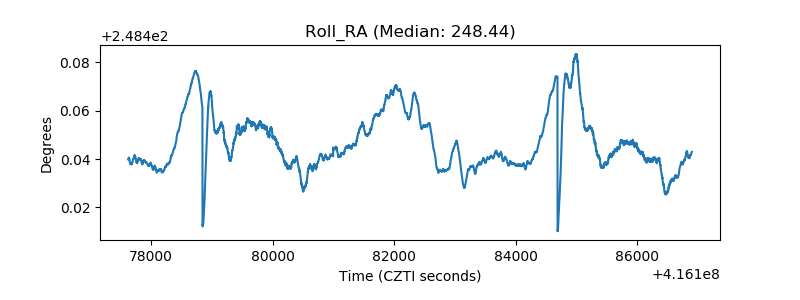 |
| Veto Counter | 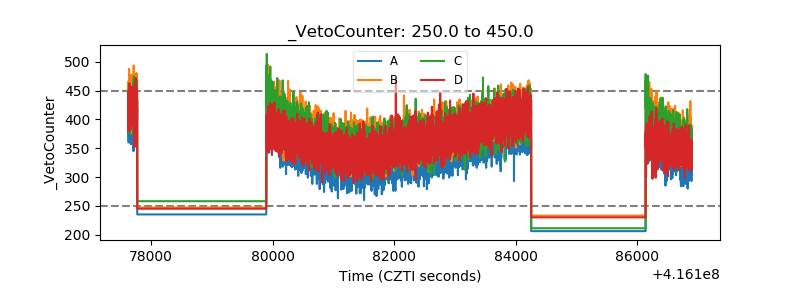 |