| Param | Original file | Final file |
|---|---|---|
| Filename | modeM0/AS1A12_056T02_9000005538_40276cztM0_level2.fits | modeM0/AS1A12_056T02_9000005538_40276cztM0_level2_quad_clean.evt |
| Size (bytes) | 366,128,640 | 95,016,960 |
| Size | 349.2 MB | 90.6 MB |
| Events in quadrant A | 3,124,508 | 645,870 |
| Events in quadrant B | 2,633,625 | 657,416 |
| Events in quadrant C | 2,826,255 | 630,773 |
| Events in quadrant D | 4,528,056 | 547,364 |
| Mode M0 | |||
|---|---|---|---|
| Quadrant | BADHDUFLAG | Total packets | Discarded packets |
| A | 0 | 12791 | 3 |
| B | 0 | 11779 | 2 |
| C | 0 | 11847 | 2 |
| D | 0 | 17367 | 2 |
| Mode M9 | |||
|---|---|---|---|
| Quadrant | BADHDUFLAG | Total packets | Discarded packets |
| A | 0 | 34 | 0 |
| B | 0 | 34 | 0 |
| C | 0 | 34 | 0 |
| D | 0 | 34 | 0 |
| Mode SS | |||
|---|---|---|---|
| Quadrant | BADHDUFLAG | Total packets | Discarded packets |
| A | 0 | 118 | 0 |
| B | 0 | 118 | 0 |
| C | 0 | 118 | 0 |
| D | 0 | 118 | 0 |
| Quadrant | Total seconds | Saturated seconds | Saturation percentage |
|---|---|---|---|
| A | 5656 | 38 | 0.671853% |
| B | 5656 | 37 | 0.654173% |
| C | 5656 | 22 | 0.388967% |
| D | 5656 | 406 | 7.178218% |
Noise dominated data is calculated using 1-second bins in cleaned event files. If a bin has >2000 counts, and if more than 50% of those come from <1% of pixels, then it is considered to be noise-dominated and hence unusable.
| Quadrant | # 1 sec bins | Bins with >0 counts | Bins with >2000 counts | High rate bins dominated by noise | Noise dominated (total time) | Noise dominated (detector-on time) | Marked lightcurve |
|---|---|---|---|---|---|---|---|
| A | 9090 | 5658 | 22 | 22 | 0.24% | 0.39% | 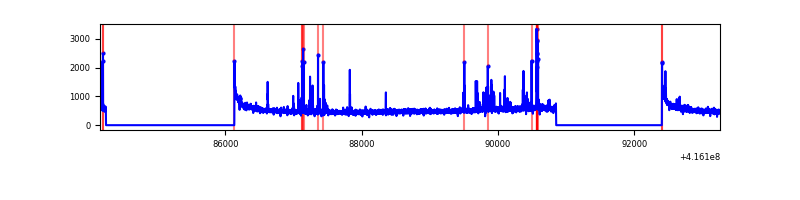 |
| B | 9090 | 5658 | 16 | 16 | 0.18% | 0.28% | 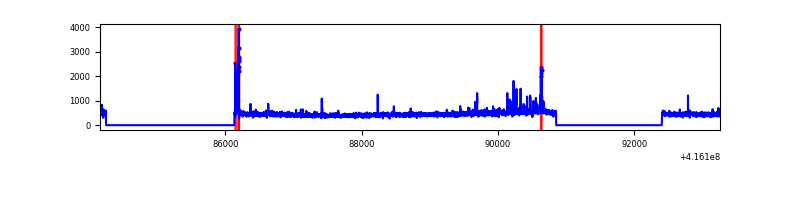 |
| C | 9090 | 5658 | 14 | 14 | 0.15% | 0.25% | 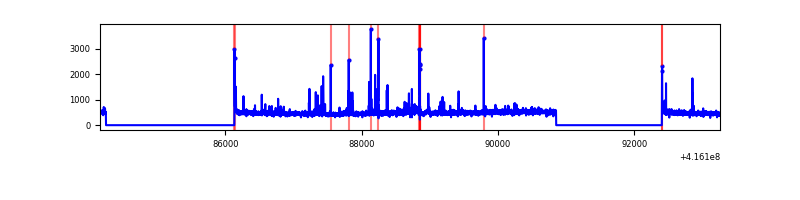 |
| D | 9090 | 5658 | 398 | 398 | 4.38% | 7.03% | 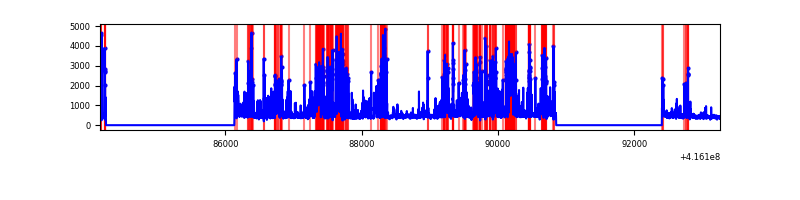 |
Top three noisy pixels from each quadrant. If the there are fewer than three noisy pixels in the level2.evt file, extra rows are filled as -1
| Pixel properties | Quadrant properties | ||||||
|---|---|---|---|---|---|---|---|
| Quadrant | DetID | PixID | Counts | Sigma | Mean | Median | Sigma |
| A | 10 | 83 | 496731 | 3860.04 | 627 | 615 | 128.5 |
| A | 13 | 248 | 179771 | 1393.93 | 627 | 615 | 128.5 |
| A | 13 | 6 | 10592 | 77.63 | 627 | 615 | 128.5 |
| B | 0 | 245 | 65908 | 542.88 | 624 | 606 | 120.3 |
| B | 15 | 85 | 31615 | 257.79 | 624 | 606 | 120.3 |
| B | 5 | 255 | 30714 | 250.3 | 624 | 606 | 120.3 |
| C | 15 | 214 | 240470 | 1648.98 | 619 | 623 | 145.5 |
| C | 14 | 254 | 142979 | 978.71 | 619 | 623 | 145.5 |
| C | 0 | 10 | 23516 | 157.39 | 619 | 623 | 145.5 |
| D | 12 | 227 | 1872500 | 12824.1 | 596 | 579 | 146.0 |
| D | 12 | 0 | 94885 | 646.07 | 596 | 579 | 146.0 |
| D | 1 | 47 | 89480 | 609.04 | 596 | 579 | 146.0 |
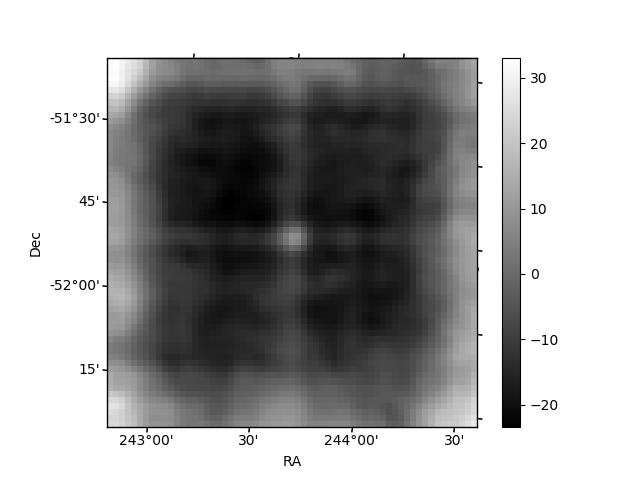
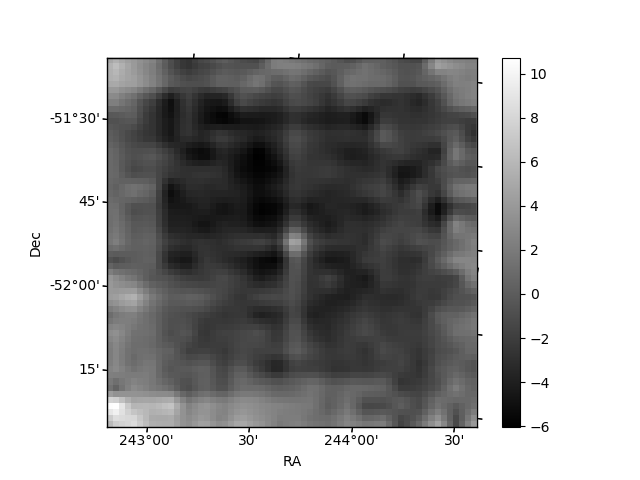
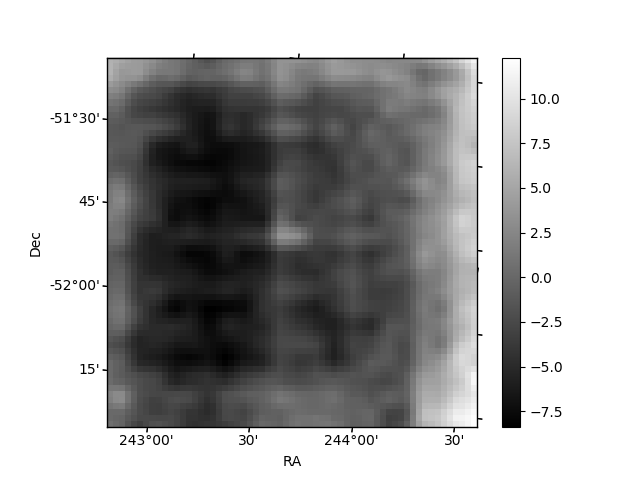
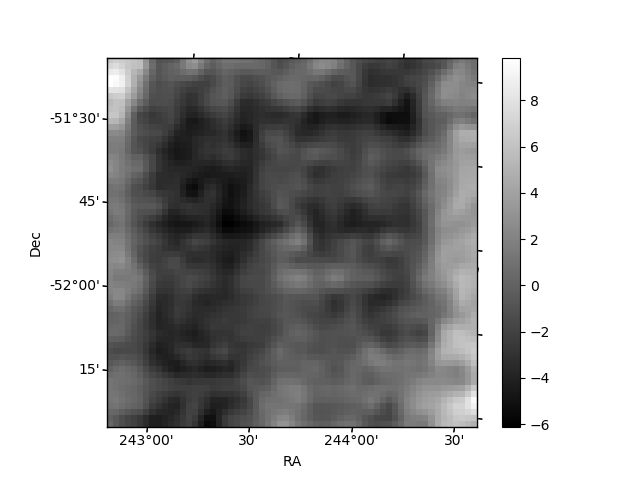
Histogram calculated using DETX and DETY for each event in the final _common_clean file
| Quadrant A | 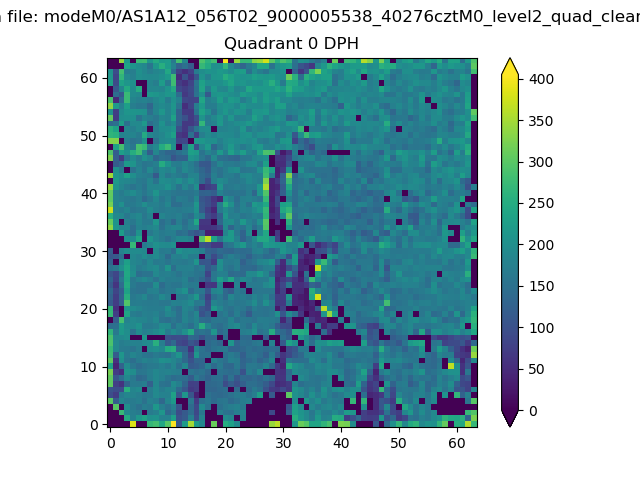 |
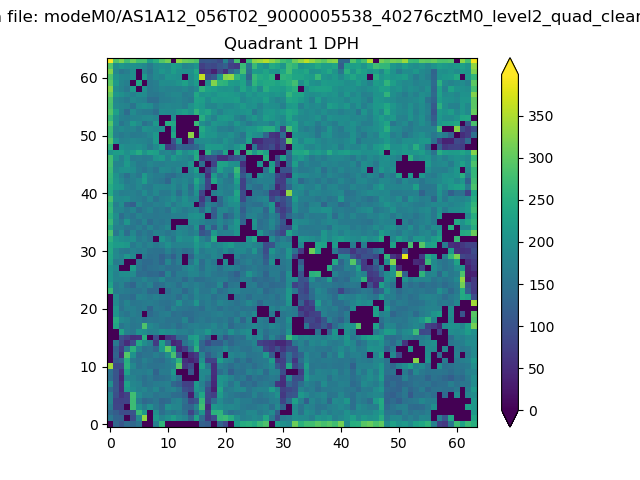 |
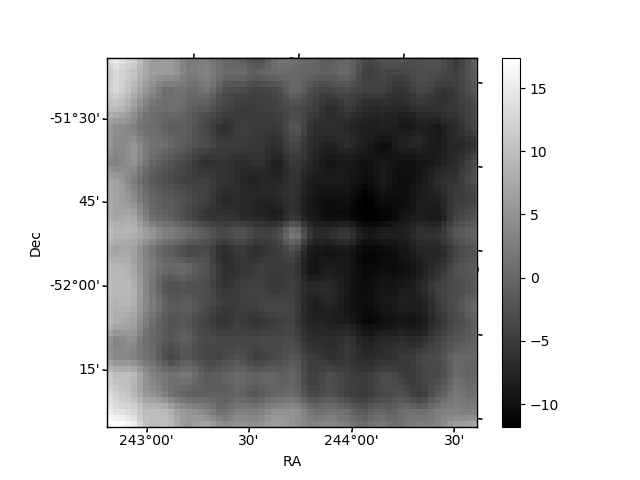
Quadrant B |
|---|---|---|---|
| Quadrant D | 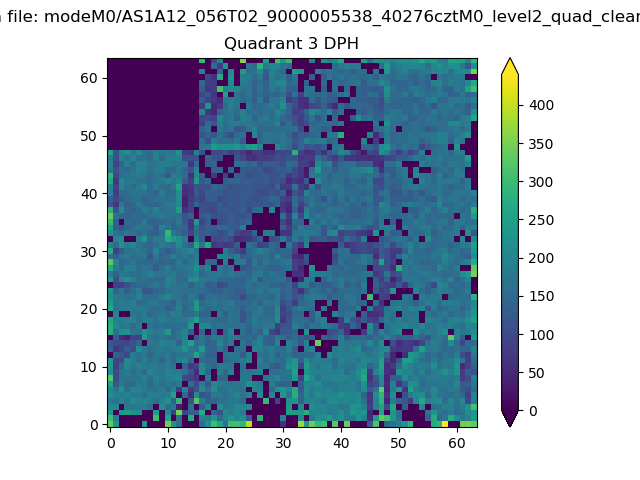 |
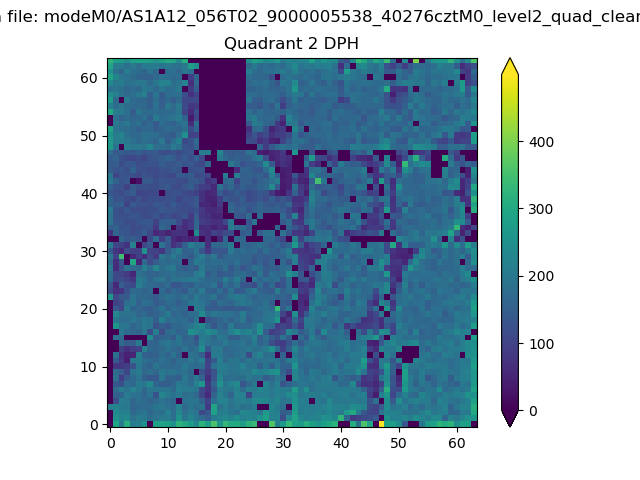 |
Quadrant C |
| Plot type | Count rate plots | Images |
|---|---|---|
| Comparison with Poisson distribution Blue bars denote a histogram of data divided into 1 sec bins. Red curve is a Poisson curve with rate = median count rate of data. |
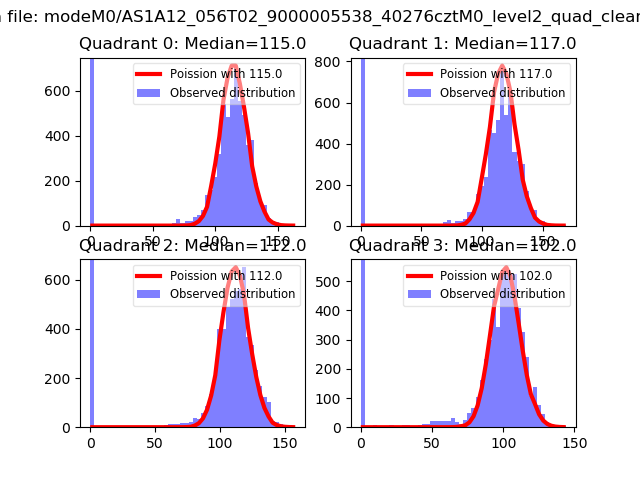 |
 |
| Quadrant-wise count rates Data is divided into 100 sec bins |
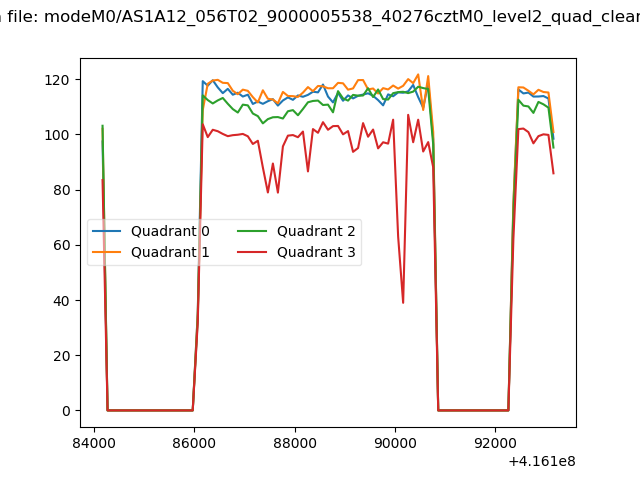 |
|
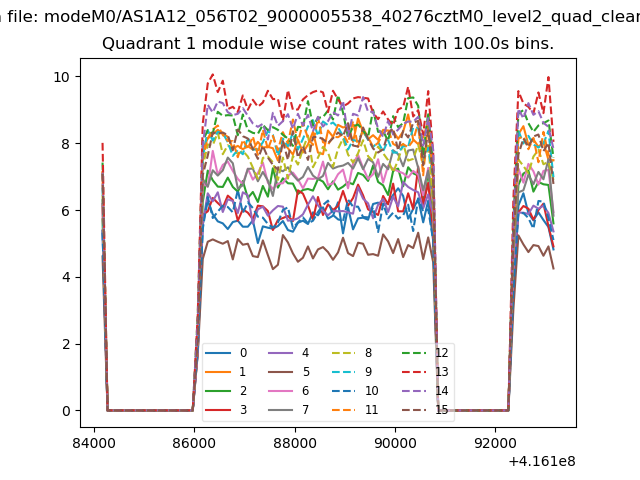
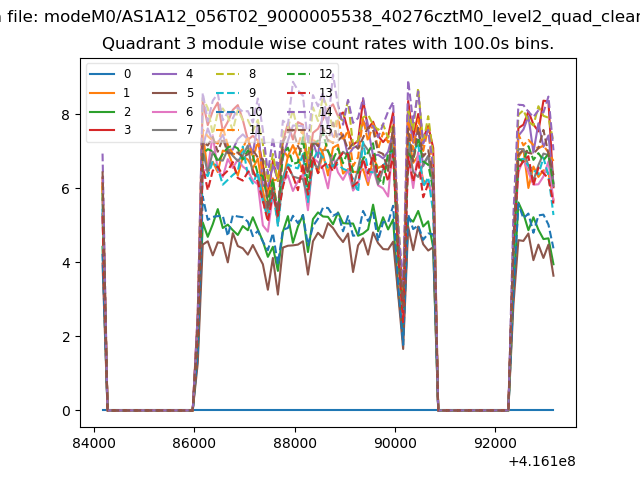
| Module-wise count rates for Quadrant A Data is divided into 100 sec bins |
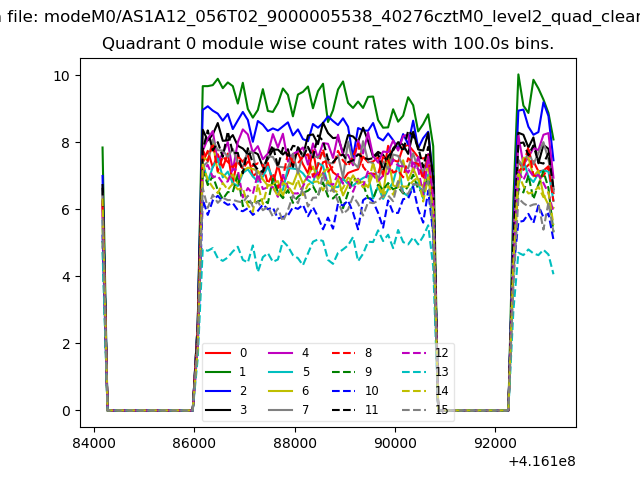 |
 |
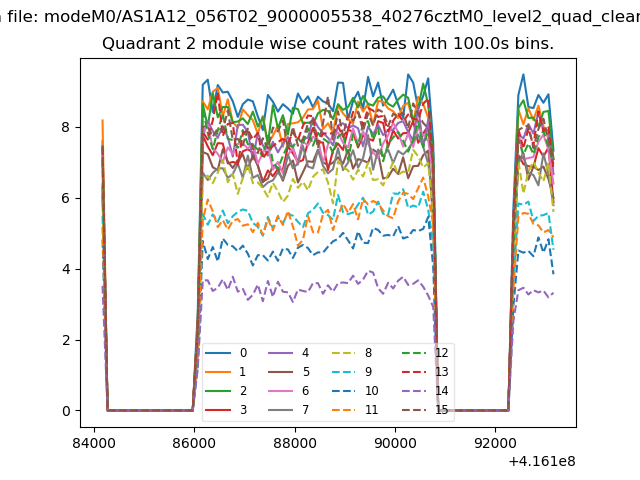
| Module-wise count rates for Quadrant B Data is divided into 100 sec bins |
 |
 |
| Module-wise count rates for Quadrant C Data is divided into 100 sec bins |
 |
 |
| Module-wise count rates for Quadrant D Data is divided into 100 sec bins |
 |
 |
| Parameter | Plot |
|---|---|
| CZT HV Monitor | 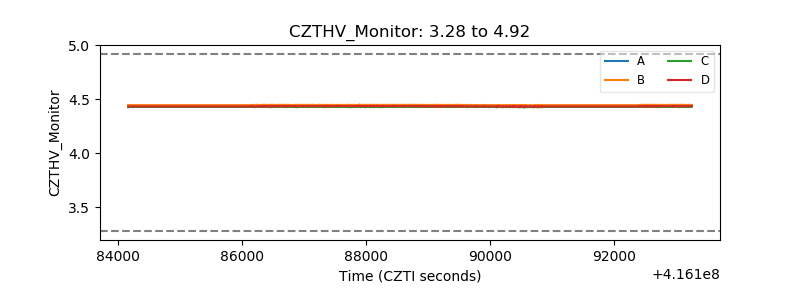 |
| D_VDD | 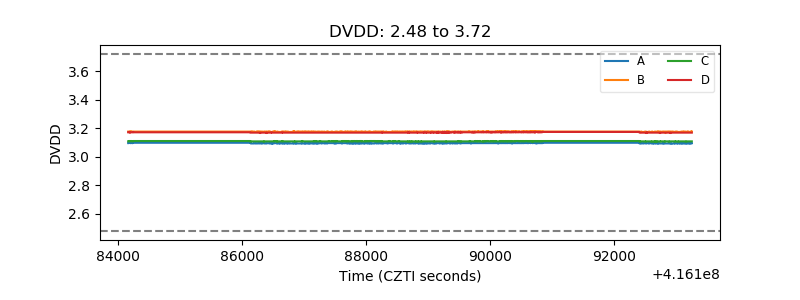 |
| Temperature 1 | 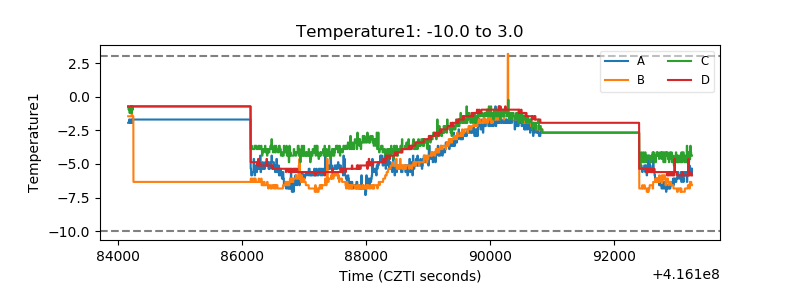 |
| Veto HV Monitor | 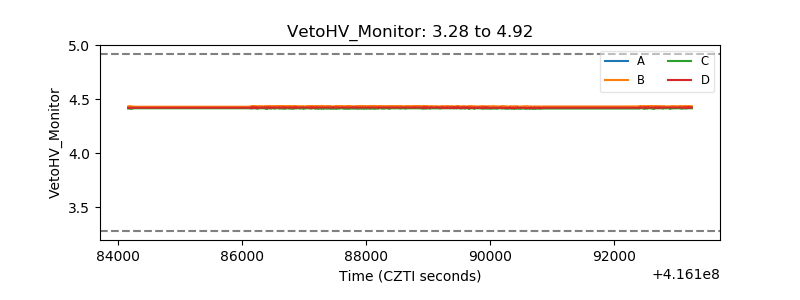 |
| Veto LLD | 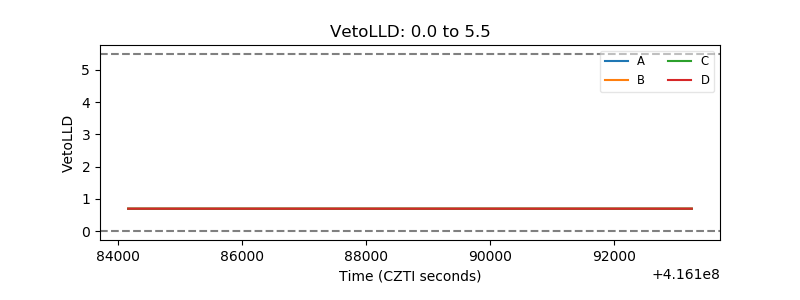 |
| Alpha Counter |  |
| _CPM_Rate | 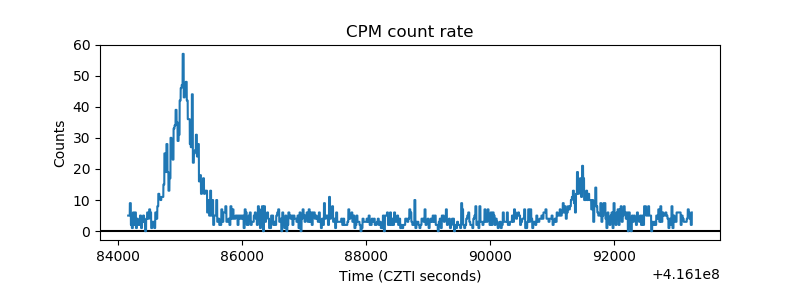 |
| CZT Counter | 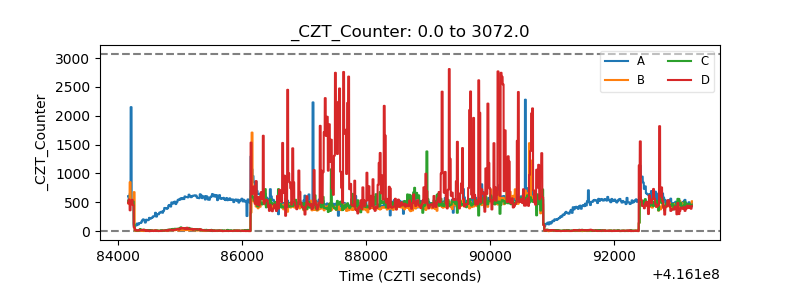 |
| +2.5 Volts monitor | 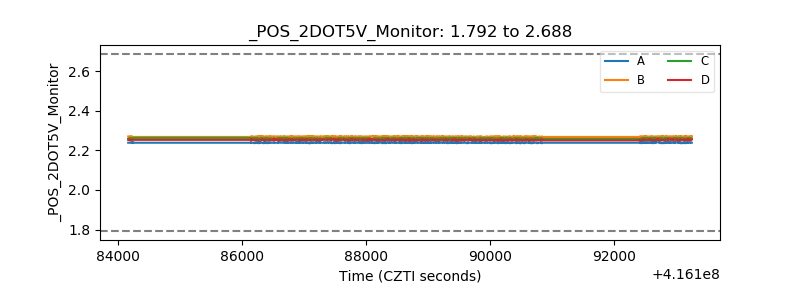 |
| +5 Volts monitor | 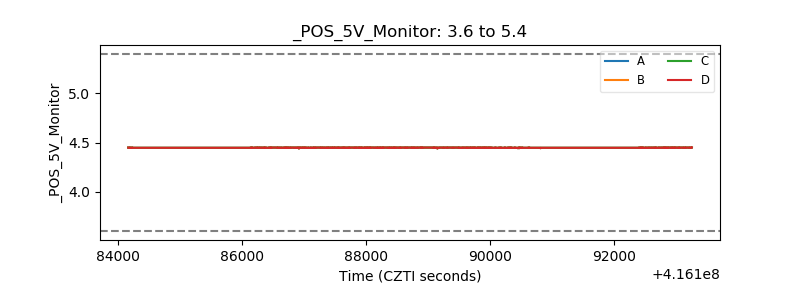 |
| _ROLL_ROT | 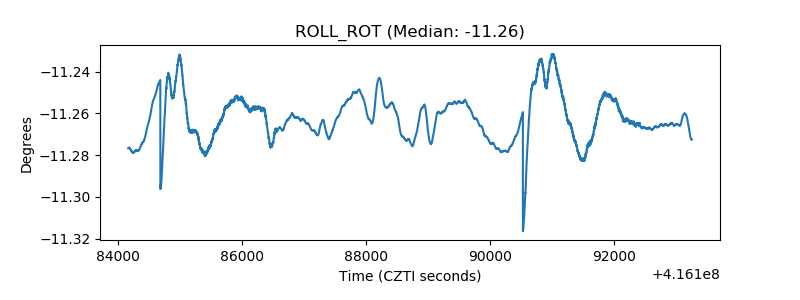 |
| _Roll_DEC | 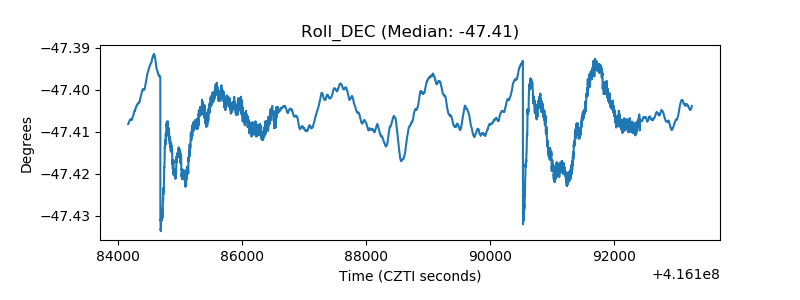 |
| _Roll_RA | 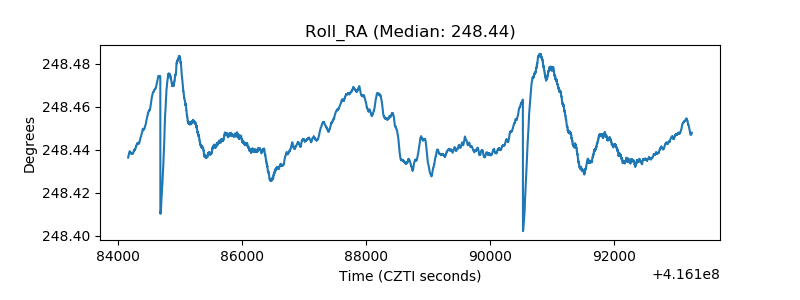 |
| Veto Counter | 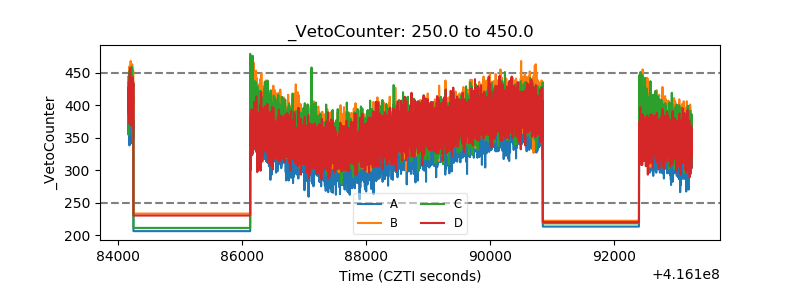 |