| Param | Original file | Final file |
|---|---|---|
| Filename | modeM0/AS1A12_056T02_9000005538_40277cztM0_level2.fits | modeM0/AS1A12_056T02_9000005538_40277cztM0_level2_quad_clean.evt |
| Size (bytes) | 374,564,160 | 100,477,440 |
| Size | 357.2 MB | 95.8 MB |
| Events in quadrant A | 3,276,244 | 680,946 |
| Events in quadrant B | 3,024,446 | 686,743 |
| Events in quadrant C | 2,976,681 | 668,338 |
| Events in quadrant D | 4,116,234 | 583,307 |
| Mode M0 | |||
|---|---|---|---|
| Quadrant | BADHDUFLAG | Total packets | Discarded packets |
| A | 0 | 13452 | 3 |
| B | 0 | 13178 | 2 |
| C | 0 | 12505 | 2 |
| D | 0 | 16517 | 2 |
| Mode M9 | |||
|---|---|---|---|
| Quadrant | BADHDUFLAG | Total packets | Discarded packets |
| A | 0 | 28 | 0 |
| B | 0 | 28 | 0 |
| C | 0 | 28 | 0 |
| D | 0 | 28 | 0 |
| Mode SS | |||
|---|---|---|---|
| Quadrant | BADHDUFLAG | Total packets | Discarded packets |
| A | 0 | 126 | 0 |
| B | 0 | 126 | 0 |
| C | 0 | 126 | 0 |
| D | 0 | 126 | 0 |
| Quadrant | Total seconds | Saturated seconds | Saturation percentage |
|---|---|---|---|
| A | 6054 | 24 | 0.396432% |
| B | 6054 | 124 | 2.048233% |
| C | 6054 | 19 | 0.313842% |
| D | 6054 | 375 | 6.194252% |
Noise dominated data is calculated using 1-second bins in cleaned event files. If a bin has >2000 counts, and if more than 50% of those come from <1% of pixels, then it is considered to be noise-dominated and hence unusable.
| Quadrant | # 1 sec bins | Bins with >0 counts | Bins with >2000 counts | High rate bins dominated by noise | Noise dominated (total time) | Noise dominated (detector-on time) | Marked lightcurve |
|---|---|---|---|---|---|---|---|
| A | 8947 | 6056 | 12 | 12 | 0.13% | 0.20% | 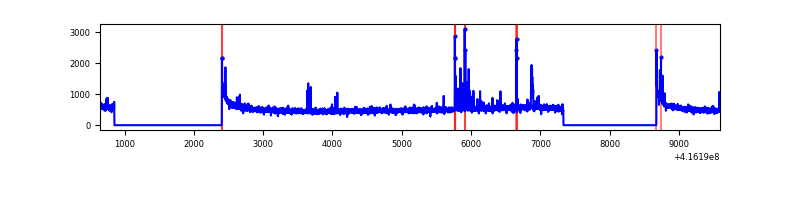 |
| B | 8947 | 6056 | 78 | 78 | 0.87% | 1.29% | 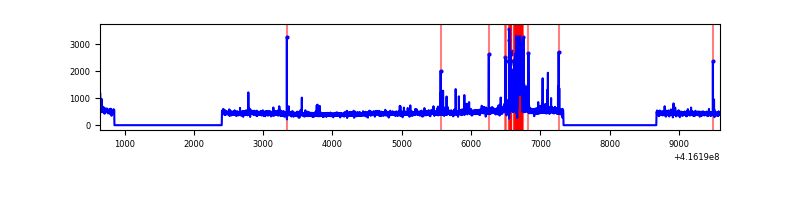 |
| C | 8947 | 6056 | 12 | 12 | 0.13% | 0.20% | 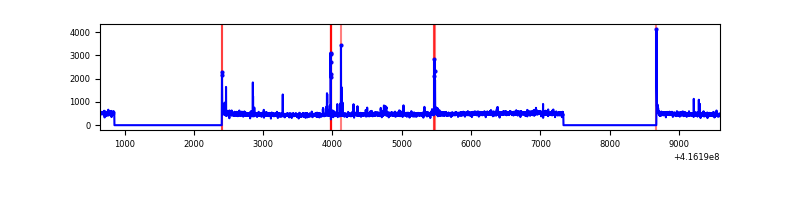 |
| D | 8947 | 6056 | 319 | 319 | 3.57% | 5.27% | 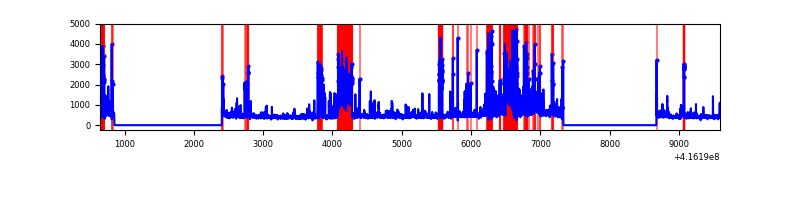 |
Top three noisy pixels from each quadrant. If the there are fewer than three noisy pixels in the level2.evt file, extra rows are filled as -1
| Pixel properties | Quadrant properties | ||||||
|---|---|---|---|---|---|---|---|
| Quadrant | DetID | PixID | Counts | Sigma | Mean | Median | Sigma |
| A | 10 | 83 | 519535 | 3773.46 | 674 | 660 | 137.5 |
| A | 13 | 248 | 88329 | 637.56 | 674 | 660 | 137.5 |
| A | 2 | 79 | 30889 | 219.84 | 674 | 660 | 137.5 |
| B | 5 | 255 | 332541 | 2581.49 | 667 | 648 | 128.6 |
| B | 0 | 245 | 24654 | 186.72 | 667 | 648 | 128.6 |
| B | 0 | 230 | 23636 | 178.8 | 667 | 648 | 128.6 |
| C | 15 | 214 | 257967 | 1660.29 | 663 | 667 | 155.0 |
| C | 14 | 254 | 101875 | 653.07 | 663 | 667 | 155.0 |
| C | 0 | 10 | 26794 | 168.59 | 663 | 667 | 155.0 |
| D | 12 | 227 | 803413 | 5080.39 | 643 | 624 | 158.0 |
| D | 2 | 250 | 372137 | 2351.09 | 643 | 624 | 158.0 |
| D | 2 | 249 | 211373 | 1333.71 | 643 | 624 | 158.0 |
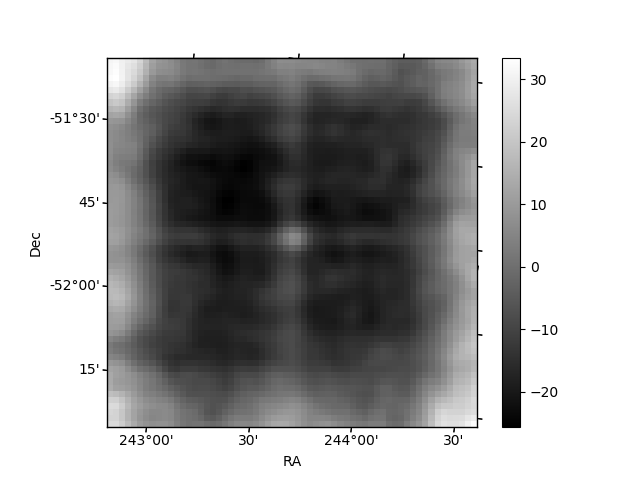
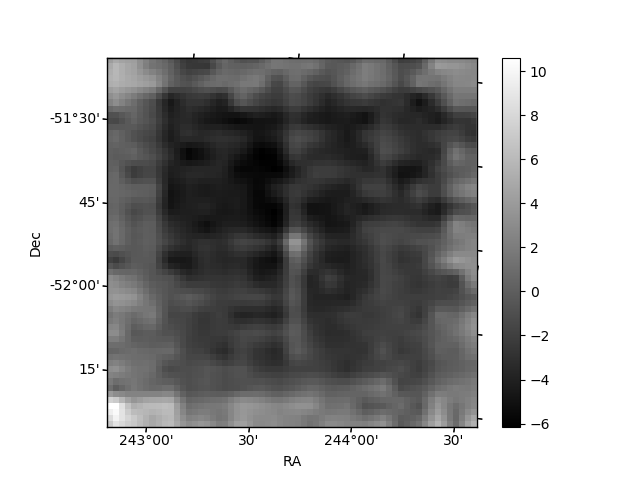
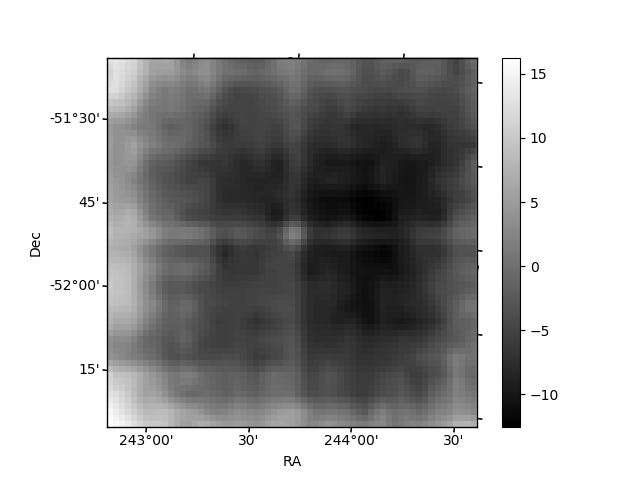
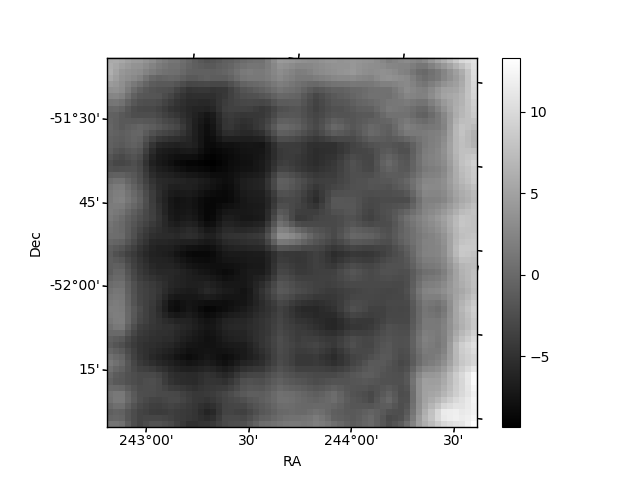
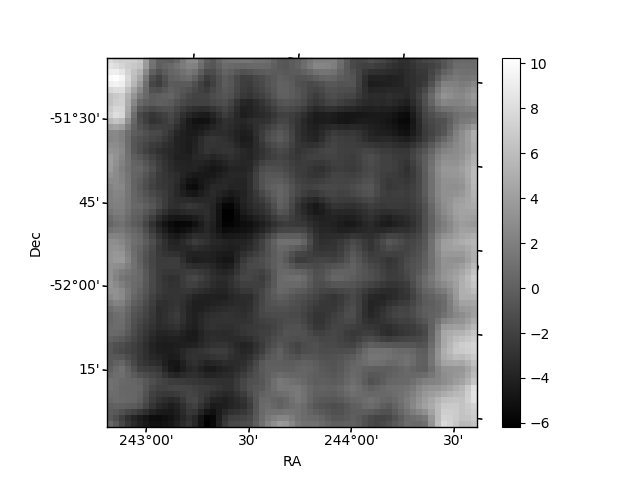
Histogram calculated using DETX and DETY for each event in the final _common_clean file
| Quadrant A | 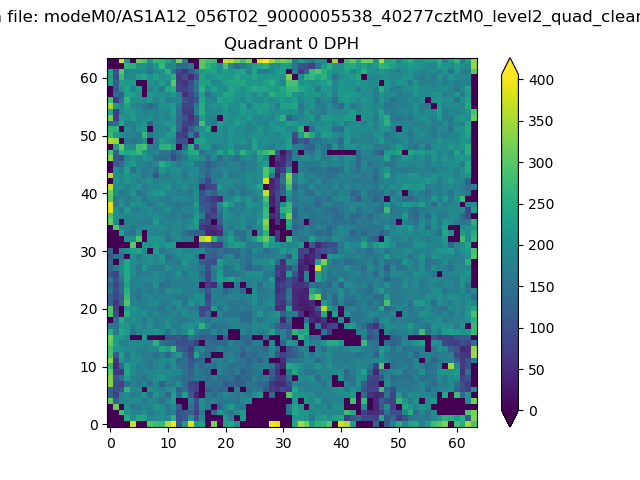 |
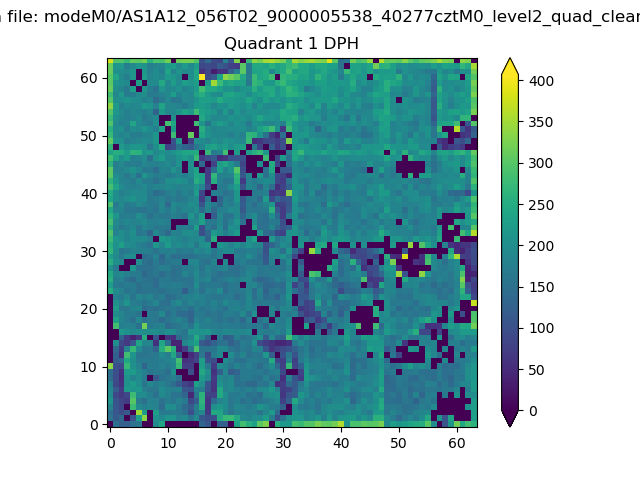 |
Quadrant B |
|---|---|---|---|
| Quadrant D | 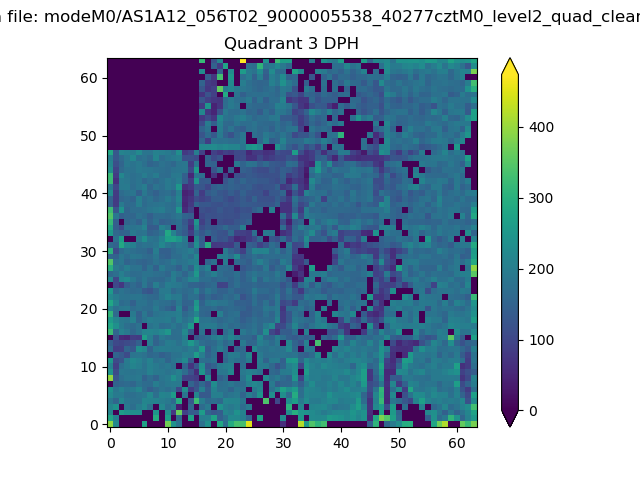 |
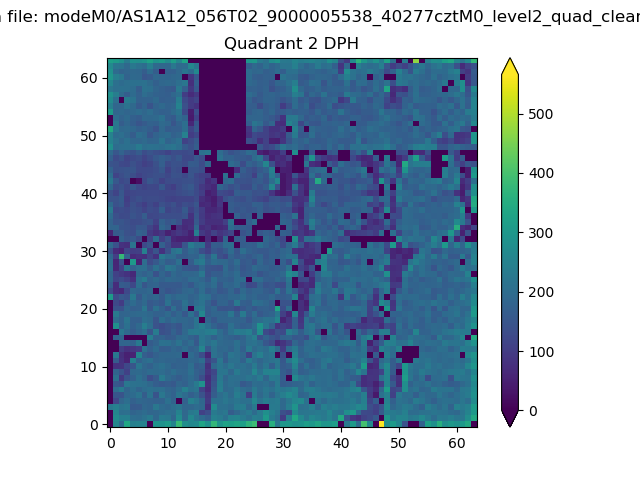 |
Quadrant C |
| Plot type | Count rate plots | Images |
|---|---|---|
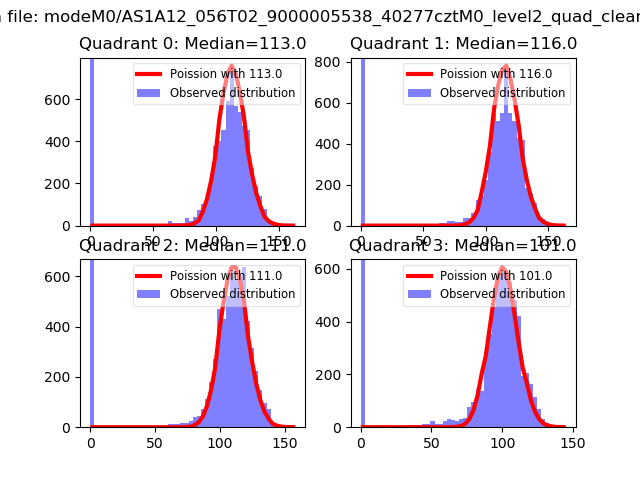
| Comparison with Poisson distribution Blue bars denote a histogram of data divided into 1 sec bins. Red curve is a Poisson curve with rate = median count rate of data. |
 |
 |
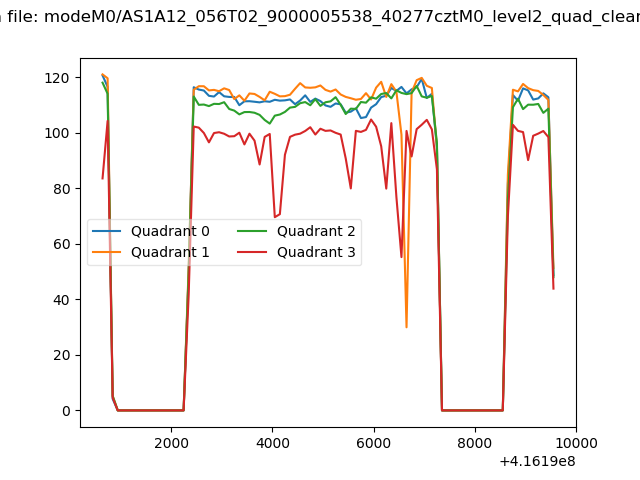
| Quadrant-wise count rates Data is divided into 100 sec bins |
 |
|
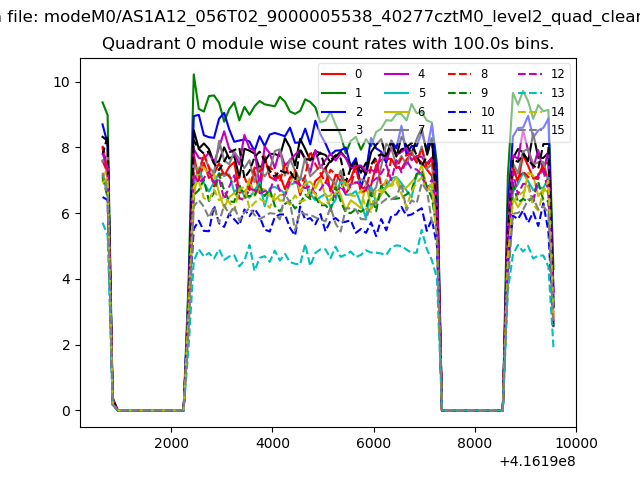
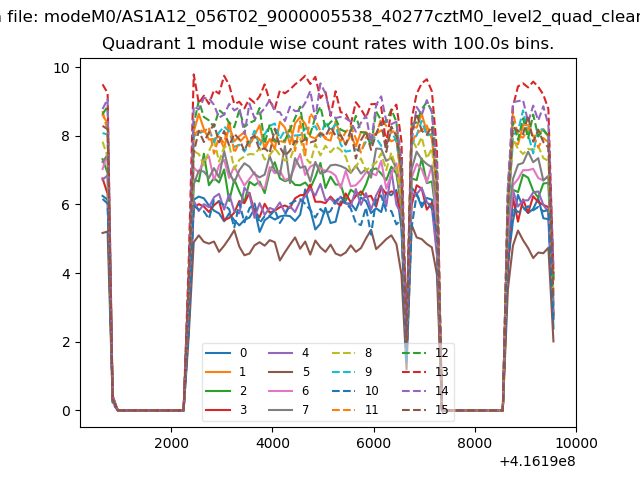
| Module-wise count rates for Quadrant A Data is divided into 100 sec bins |
 |
 |
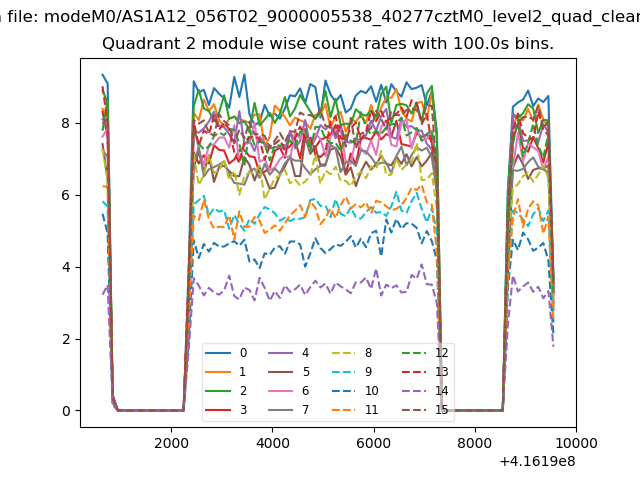
| Module-wise count rates for Quadrant B Data is divided into 100 sec bins |
 |
 |
| Module-wise count rates for Quadrant C Data is divided into 100 sec bins |
 |
 |
| Module-wise count rates for Quadrant D Data is divided into 100 sec bins |
 |
 |
| Parameter | Plot |
|---|---|
| CZT HV Monitor | 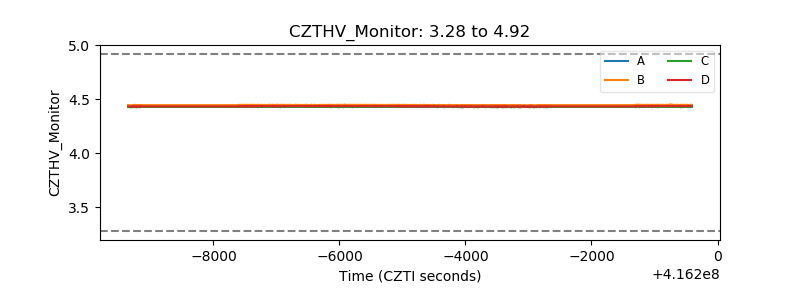 |
| D_VDD | 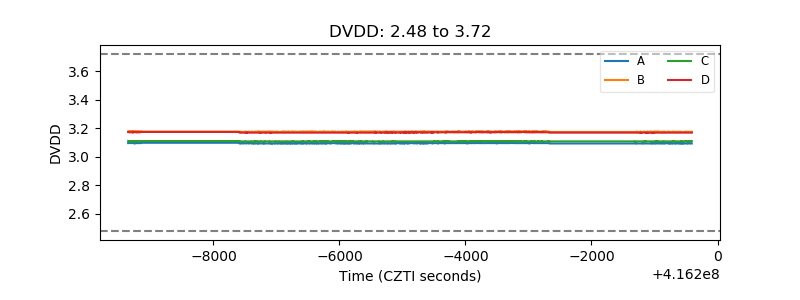 |
| Temperature 1 | 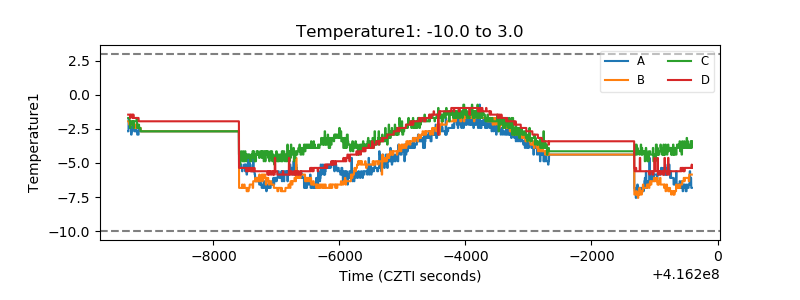 |
| Veto HV Monitor | 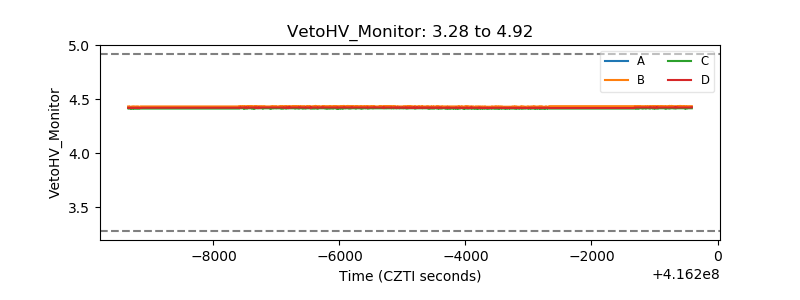 |
| Veto LLD | 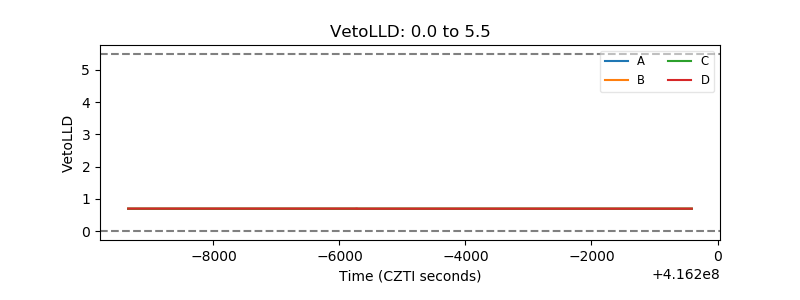 |
| Alpha Counter | 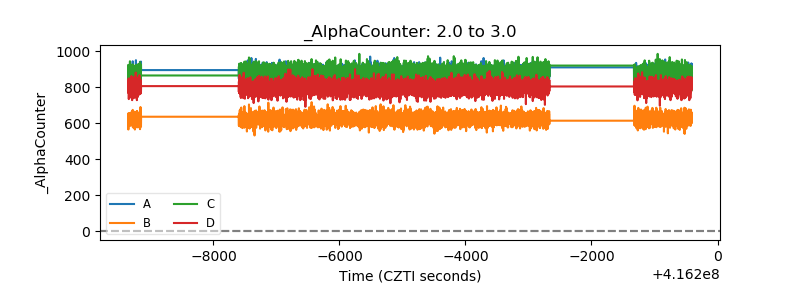 |
| _CPM_Rate | 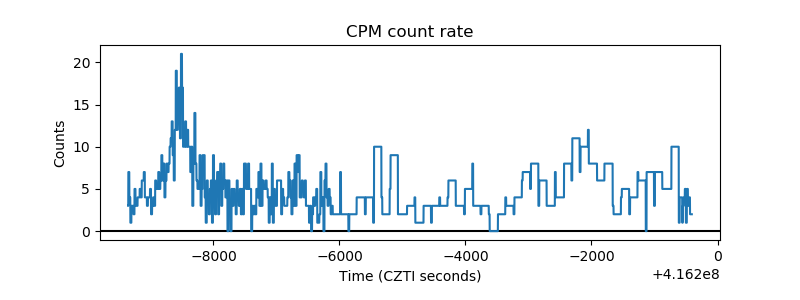 |
| CZT Counter | 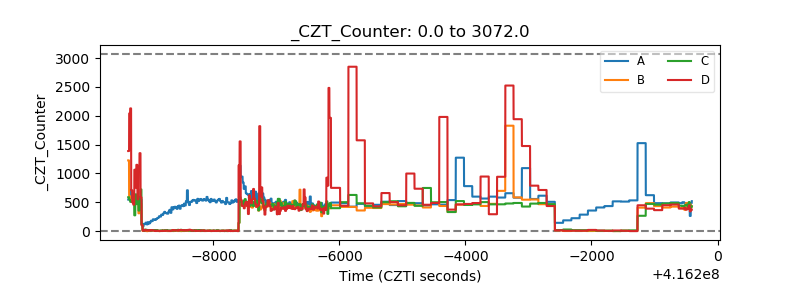 |
| +2.5 Volts monitor | 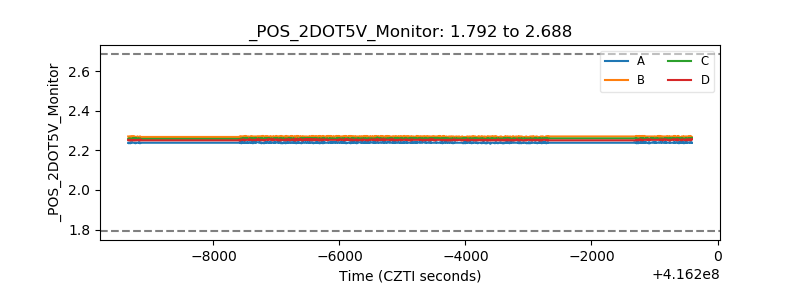 |
| +5 Volts monitor | 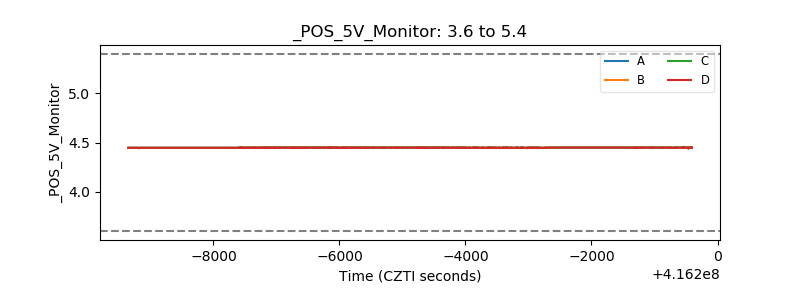 |
| _ROLL_ROT | 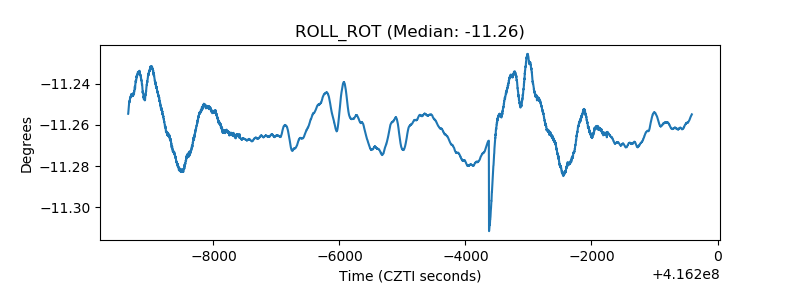 |
| _Roll_DEC | 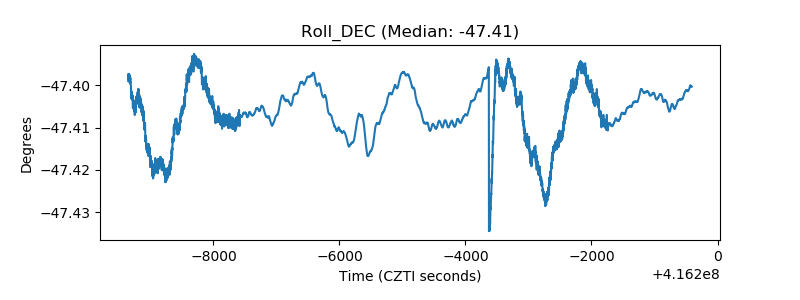 |
| _Roll_RA | 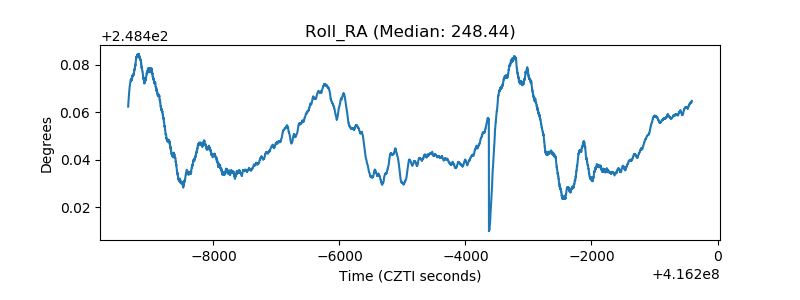 |
| Veto Counter | 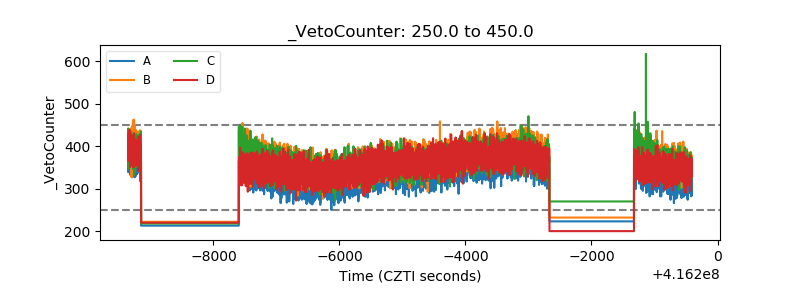 |