| Param | Original file | Final file |
|---|---|---|
| Filename | modeM0/AS1A12_056T02_9000005538_40282cztM0_level2.fits | modeM0/AS1A12_056T02_9000005538_40282cztM0_level2_quad_clean.evt |
| Size (bytes) | 1,691,055,360 | 418,668,480 |
| Size | 1.6 GB | 399.3 MB |
| Events in quadrant A | 14,174,099 | 2,825,820 |
| Events in quadrant B | 12,208,249 | 2,910,353 |
| Events in quadrant C | 12,999,536 | 2,813,611 |
| Events in quadrant D | 21,249,332 | 2,377,337 |
| Mode M0 | |||
|---|---|---|---|
| Quadrant | BADHDUFLAG | Total packets | Discarded packets |
| A | 0 | 57142 | 7 |
| B | 0 | 53097 | 6 |
| C | 0 | 54110 | 6 |
| D | 0 | 80532 | 6 |
| Mode M9 | |||
|---|---|---|---|
| Quadrant | BADHDUFLAG | Total packets | Discarded packets |
| A | 0 | 87 | 0 |
| B | 0 | 87 | 0 |
| C | 0 | 87 | 0 |
| D | 0 | 87 | 0 |
| Mode SS | |||
|---|---|---|---|
| Quadrant | BADHDUFLAG | Total packets | Discarded packets |
| A | 0 | 520 | 0 |
| B | 0 | 520 | 0 |
| C | 0 | 520 | 0 |
| D | 0 | 520 | 0 |
| Quadrant | Total seconds | Saturated seconds | Saturation percentage |
|---|---|---|---|
| A | 25425 | 238 | 0.936087% |
| B | 25425 | 124 | 0.487709% |
| C | 25425 | 106 | 0.416912% |
| D | 25425 | 2460 | 9.675516% |
Noise dominated data is calculated using 1-second bins in cleaned event files. If a bin has >2000 counts, and if more than 50% of those come from <1% of pixels, then it is considered to be noise-dominated and hence unusable.
| Quadrant | # 1 sec bins | Bins with >0 counts | Bins with >2000 counts | High rate bins dominated by noise | Noise dominated (total time) | Noise dominated (detector-on time) | Marked lightcurve |
|---|---|---|---|---|---|---|---|
| A | 34085 | 25431 | 160 | 160 | 0.47% | 0.63% | 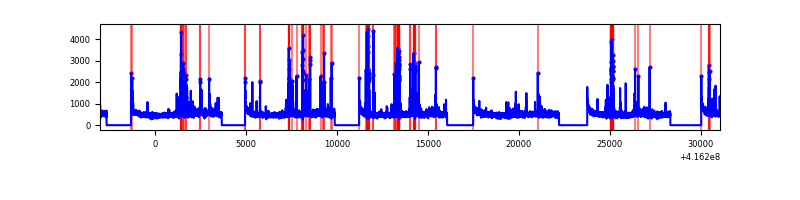 |
| B | 34085 | 25431 | 58 | 58 | 0.17% | 0.23% | 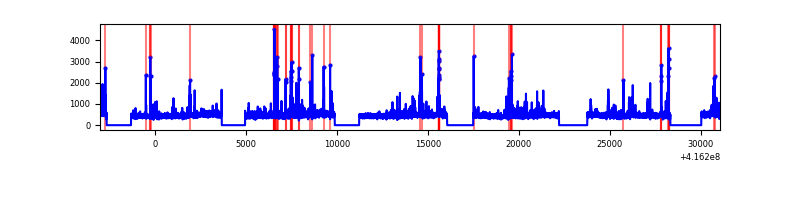 |
| C | 34085 | 25431 | 80 | 80 | 0.23% | 0.31% | 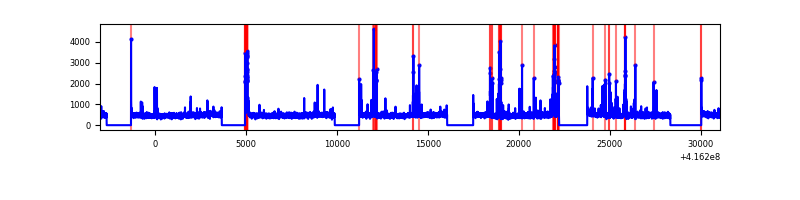 |
| D | 34085 | 25430 | 2146 | 2146 | 6.30% | 8.44% | 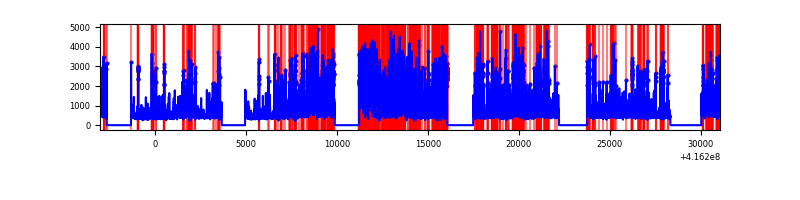 |
Top three noisy pixels from each quadrant. If the there are fewer than three noisy pixels in the level2.evt file, extra rows are filled as -1
| Pixel properties | Quadrant properties | ||||||
|---|---|---|---|---|---|---|---|
| Quadrant | DetID | PixID | Counts | Sigma | Mean | Median | Sigma |
| A | 10 | 83 | 1991353 | 3435.65 | 2849 | 2795 | 578.8 |
| A | 13 | 248 | 999818 | 1722.57 | 2849 | 2795 | 578.8 |
| A | 13 | 6 | 51225 | 83.67 | 2849 | 2795 | 578.8 |
| B | 0 | 245 | 391780 | 718.26 | 2837 | 2755 | 541.6 |
| B | 5 | 255 | 252007 | 460.2 | 2837 | 2755 | 541.6 |
| B | 4 | 171 | 176325 | 320.46 | 2837 | 2755 | 541.6 |
| C | 15 | 214 | 1062774 | 1632.7 | 2790 | 2810 | 649.2 |
| C | 14 | 254 | 945690 | 1452.35 | 2790 | 2810 | 649.2 |
| C | 0 | 10 | 39279 | 56.17 | 2790 | 2810 | 649.2 |
| D | 12 | 227 | 3484078 | 5324.88 | 2678 | 2601 | 653.8 |
| D | 2 | 250 | 3137352 | 4794.56 | 2678 | 2601 | 653.8 |
| D | 12 | 218 | 1510948 | 2307.0 | 2678 | 2601 | 653.8 |
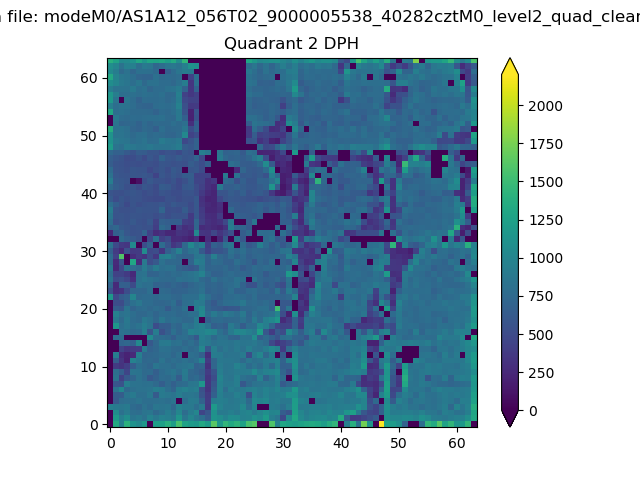
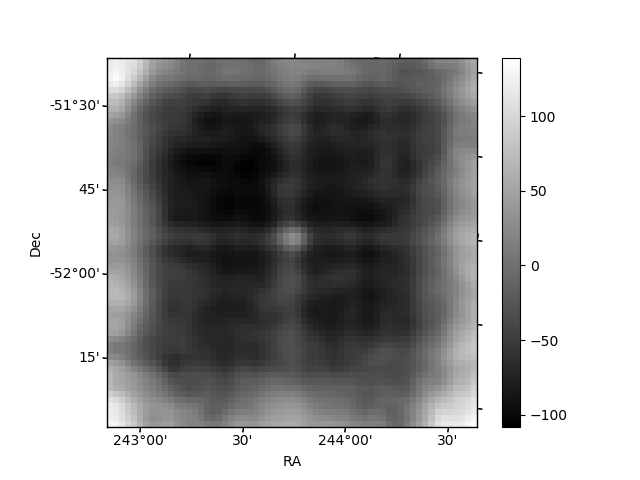
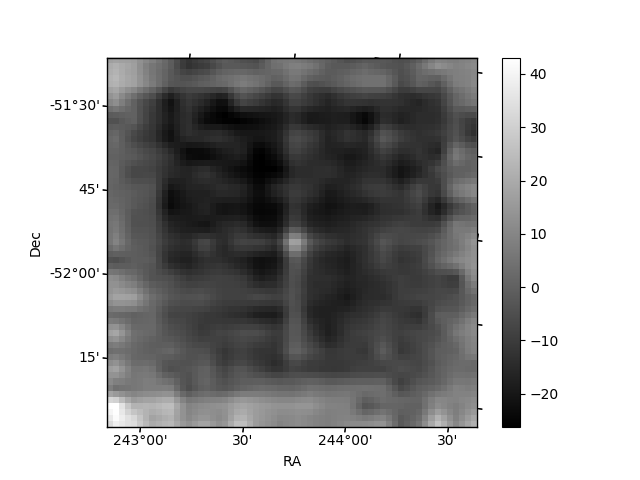
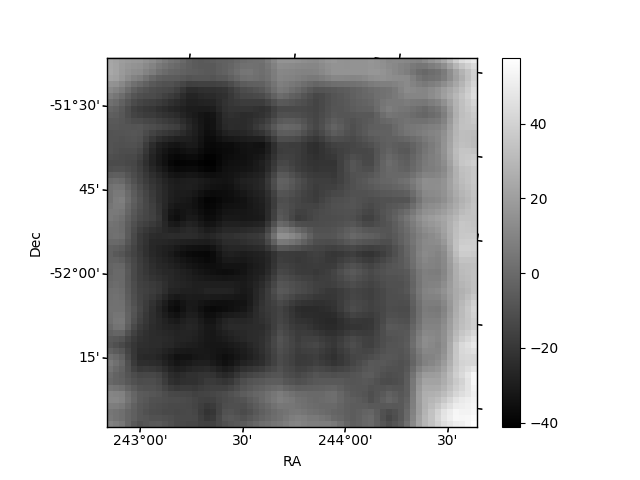
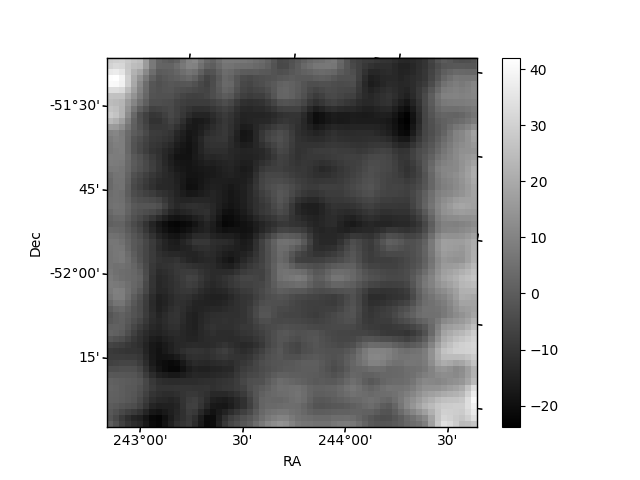
Histogram calculated using DETX and DETY for each event in the final _common_clean file
| Quadrant A | 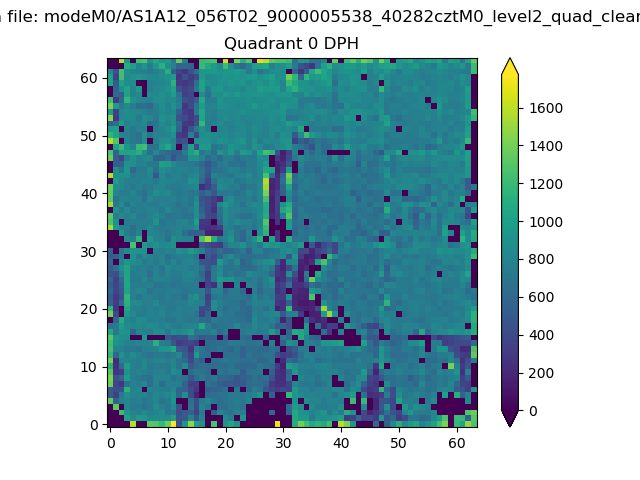 |
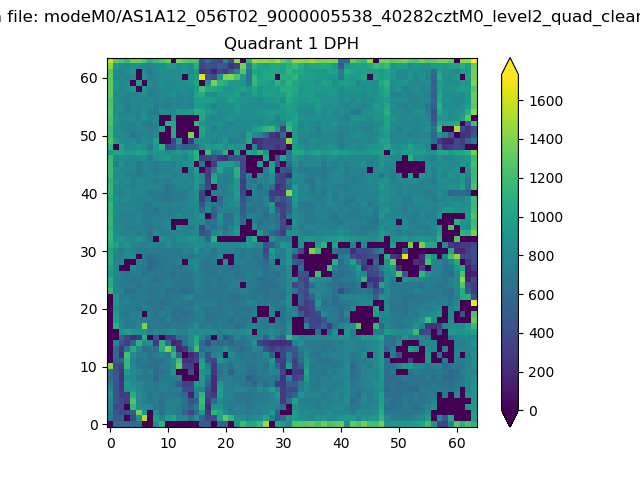 |
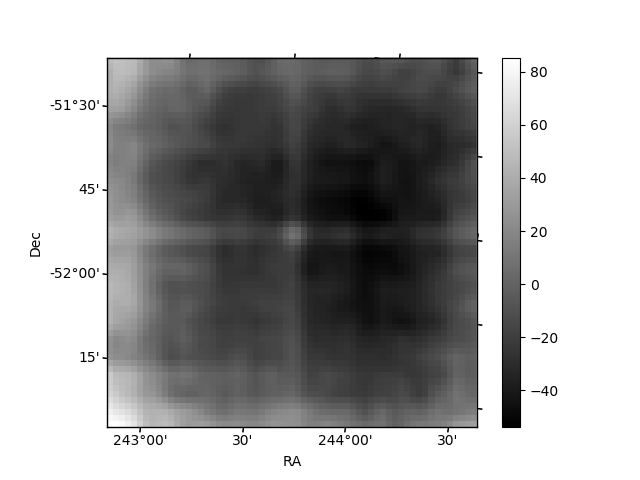
Quadrant B |
|---|---|---|---|
| Quadrant D | 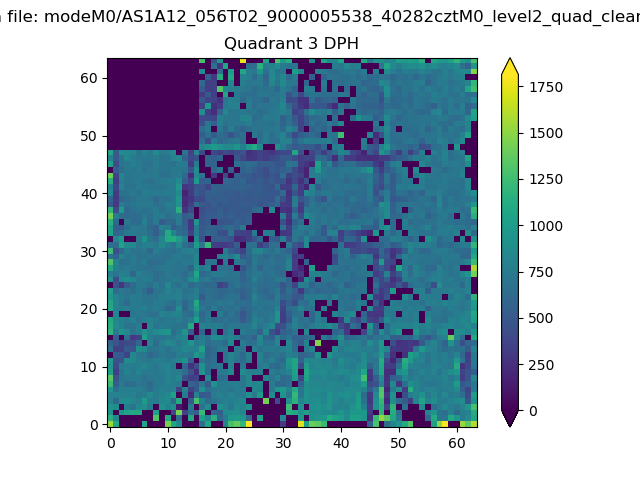 |
 |
Quadrant C |
| Plot type | Count rate plots | Images |
|---|---|---|
| Comparison with Poisson distribution Blue bars denote a histogram of data divided into 1 sec bins. Red curve is a Poisson curve with rate = median count rate of data. |
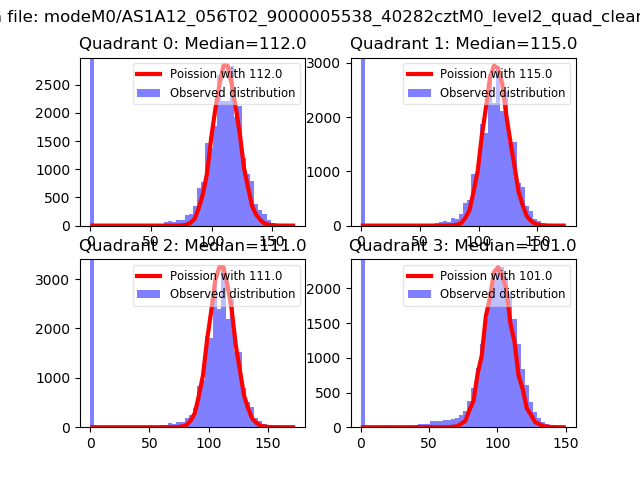 |
 |
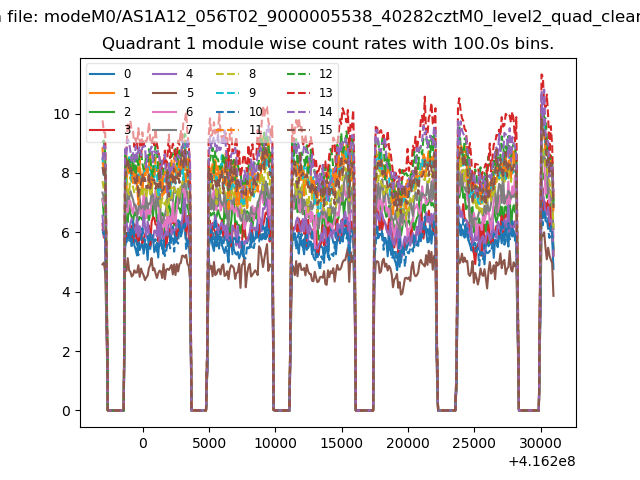
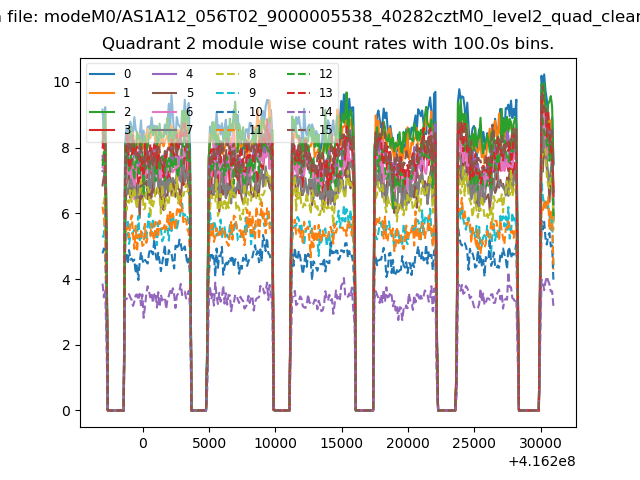
| Quadrant-wise count rates Data is divided into 100 sec bins |
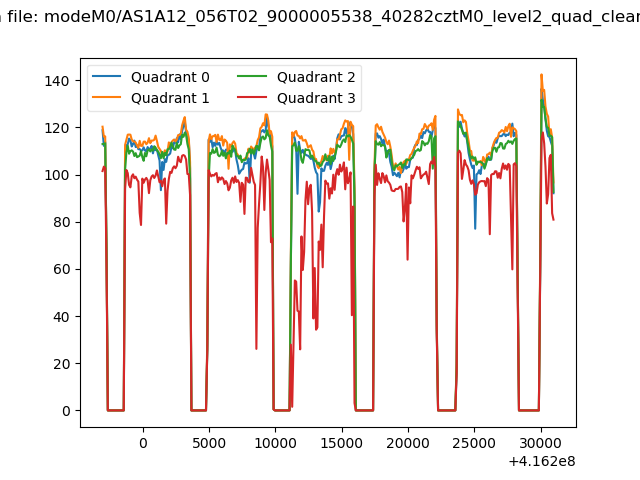 |
|
| Module-wise count rates for Quadrant A Data is divided into 100 sec bins |
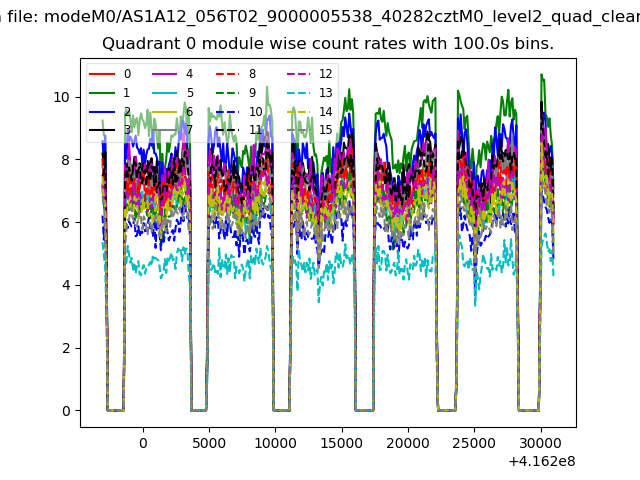 |
 |
| Module-wise count rates for Quadrant B Data is divided into 100 sec bins |
 |
 |
| Module-wise count rates for Quadrant C Data is divided into 100 sec bins |
 |
 |
| Module-wise count rates for Quadrant D Data is divided into 100 sec bins |
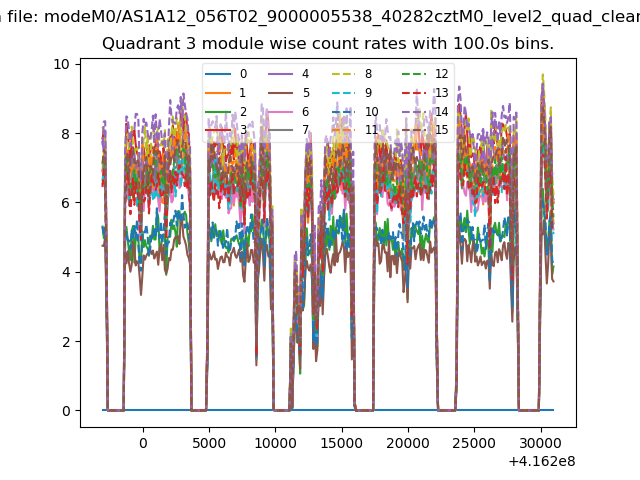 |
 |
| Parameter | Plot |
|---|---|
| CZT HV Monitor | 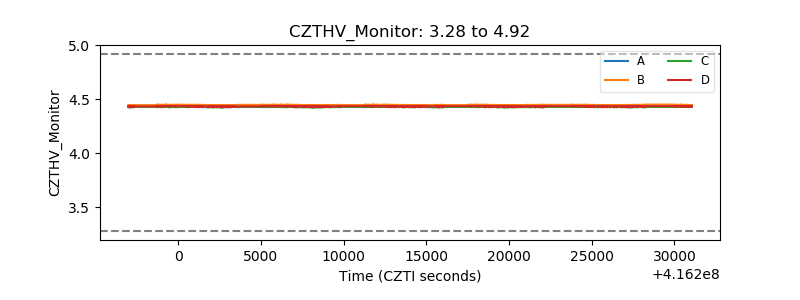 |
| D_VDD | 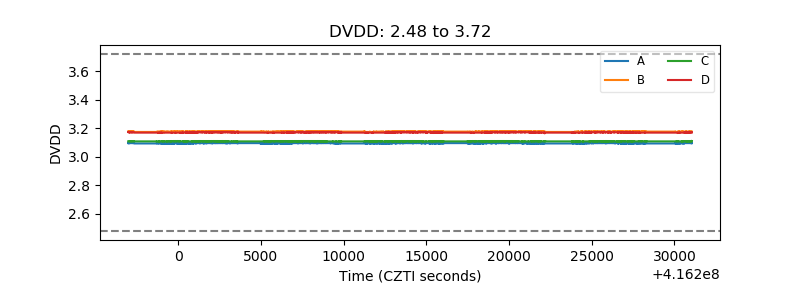 |
| Temperature 1 | 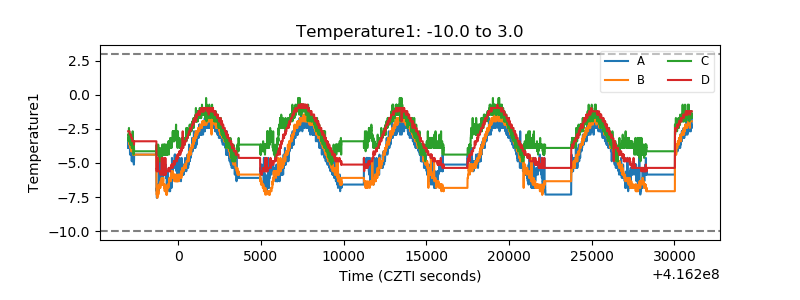 |
| Veto HV Monitor | 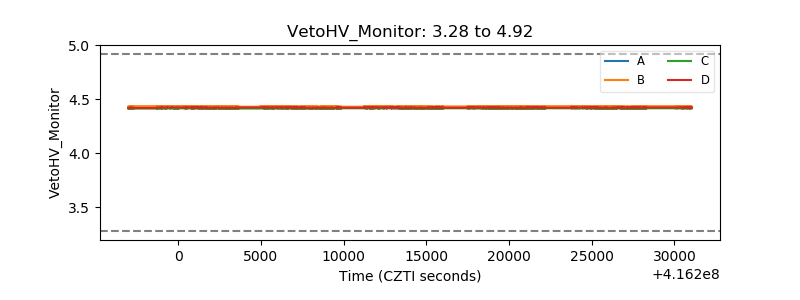 |
| Veto LLD | 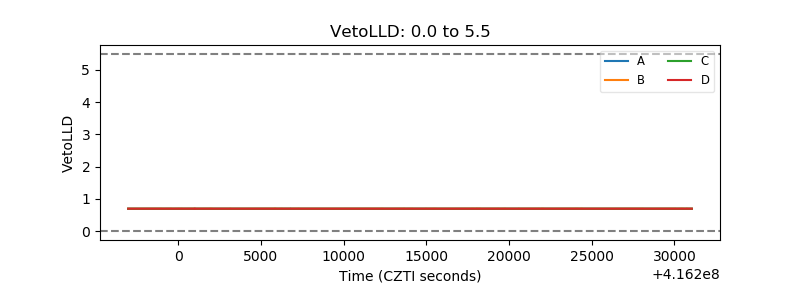 |
| Alpha Counter | 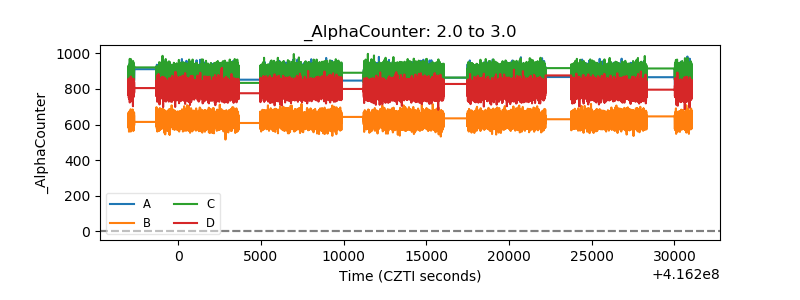 |
| _CPM_Rate | 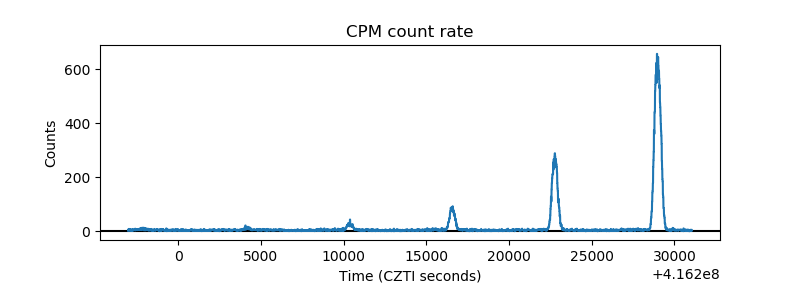 |
| CZT Counter | 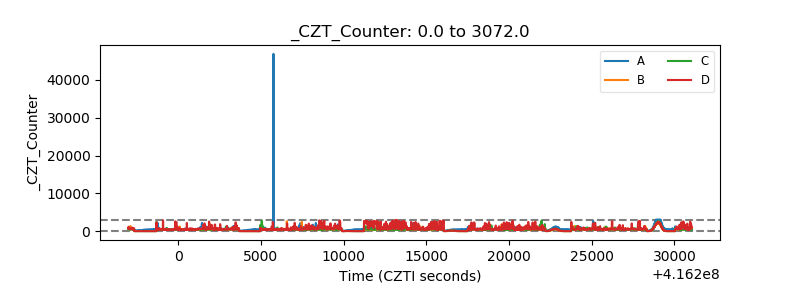 |
| +2.5 Volts monitor | 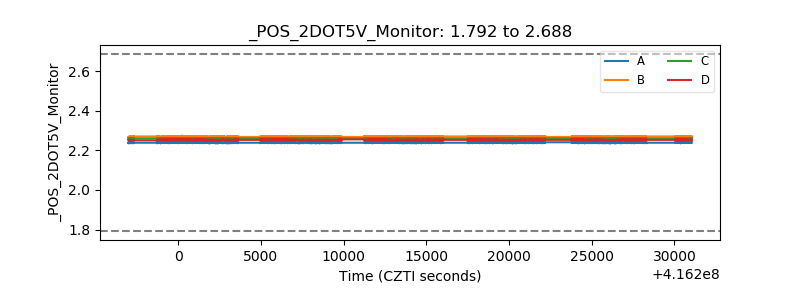 |
| +5 Volts monitor | 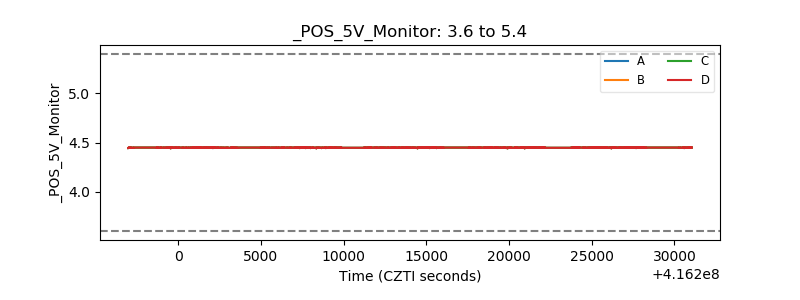 |
| _ROLL_ROT | 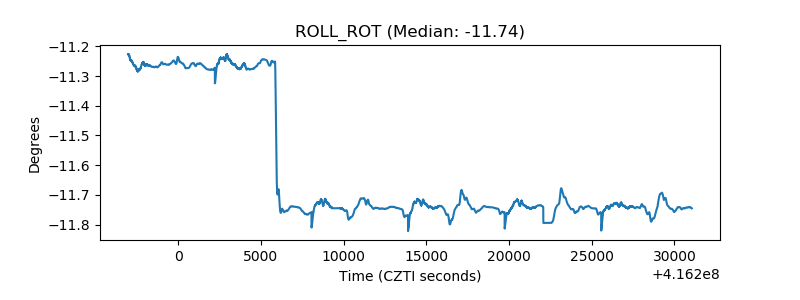 |
| _Roll_DEC | 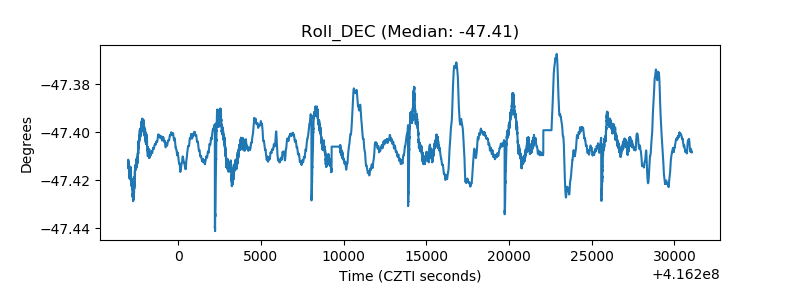 |
| _Roll_RA | 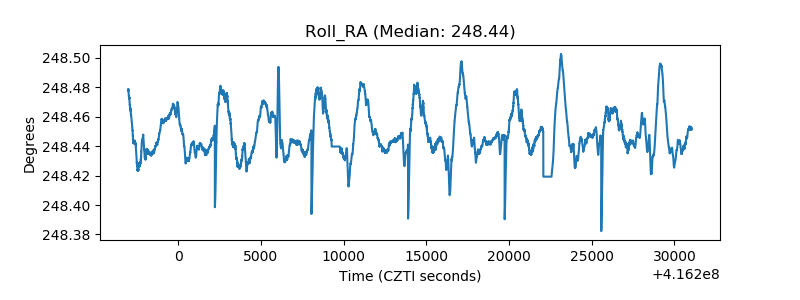 |
| Veto Counter | 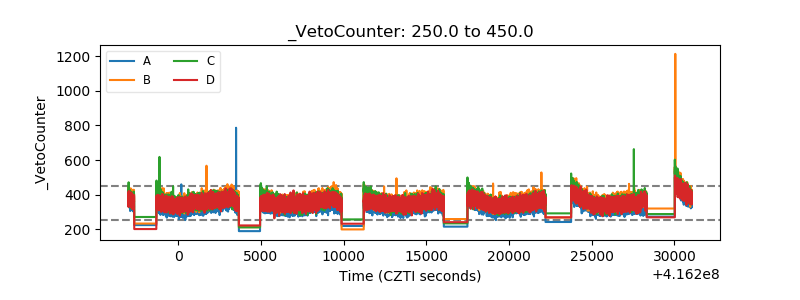 |