| Param | Original file | Final file |
|---|---|---|
| Filename | modeM0/AS1A12_056T02_9000005538_40284cztM0_level2.fits | modeM0/AS1A12_056T02_9000005538_40284cztM0_level2_quad_clean.evt |
| Size (bytes) | 1,954,183,680 | 488,511,360 |
| Size | 1.8 GB | 465.9 MB |
| Events in quadrant A | 16,321,722 | 3,305,753 |
| Events in quadrant B | 14,201,128 | 3,402,742 |
| Events in quadrant C | 14,981,224 | 3,282,698 |
| Events in quadrant D | 24,557,886 | 2,777,078 |
| Mode M0 | |||
|---|---|---|---|
| Quadrant | BADHDUFLAG | Total packets | Discarded packets |
| A | 0 | 65838 | 7 |
| B | 0 | 61578 | 6 |
| C | 0 | 62530 | 6 |
| D | 0 | 93094 | 6 |
| Mode M9 | |||
|---|---|---|---|
| Quadrant | BADHDUFLAG | Total packets | Discarded packets |
| A | 0 | 92 | 0 |
| B | 0 | 92 | 0 |
| C | 0 | 92 | 0 |
| D | 0 | 92 | 0 |
| Mode SS | |||
|---|---|---|---|
| Quadrant | BADHDUFLAG | Total packets | Discarded packets |
| A | 0 | 598 | 0 |
| B | 0 | 598 | 0 |
| C | 0 | 598 | 0 |
| D | 0 | 598 | 0 |
| Quadrant | Total seconds | Saturated seconds | Saturation percentage |
|---|---|---|---|
| A | 29432 | 246 | 0.835825% |
| B | 29432 | 130 | 0.441696% |
| C | 29432 | 113 | 0.383936% |
| D | 29432 | 2857 | 9.707122% |
Noise dominated data is calculated using 1-second bins in cleaned event files. If a bin has >2000 counts, and if more than 50% of those come from <1% of pixels, then it is considered to be noise-dominated and hence unusable.
| Quadrant | # 1 sec bins | Bins with >0 counts | Bins with >2000 counts | High rate bins dominated by noise | Noise dominated (total time) | Noise dominated (detector-on time) | Marked lightcurve |
|---|---|---|---|---|---|---|---|
| A | 38543 | 29438 | 162 | 162 | 0.42% | 0.55% | 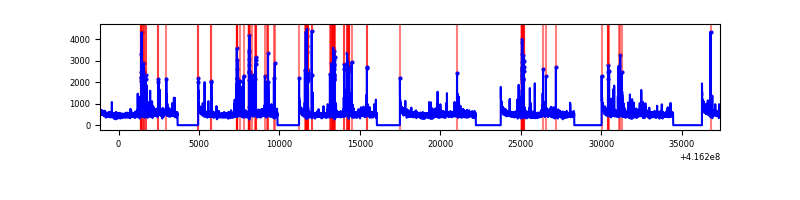 |
| B | 38543 | 29438 | 60 | 60 | 0.16% | 0.20% | 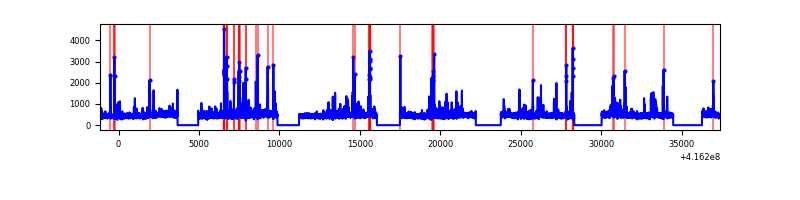 |
| C | 38543 | 29438 | 89 | 89 | 0.23% | 0.30% |  |
| D | 38543 | 29437 | 2522 | 2522 | 6.54% | 8.57% | 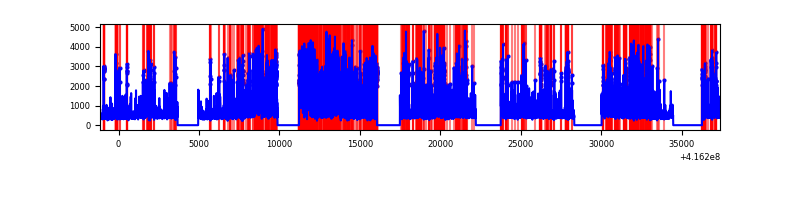 |
Top three noisy pixels from each quadrant. If the there are fewer than three noisy pixels in the level2.evt file, extra rows are filled as -1
| Pixel properties | Quadrant properties | ||||||
|---|---|---|---|---|---|---|---|
| Quadrant | DetID | PixID | Counts | Sigma | Mean | Median | Sigma |
| A | 10 | 83 | 2252329 | 3357.17 | 3305 | 3243 | 669.9 |
| A | 13 | 248 | 1071519 | 1594.59 | 3305 | 3243 | 669.9 |
| A | 13 | 6 | 66538 | 94.48 | 3305 | 3243 | 669.9 |
| B | 0 | 245 | 429323 | 682.19 | 3291 | 3200 | 624.6 |
| B | 4 | 171 | 267830 | 423.65 | 3291 | 3200 | 624.6 |
| B | 5 | 255 | 265063 | 419.22 | 3291 | 3200 | 624.6 |
| C | 15 | 214 | 1226921 | 1629.5 | 3234 | 3254 | 750.9 |
| C | 14 | 254 | 1032973 | 1371.23 | 3234 | 3254 | 750.9 |
| C | 1 | 16 | 42338 | 52.05 | 3234 | 3254 | 750.9 |
| D | 12 | 227 | 4425860 | 5839.54 | 3100 | 3014 | 757.4 |
| D | 2 | 250 | 3404677 | 4491.26 | 3100 | 3014 | 757.4 |
| D | 12 | 218 | 1511479 | 1991.65 | 3100 | 3014 | 757.4 |
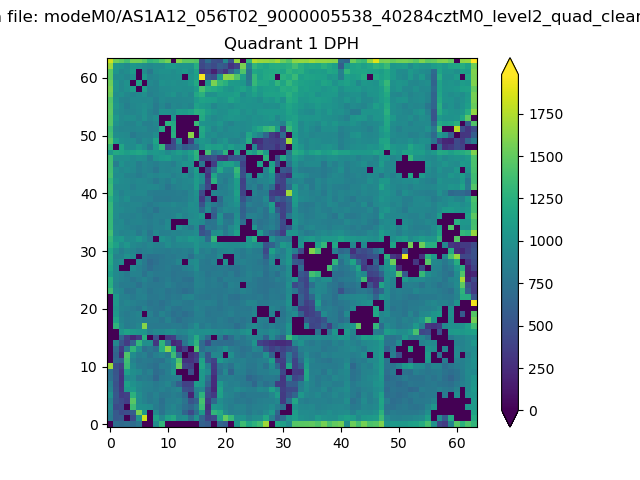
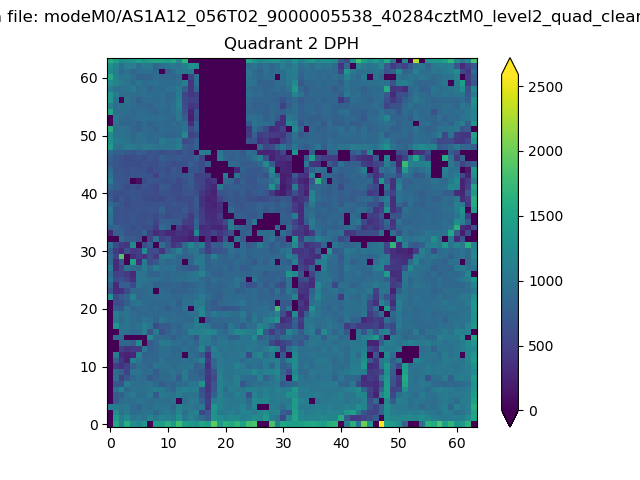
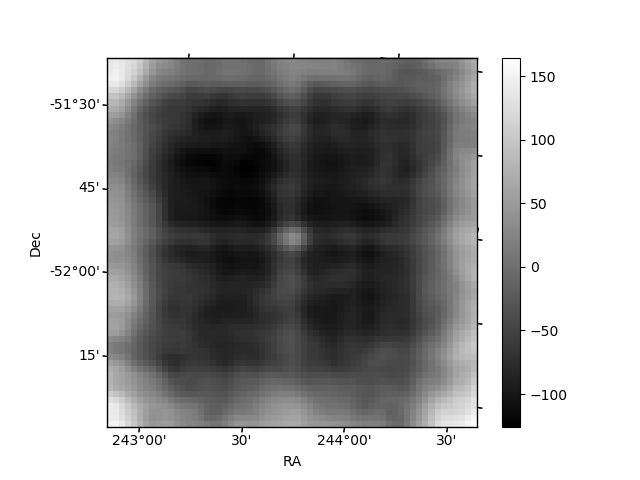
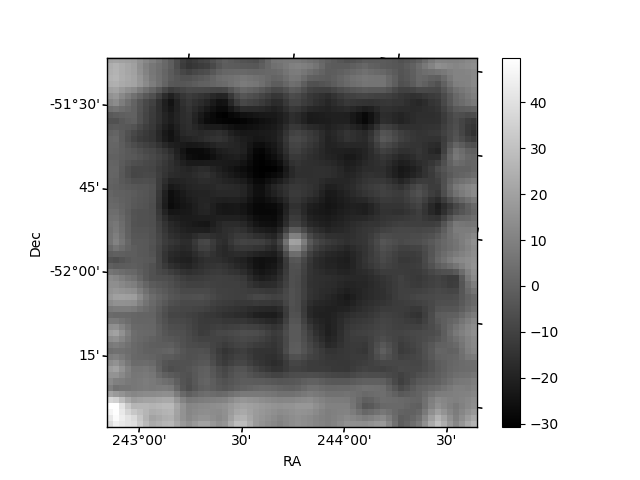
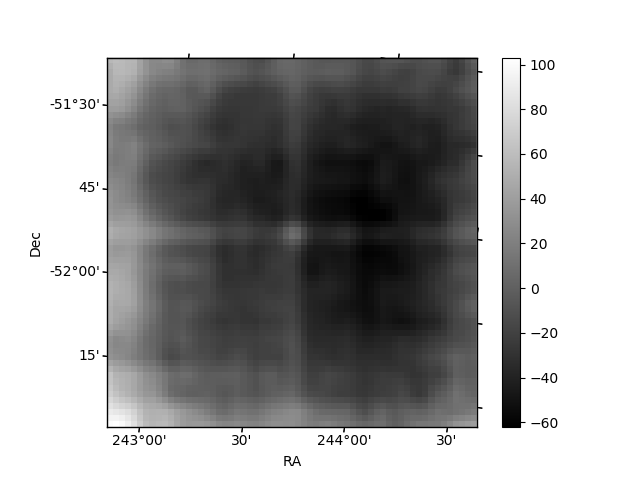
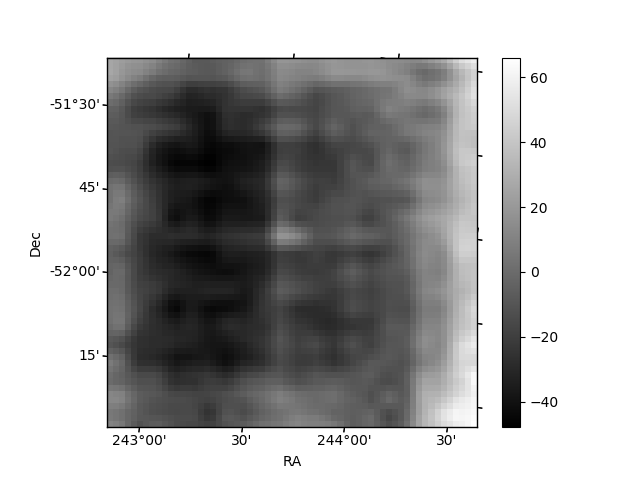
Histogram calculated using DETX and DETY for each event in the final _common_clean file
| Quadrant A | 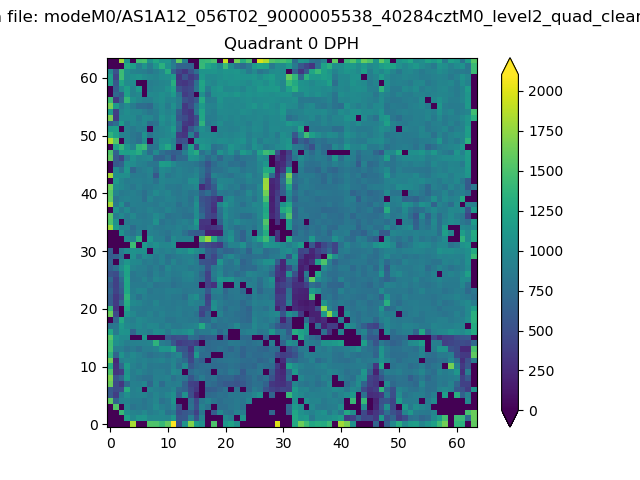 |
 |
Quadrant B |
|---|---|---|---|
| Quadrant D | 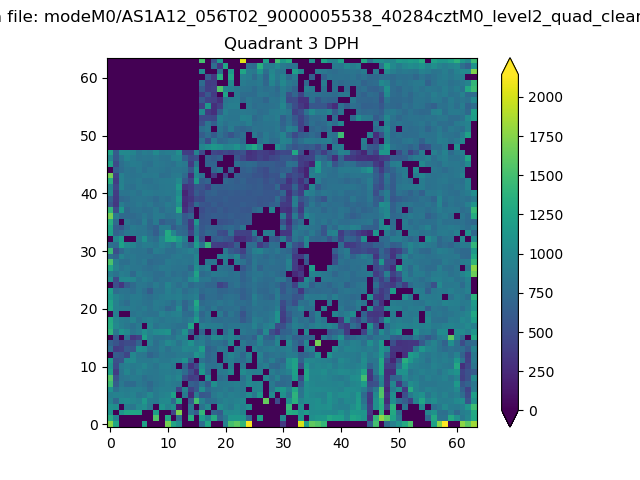 |
 |
Quadrant C |
| Plot type | Count rate plots | Images |
|---|---|---|
| Comparison with Poisson distribution Blue bars denote a histogram of data divided into 1 sec bins. Red curve is a Poisson curve with rate = median count rate of data. |
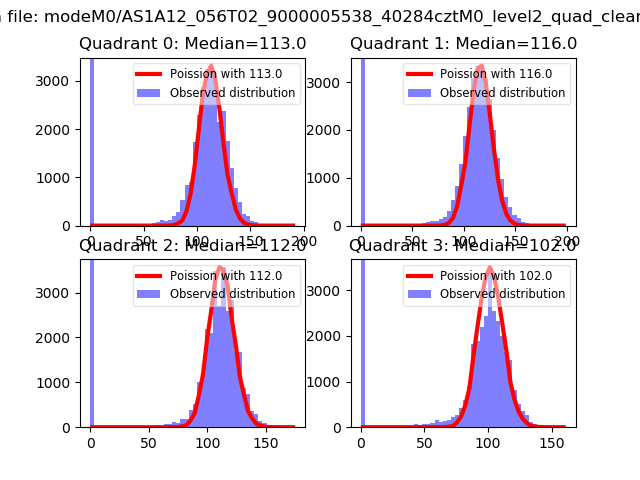 |
 |
| Quadrant-wise count rates Data is divided into 100 sec bins |
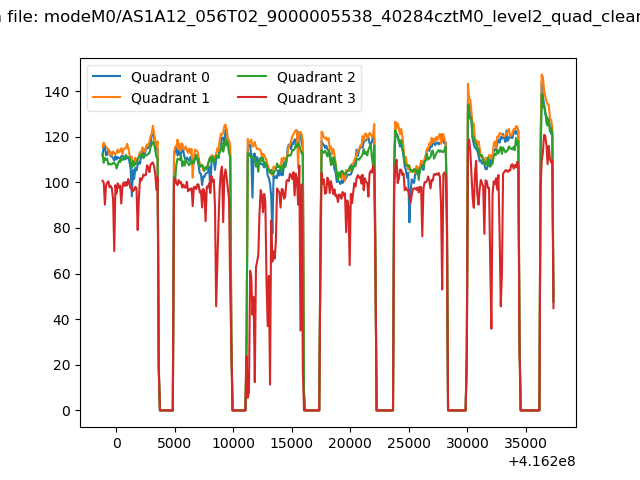 |
|
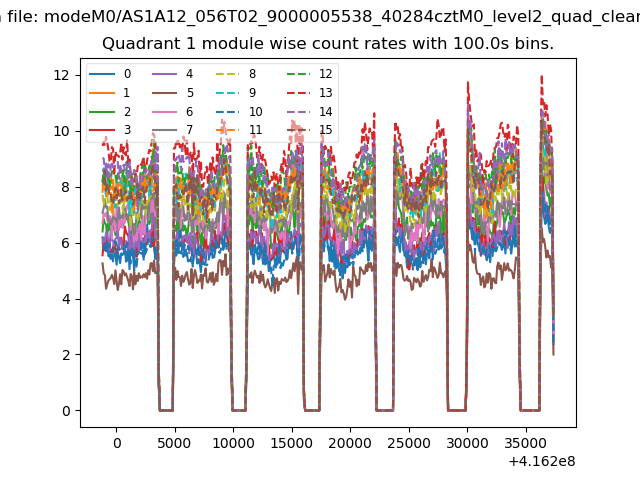
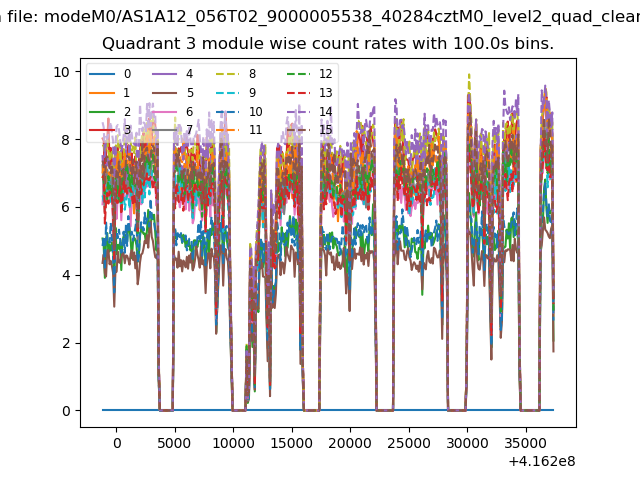
| Module-wise count rates for Quadrant A Data is divided into 100 sec bins |
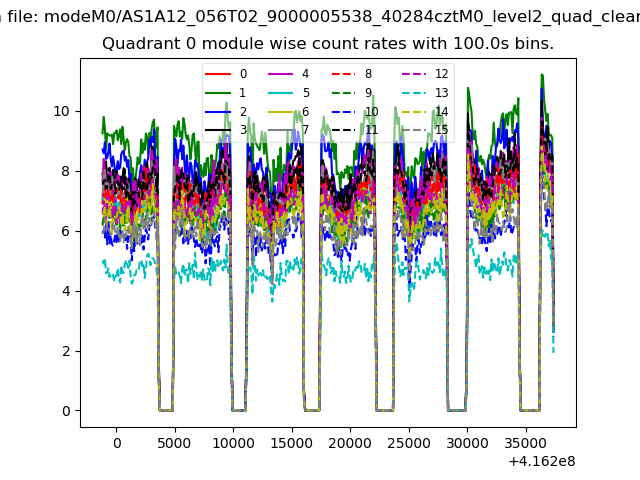 |
 |
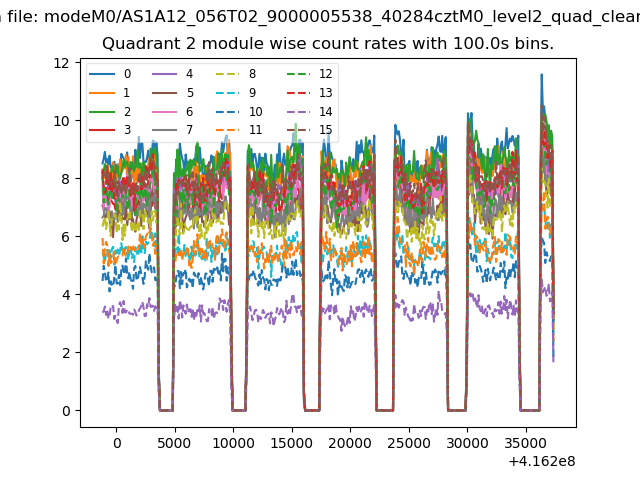
| Module-wise count rates for Quadrant B Data is divided into 100 sec bins |
 |
 |
| Module-wise count rates for Quadrant C Data is divided into 100 sec bins |
 |
 |
| Module-wise count rates for Quadrant D Data is divided into 100 sec bins |
 |
 |
| Parameter | Plot |
|---|---|
| CZT HV Monitor | 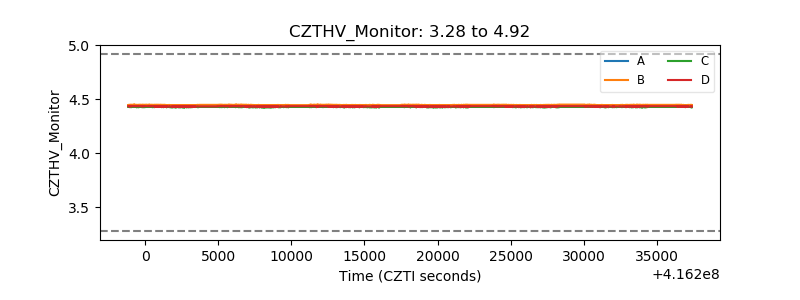 |
| D_VDD | 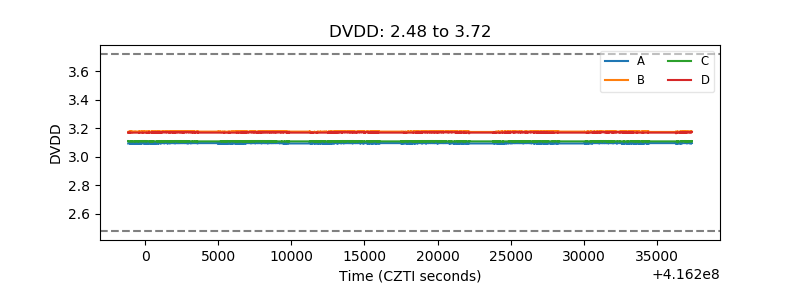 |
| Temperature 1 | 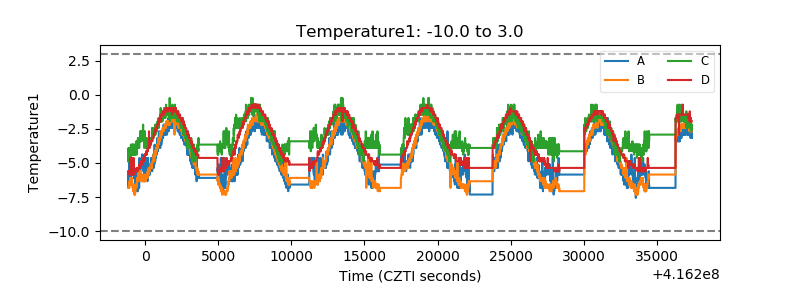 |
| Veto HV Monitor | 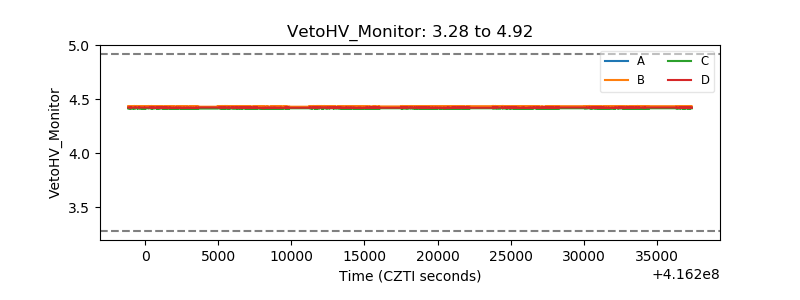 |
| Veto LLD | 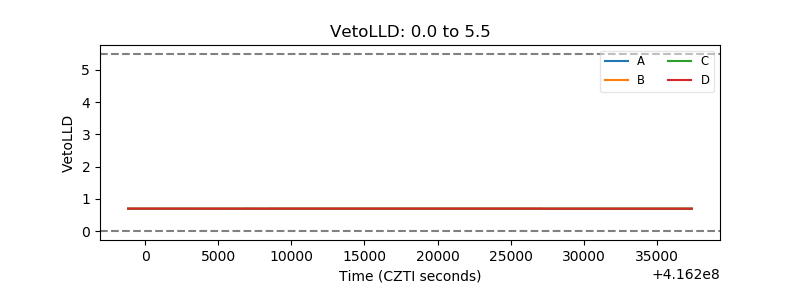 |
| Alpha Counter | 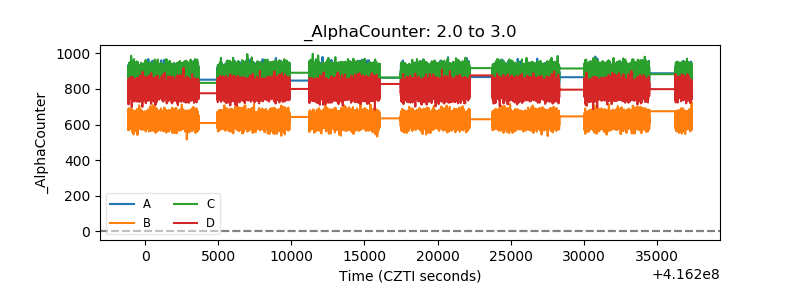 |
| _CPM_Rate | 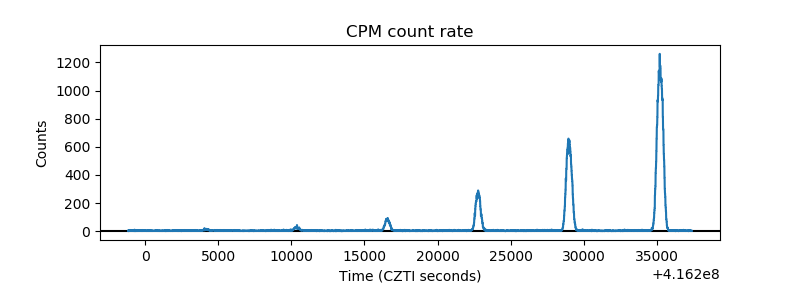 |
| CZT Counter | 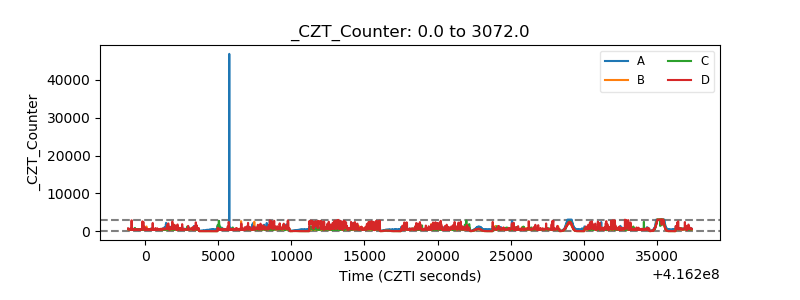 |
| +2.5 Volts monitor | 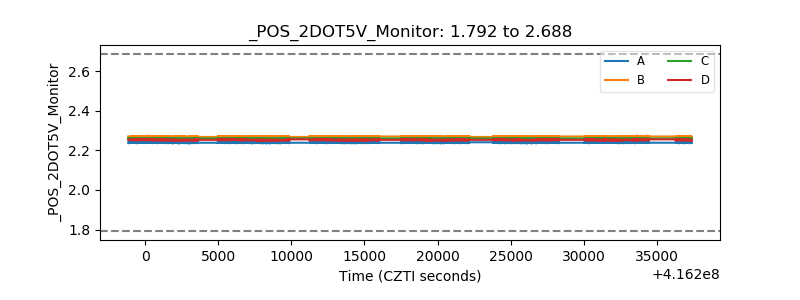 |
| +5 Volts monitor | 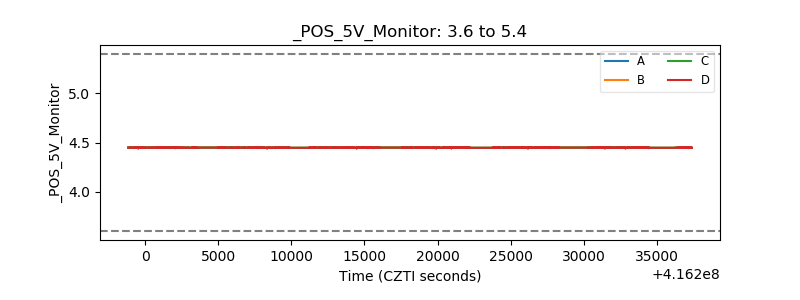 |
| _ROLL_ROT | 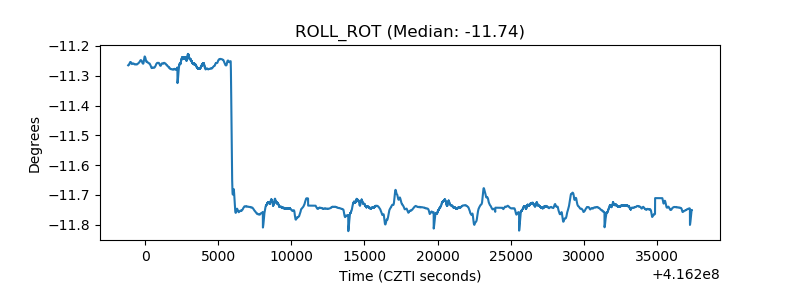 |
| _Roll_DEC | 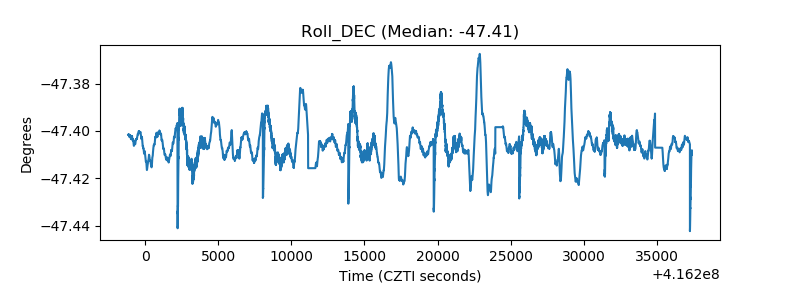 |
| _Roll_RA | 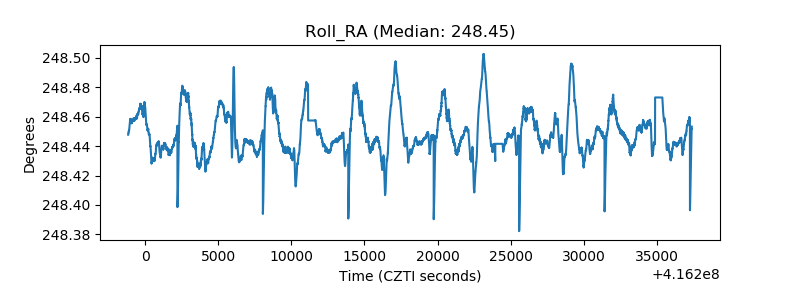 |
| Veto Counter | 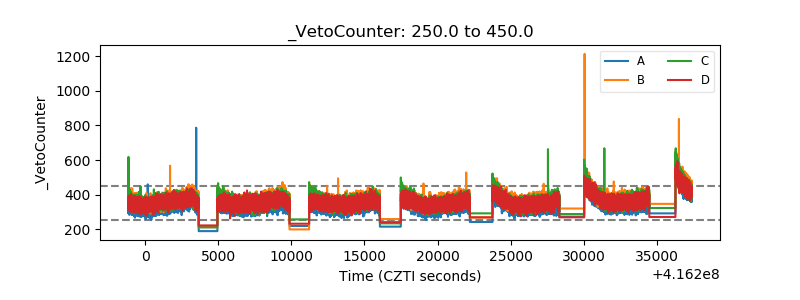 |