| Param | Original file | Final file |
|---|---|---|
| Filename | modeM0/AS1A12_056T02_9000005538_40285cztM0_level2.fits | modeM0/AS1A12_056T02_9000005538_40285cztM0_level2_quad_clean.evt |
| Size (bytes) | 339,068,160 | 99,797,760 |
| Size | 323.4 MB | 95.2 MB |
| Events in quadrant A | 3,065,336 | 684,935 |
| Events in quadrant B | 2,708,474 | 701,718 |
| Events in quadrant C | 2,706,672 | 665,437 |
| Events in quadrant D | 3,653,173 | 595,016 |
| Mode M0 | |||
|---|---|---|---|
| Quadrant | BADHDUFLAG | Total packets | Discarded packets |
| A | 0 | 12328 | 3 |
| B | 0 | 11345 | 2 |
| C | 0 | 11210 | 2 |
| D | 0 | 14472 | 2 |
| Mode M9 | |||
|---|---|---|---|
| Quadrant | BADHDUFLAG | Total packets | Discarded packets |
| A | 0 | 28 | 0 |
| B | 0 | 28 | 0 |
| C | 0 | 28 | 0 |
| D | 0 | 29 | 0 |
| Mode SS | |||
|---|---|---|---|
| Quadrant | BADHDUFLAG | Total packets | Discarded packets |
| A | 0 | 108 | 0 |
| B | 0 | 108 | 0 |
| C | 0 | 108 | 0 |
| D | 0 | 108 | 0 |
| Quadrant | Total seconds | Saturated seconds | Saturation percentage |
|---|---|---|---|
| A | 5362 | 24 | 0.447594% |
| B | 5362 | 21 | 0.391645% |
| C | 5362 | 8 | 0.149198% |
| D | 5362 | 256 | 4.774338% |
Noise dominated data is calculated using 1-second bins in cleaned event files. If a bin has >2000 counts, and if more than 50% of those come from <1% of pixels, then it is considered to be noise-dominated and hence unusable.
| Quadrant | # 1 sec bins | Bins with >0 counts | Bins with >2000 counts | High rate bins dominated by noise | Noise dominated (total time) | Noise dominated (detector-on time) | Marked lightcurve |
|---|---|---|---|---|---|---|---|
| A | 7304 | 5363 | 6 | 6 | 0.08% | 0.11% | 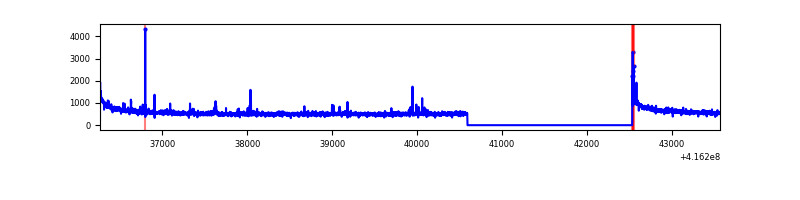 |
| B | 7304 | 5363 | 12 | 12 | 0.16% | 0.22% | 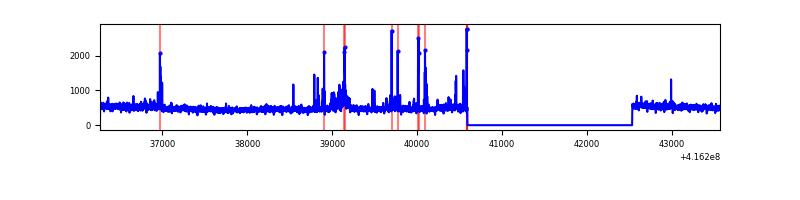 |
| C | 7304 | 5363 | 4 | 4 | 0.05% | 0.07% | 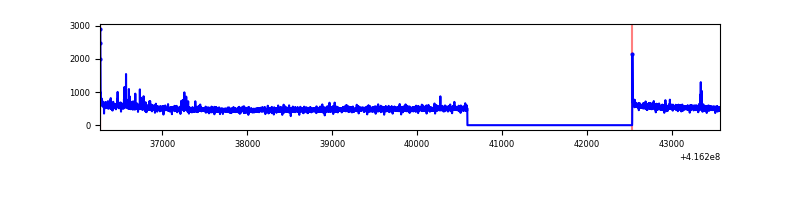 |
| D | 7304 | 5363 | 205 | 205 | 2.81% | 3.82% | 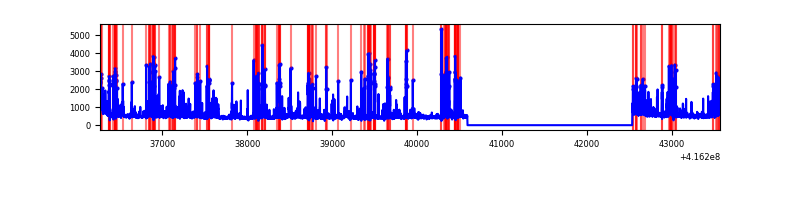 |
Top three noisy pixels from each quadrant. If the there are fewer than three noisy pixels in the level2.evt file, extra rows are filled as -1
| Pixel properties | Quadrant properties | ||||||
|---|---|---|---|---|---|---|---|
| Quadrant | DetID | PixID | Counts | Sigma | Mean | Median | Sigma |
| A | 10 | 83 | 485250 | 3760.98 | 641 | 630 | 128.9 |
| A | 13 | 248 | 44513 | 340.56 | 641 | 630 | 128.9 |
| A | 12 | 189 | 38820 | 296.38 | 641 | 630 | 128.9 |
| B | 0 | 245 | 69922 | 575.69 | 638 | 622 | 120.4 |
| B | 5 | 255 | 54675 | 449.03 | 638 | 622 | 120.4 |
| B | 4 | 171 | 54073 | 444.03 | 638 | 622 | 120.4 |
| C | 15 | 214 | 228013 | 1592.7 | 619 | 624 | 142.8 |
| C | 14 | 254 | 37598 | 258.98 | 619 | 624 | 142.8 |
| C | 0 | 10 | 17601 | 118.91 | 619 | 624 | 142.8 |
| D | 12 | 227 | 438955 | 2978.38 | 606 | 589 | 147.2 |
| D | 2 | 250 | 375334 | 2546.12 | 606 | 589 | 147.2 |
| D | 1 | 47 | 140771 | 952.43 | 606 | 589 | 147.2 |
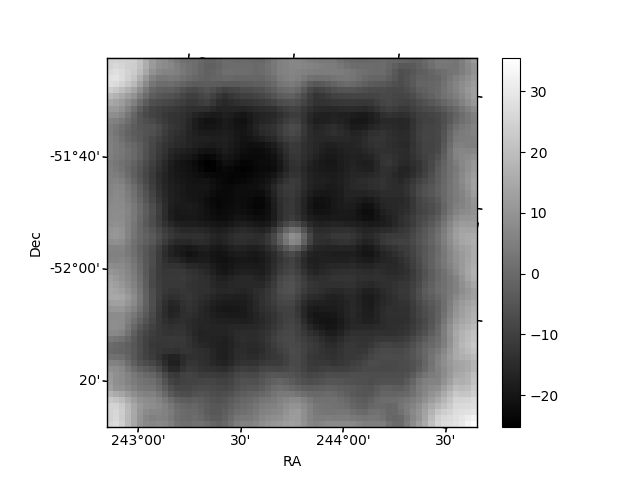
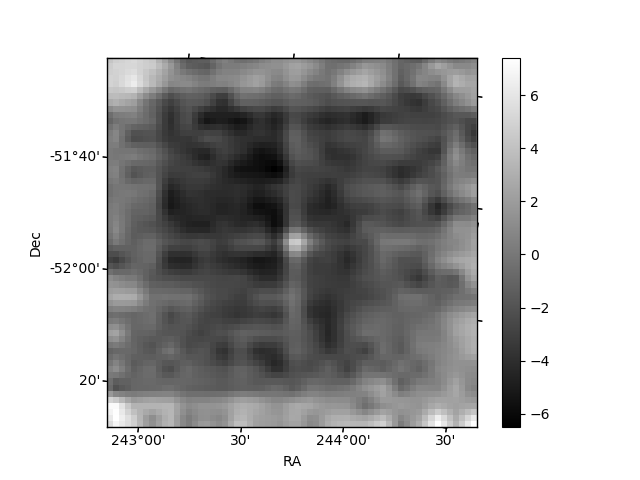
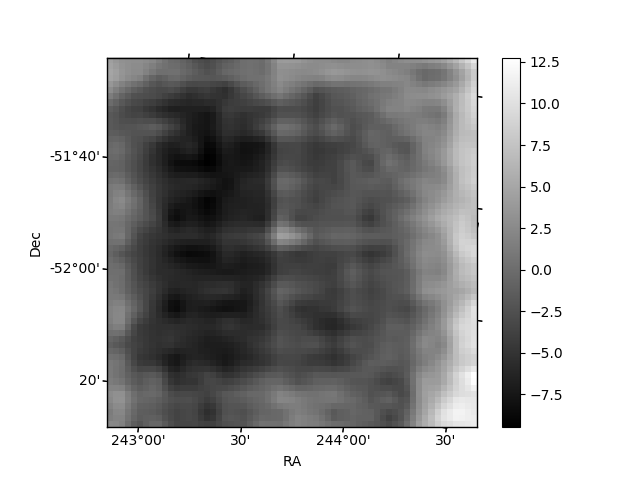
Histogram calculated using DETX and DETY for each event in the final _common_clean file
| Quadrant A | 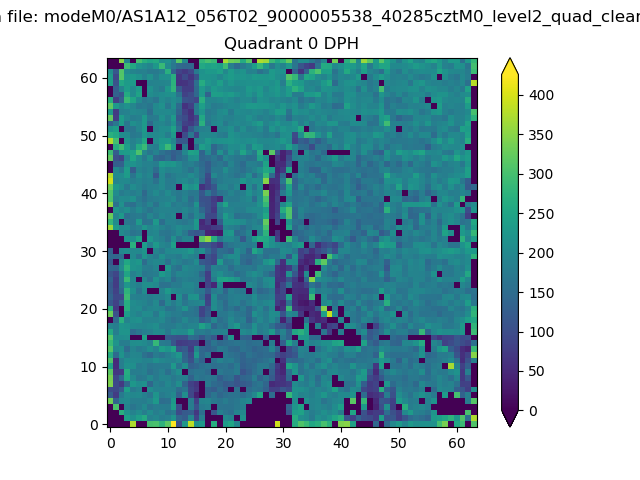 |
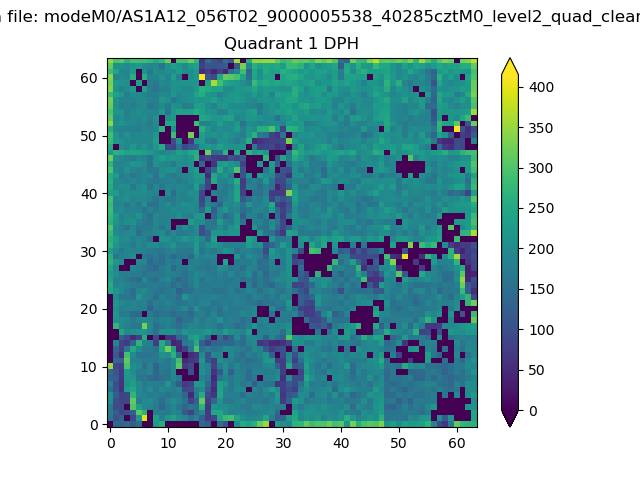 |
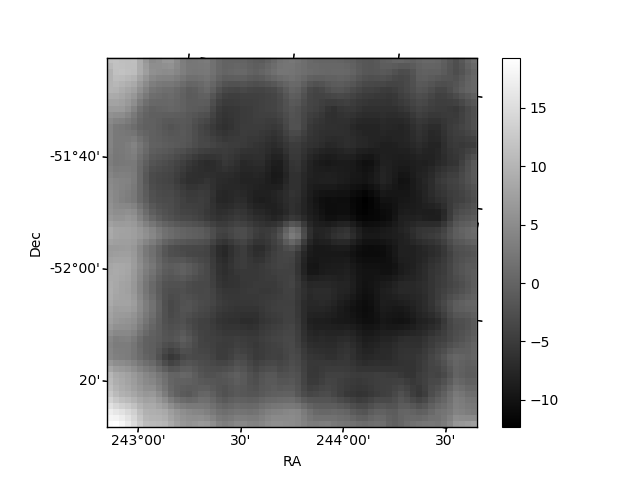
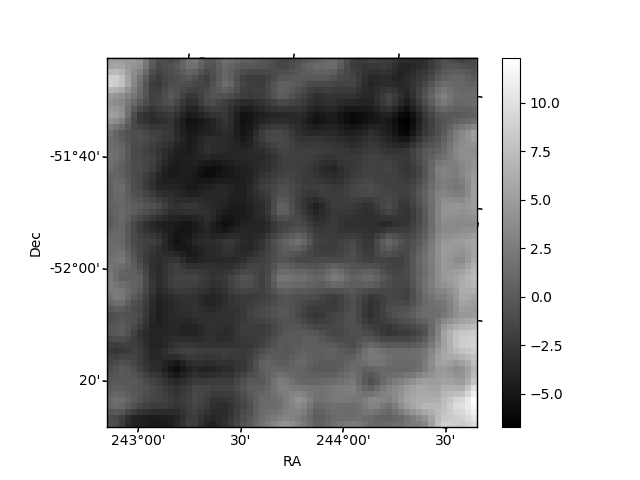
Quadrant B |
|---|---|---|---|
| Quadrant D | 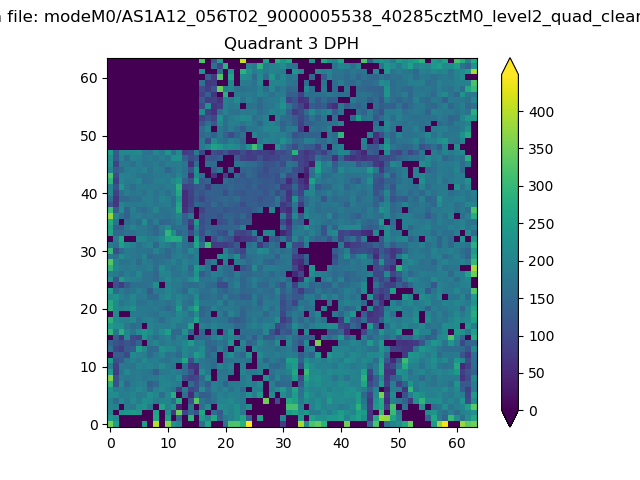 |
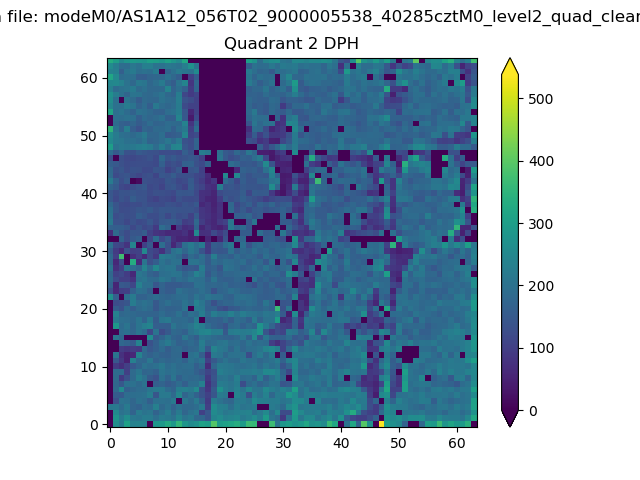 |
Quadrant C |
| Plot type | Count rate plots | Images |
|---|---|---|
| Comparison with Poisson distribution Blue bars denote a histogram of data divided into 1 sec bins. Red curve is a Poisson curve with rate = median count rate of data. |
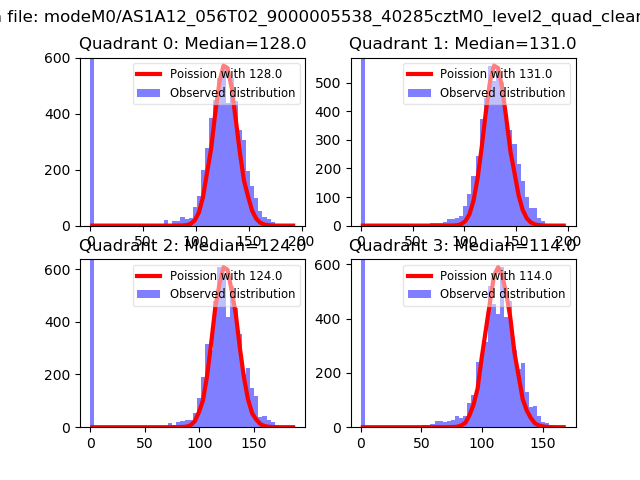 |
 |
| Quadrant-wise count rates Data is divided into 100 sec bins |
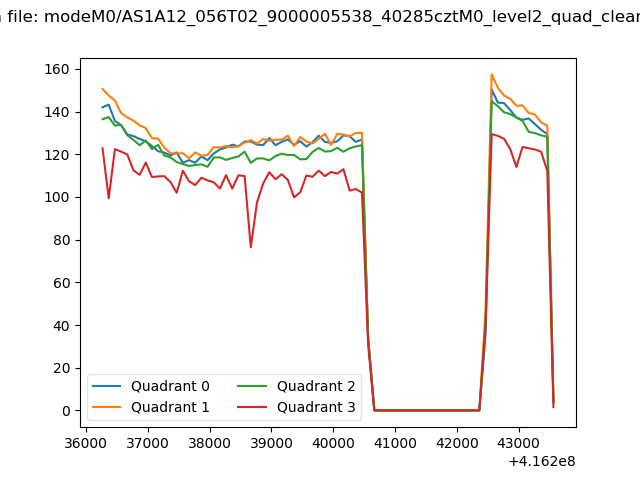 |
|
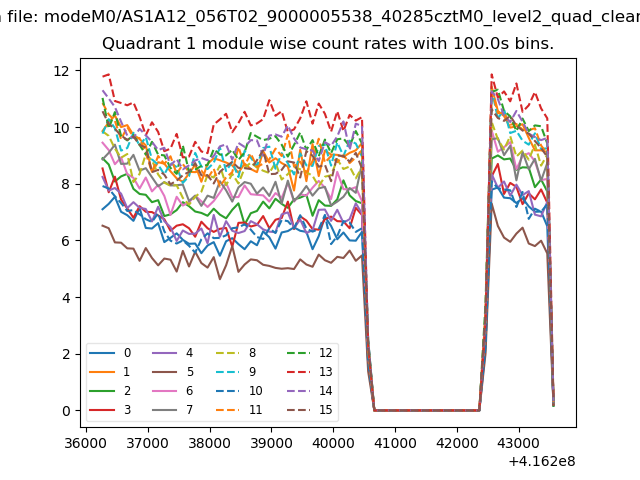
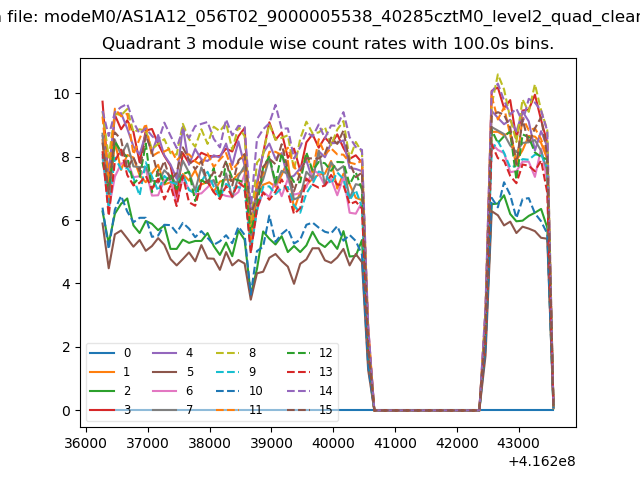
| Module-wise count rates for Quadrant A Data is divided into 100 sec bins |
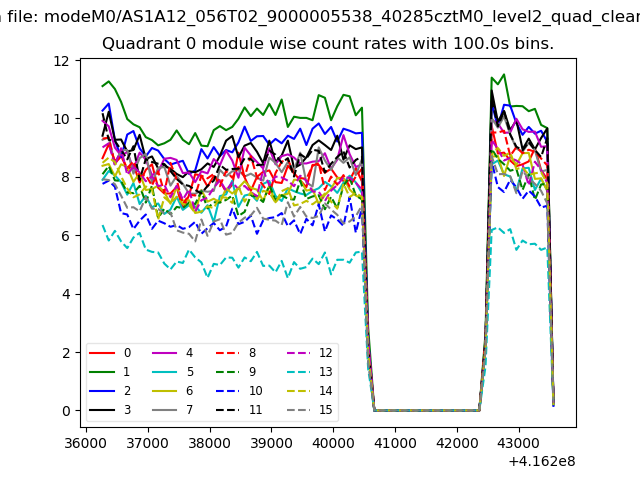 |
 |
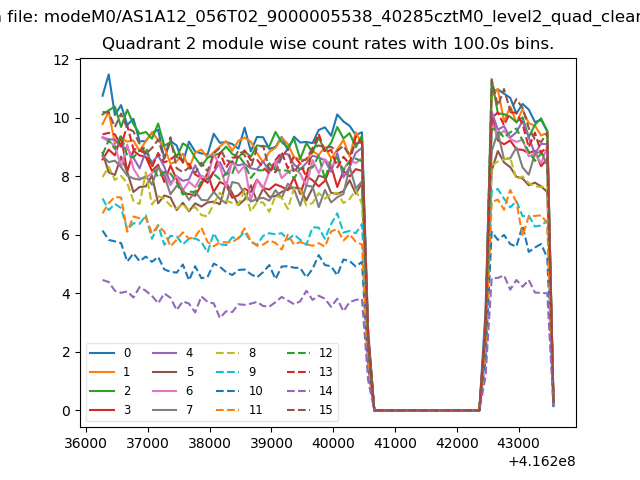
| Module-wise count rates for Quadrant B Data is divided into 100 sec bins |
 |
 |
| Module-wise count rates for Quadrant C Data is divided into 100 sec bins |
 |
 |
| Module-wise count rates for Quadrant D Data is divided into 100 sec bins |
 |
 |
| Parameter | Plot |
|---|---|
| CZT HV Monitor | 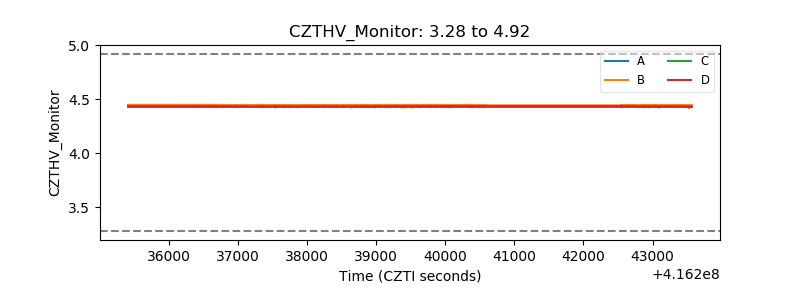 |
| D_VDD | 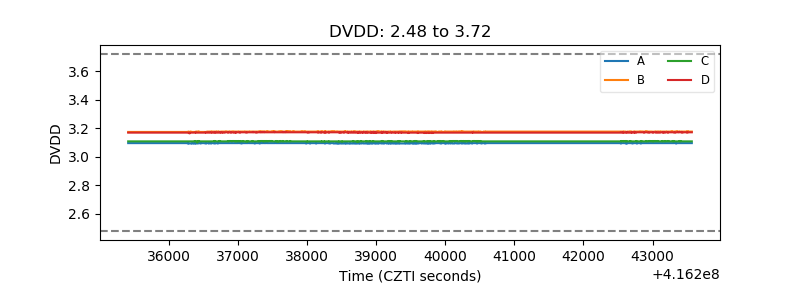 |
| Temperature 1 | 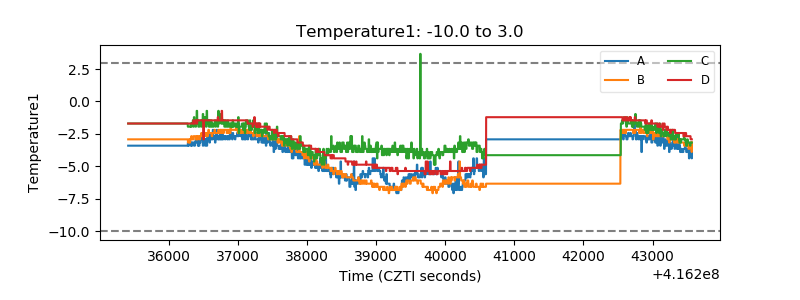 |
| Veto HV Monitor | 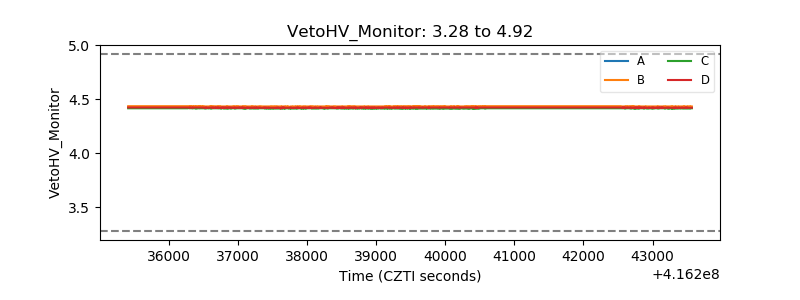 |
| Veto LLD | 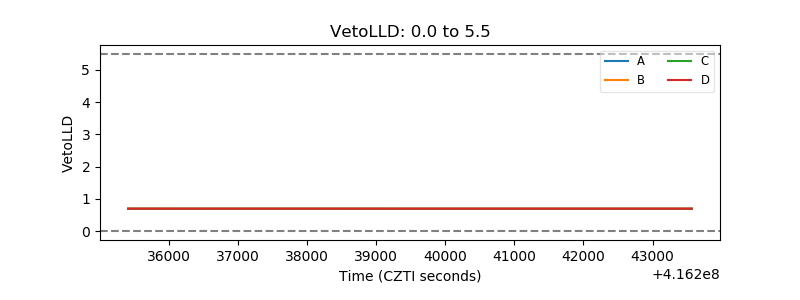 |
| Alpha Counter | 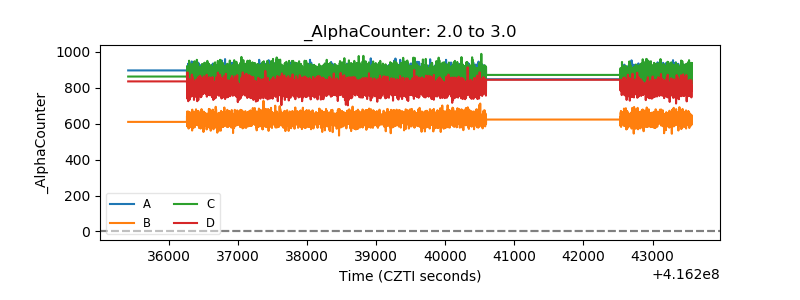 |
| _CPM_Rate | 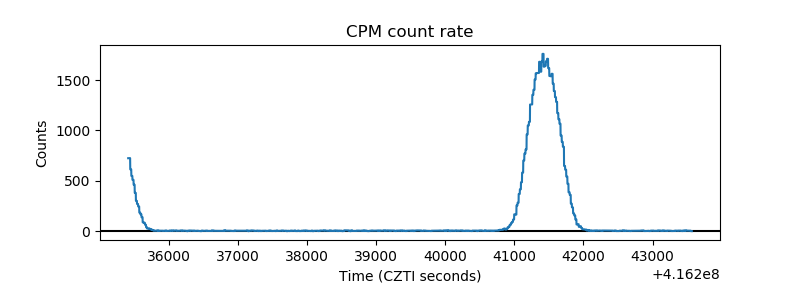 |
| CZT Counter | 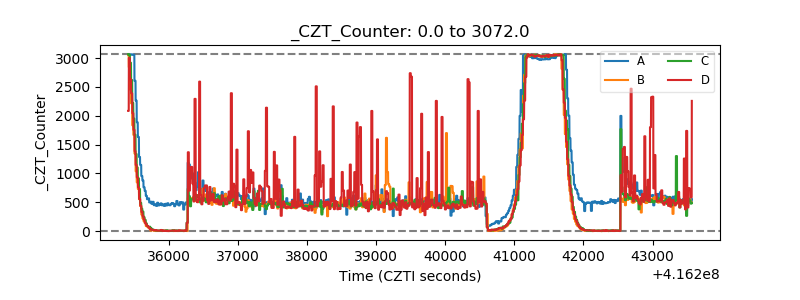 |
| +2.5 Volts monitor | 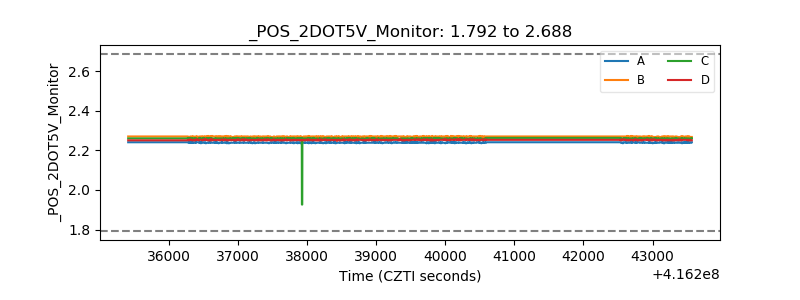 |
| +5 Volts monitor |  |
| _ROLL_ROT | 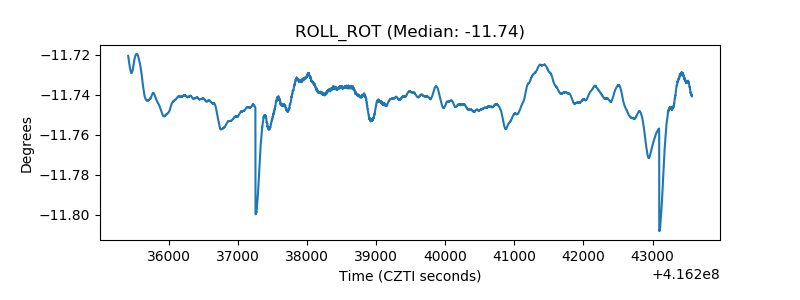 |
| _Roll_DEC | 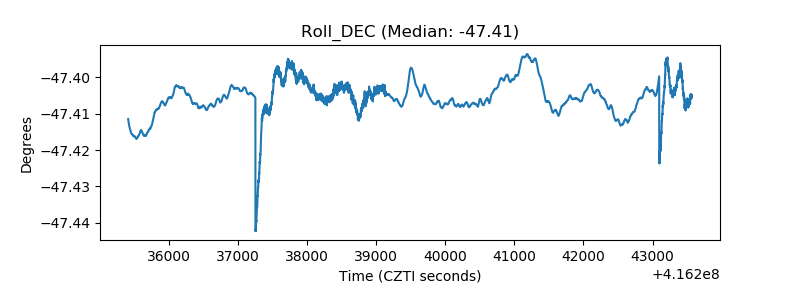 |
| _Roll_RA | 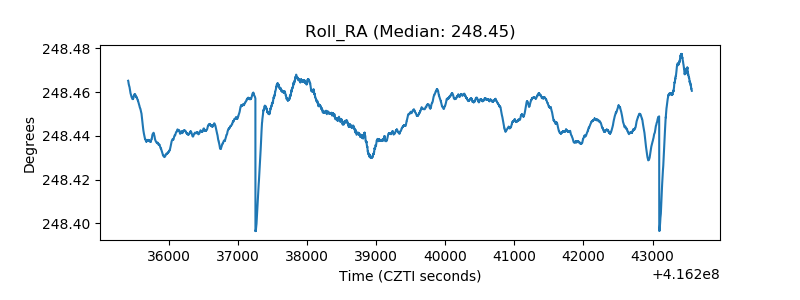 |
| Veto Counter | 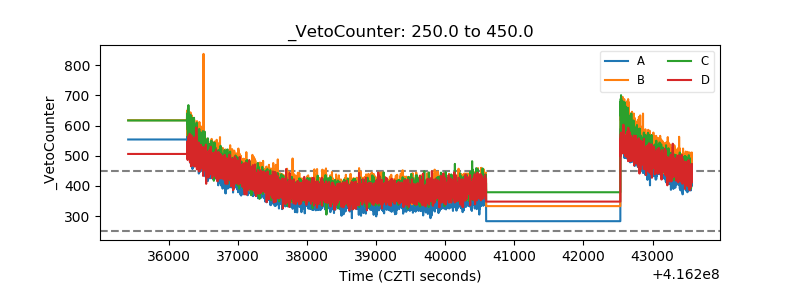 |