| Param | Original file | Final file |
|---|---|---|
| Filename | modeM0/AS1A12_056T02_9000005538_40286cztM0_level2.fits | modeM0/AS1A12_056T02_9000005538_40286cztM0_level2_quad_clean.evt |
| Size (bytes) | 357,675,840 | 98,058,240 |
| Size | 341.1 MB | 93.5 MB |
| Events in quadrant A | 2,979,972 | 686,747 |
| Events in quadrant B | 2,651,800 | 702,598 |
| Events in quadrant C | 3,117,239 | 644,516 |
| Events in quadrant D | 4,090,711 | 575,669 |
| Mode M0 | |||
|---|---|---|---|
| Quadrant | BADHDUFLAG | Total packets | Discarded packets |
| A | 0 | 11917 | 3 |
| B | 0 | 10894 | 2 |
| C | 0 | 12198 | 2 |
| D | 0 | 15616 | 2 |
| Mode M9 | |||
|---|---|---|---|
| Quadrant | BADHDUFLAG | Total packets | Discarded packets |
| A | 0 | 27 | 0 |
| B | 0 | 27 | 0 |
| C | 0 | 27 | 0 |
| D | 0 | 28 | 0 |
| Mode SS | |||
|---|---|---|---|
| Quadrant | BADHDUFLAG | Total packets | Discarded packets |
| A | 0 | 104 | 0 |
| B | 0 | 104 | 0 |
| C | 0 | 104 | 0 |
| D | 0 | 104 | 0 |
| Quadrant | Total seconds | Saturated seconds | Saturation percentage |
|---|---|---|---|
| A | 5140 | 25 | 0.486381% |
| B | 5140 | 15 | 0.291829% |
| C | 5140 | 145 | 2.821012% |
| D | 5140 | 375 | 7.295720% |
Noise dominated data is calculated using 1-second bins in cleaned event files. If a bin has >2000 counts, and if more than 50% of those come from <1% of pixels, then it is considered to be noise-dominated and hence unusable.
| Quadrant | # 1 sec bins | Bins with >0 counts | Bins with >2000 counts | High rate bins dominated by noise | Noise dominated (total time) | Noise dominated (detector-on time) | Marked lightcurve |
|---|---|---|---|---|---|---|---|
| A | 7172 | 5141 | 7 | 7 | 0.10% | 0.14% | 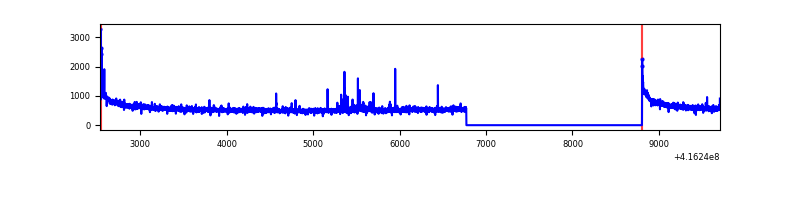 |
| B | 7172 | 5141 | 2 | 2 | 0.03% | 0.04% | 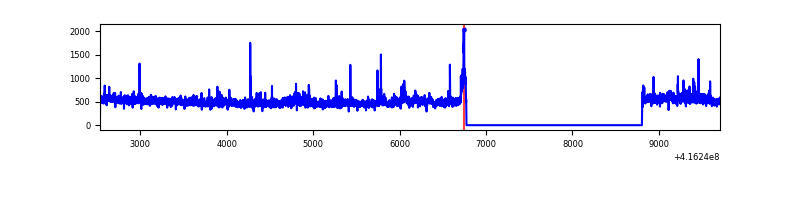 |
| C | 7172 | 5141 | 121 | 121 | 1.69% | 2.35% | 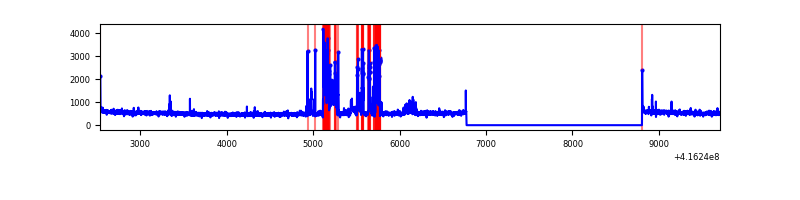 |
| D | 7172 | 5141 | 338 | 338 | 4.71% | 6.57% | 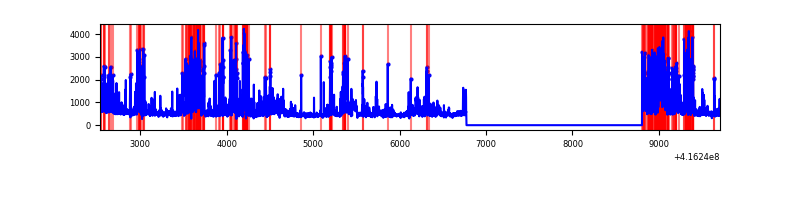 |
Top three noisy pixels from each quadrant. If the there are fewer than three noisy pixels in the level2.evt file, extra rows are filled as -1
| Pixel properties | Quadrant properties | ||||||
|---|---|---|---|---|---|---|---|
| Quadrant | DetID | PixID | Counts | Sigma | Mean | Median | Sigma |
| A | 10 | 83 | 473643 | 3694.37 | 629 | 620 | 128.0 |
| A | 13 | 248 | 36915 | 283.47 | 629 | 620 | 128.0 |
| A | 13 | 6 | 13016 | 96.81 | 629 | 620 | 128.0 |
| B | 0 | 245 | 82475 | 696.81 | 627 | 611 | 117.5 |
| B | 0 | 230 | 47929 | 402.76 | 627 | 611 | 117.5 |
| B | 4 | 171 | 31092 | 259.45 | 627 | 611 | 117.5 |
| C | 14 | 254 | 532826 | 3872.85 | 599 | 607 | 137.4 |
| C | 15 | 214 | 216645 | 1572.06 | 599 | 607 | 137.4 |
| C | 0 | 10 | 15615 | 109.21 | 599 | 607 | 137.4 |
| D | 12 | 227 | 858823 | 6009.43 | 585 | 571 | 142.8 |
| D | 2 | 250 | 649673 | 4544.98 | 585 | 571 | 142.8 |
| D | 12 | 217 | 185245 | 1293.08 | 585 | 571 | 142.8 |
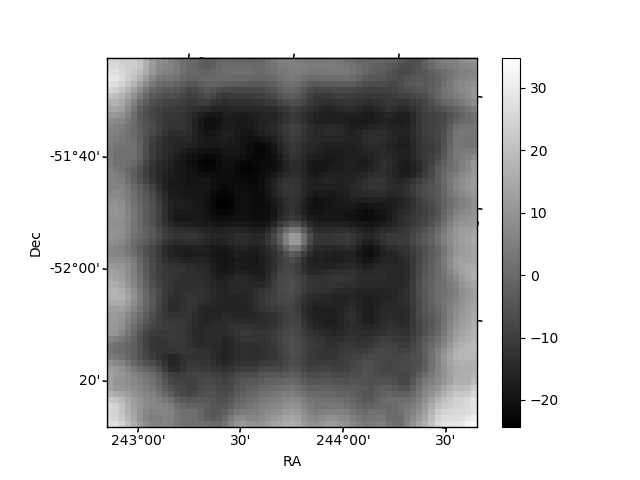
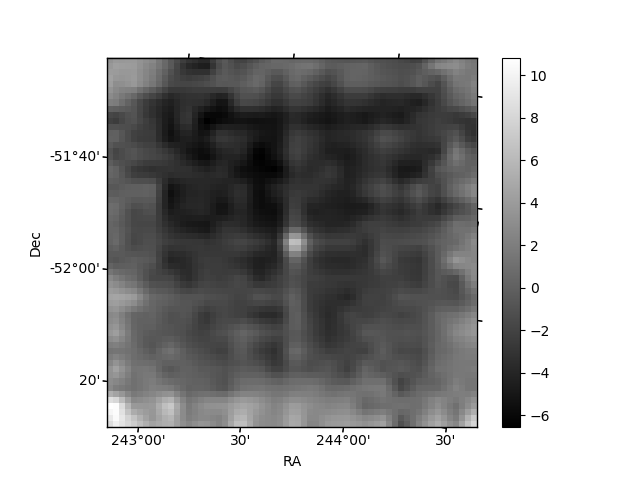
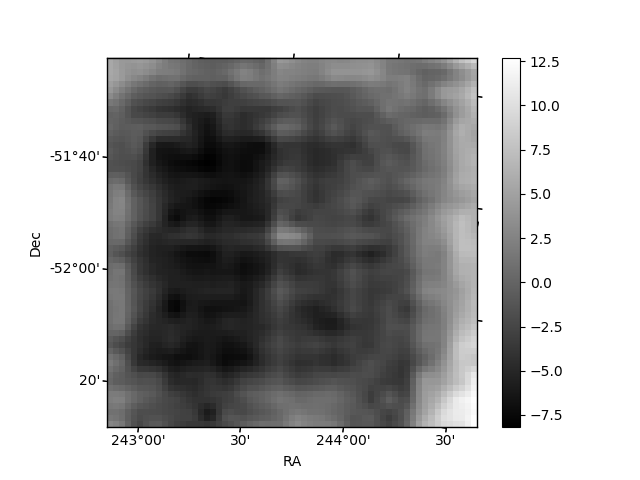
Histogram calculated using DETX and DETY for each event in the final _common_clean file
| Quadrant A | 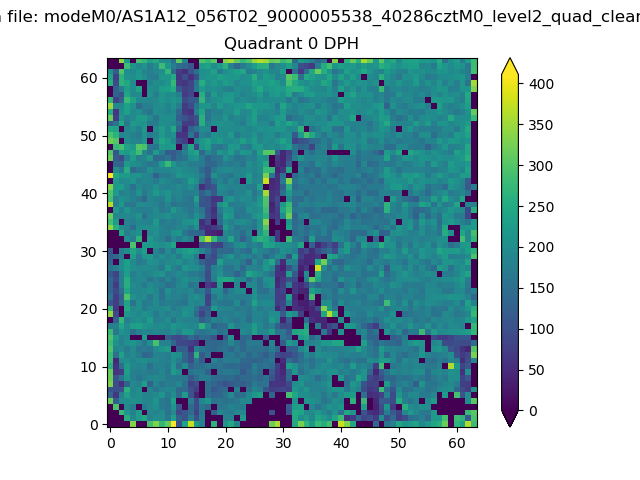 |
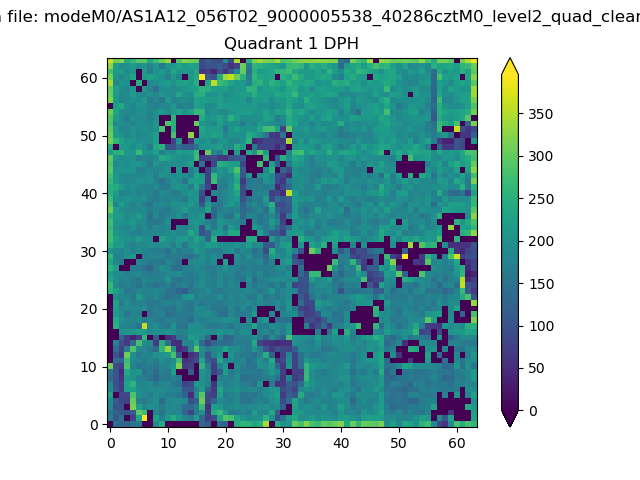 |
Quadrant B |
|---|---|---|---|
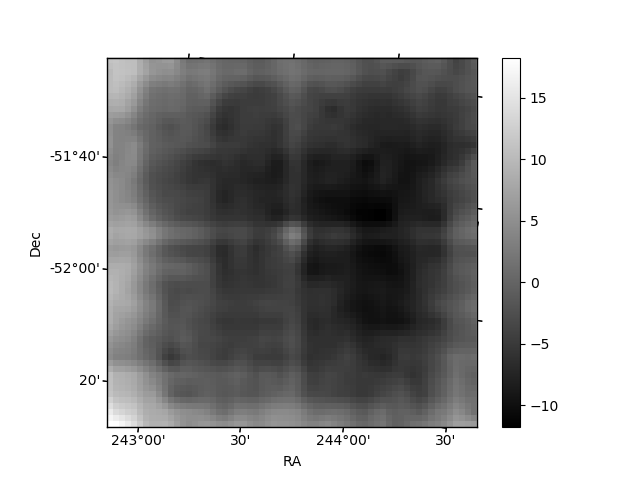
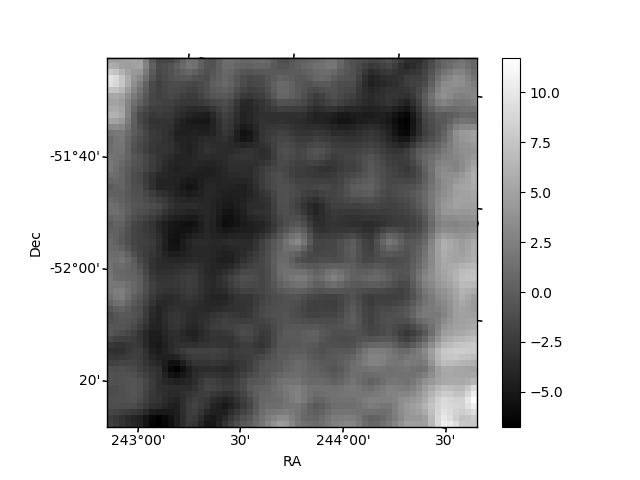
| Quadrant D | 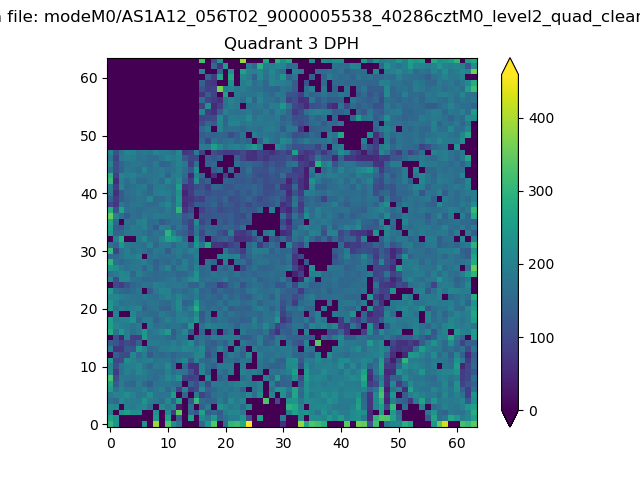 |
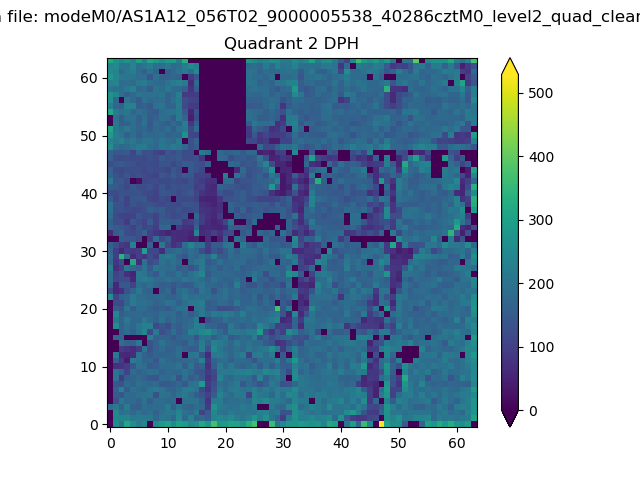 |
Quadrant C |
| Plot type | Count rate plots | Images |
|---|---|---|
| Comparison with Poisson distribution Blue bars denote a histogram of data divided into 1 sec bins. Red curve is a Poisson curve with rate = median count rate of data. |
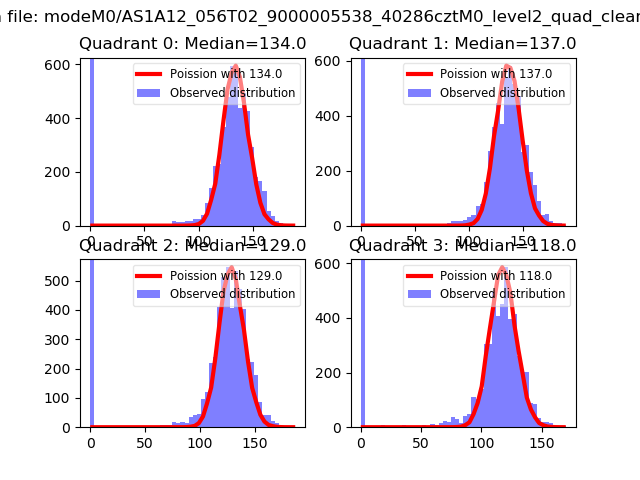 |
 |
| Quadrant-wise count rates Data is divided into 100 sec bins |
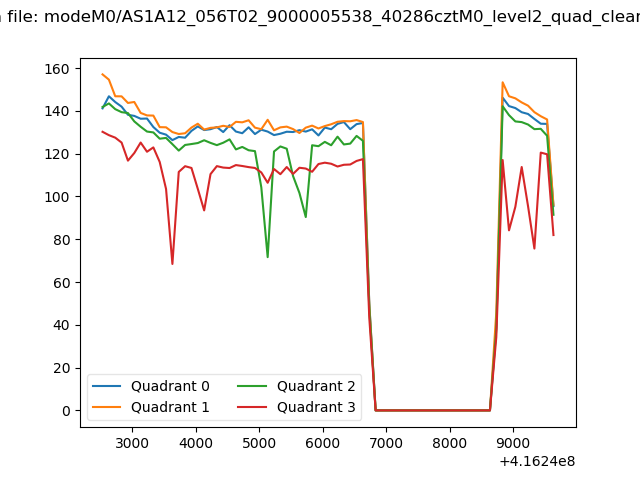 |
|
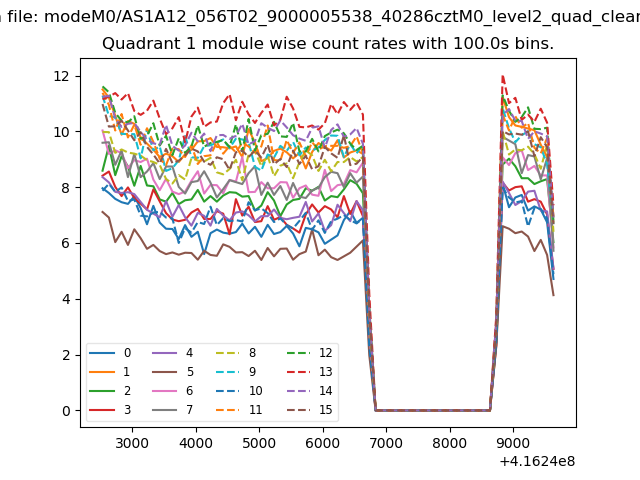
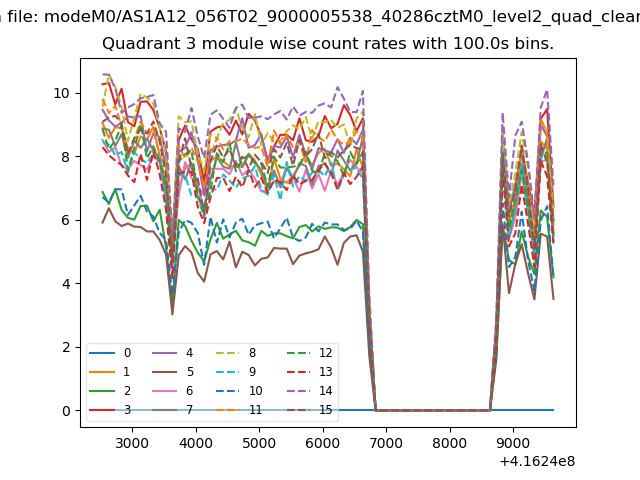
| Module-wise count rates for Quadrant A Data is divided into 100 sec bins |
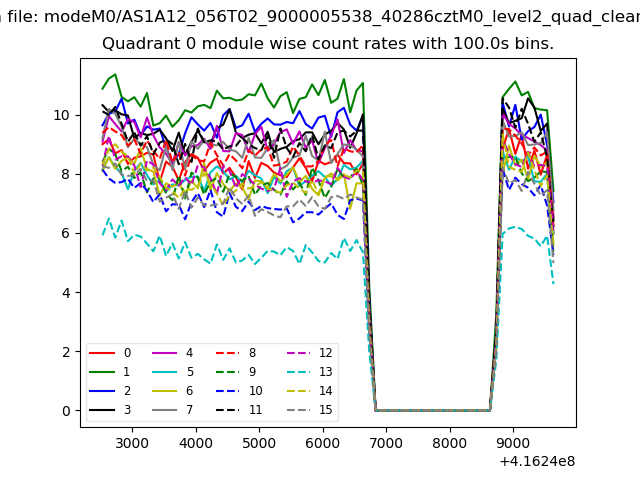 |
 |
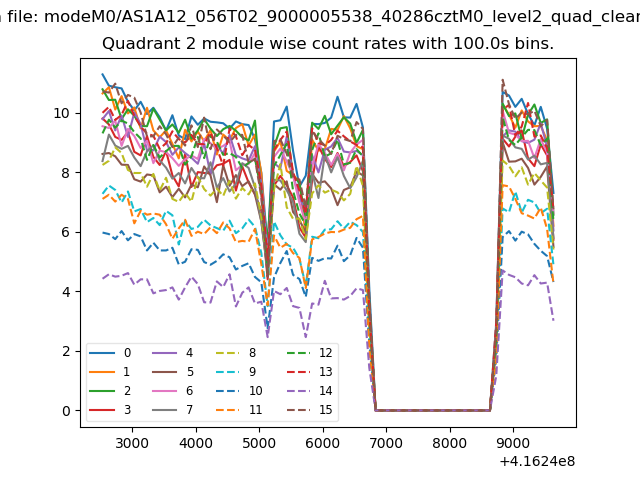
| Module-wise count rates for Quadrant B Data is divided into 100 sec bins |
 |
 |
| Module-wise count rates for Quadrant C Data is divided into 100 sec bins |
 |
 |
| Module-wise count rates for Quadrant D Data is divided into 100 sec bins |
 |
 |
| Parameter | Plot |
|---|---|
| CZT HV Monitor | 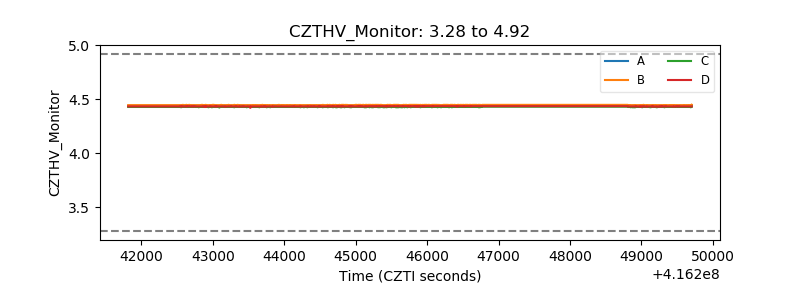 |
| D_VDD | 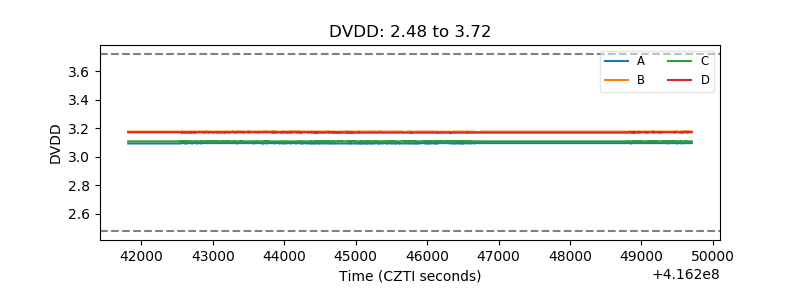 |
| Temperature 1 | 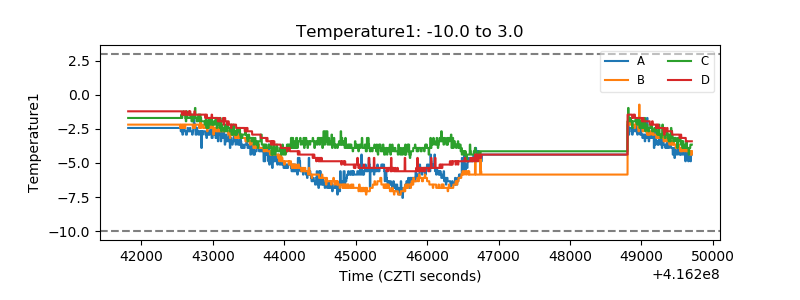 |
| Veto HV Monitor | 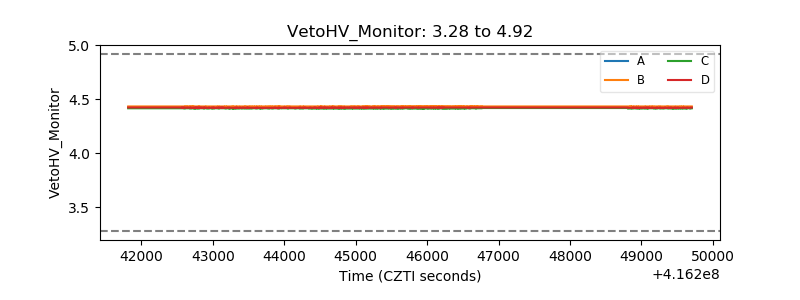 |
| Veto LLD | 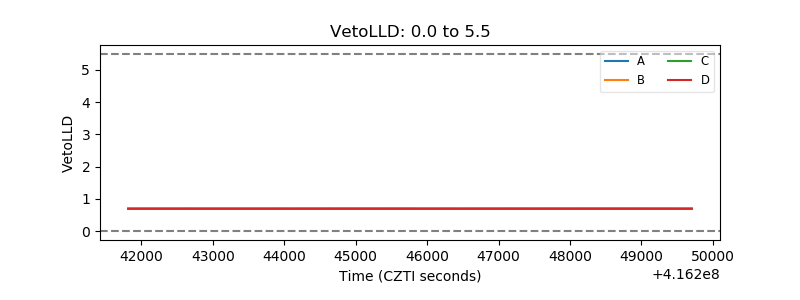 |
| Alpha Counter | 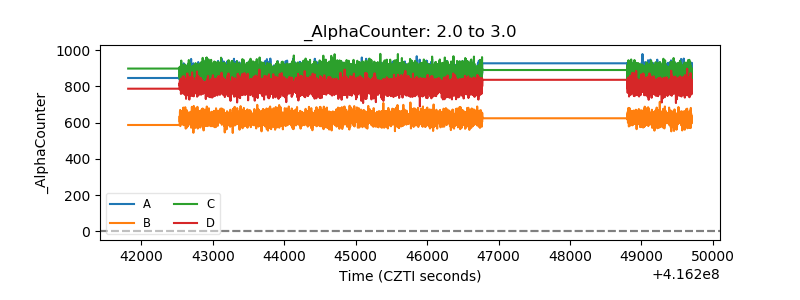 |
| _CPM_Rate | 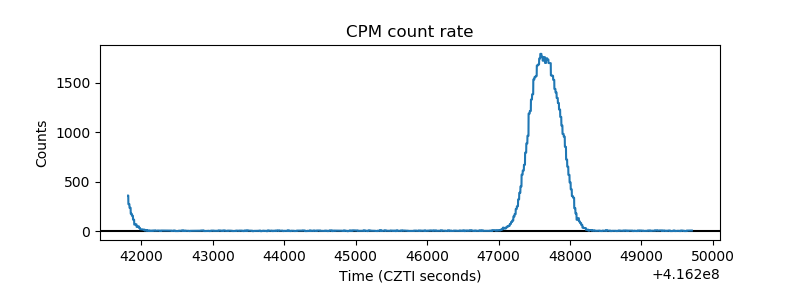 |
| CZT Counter | 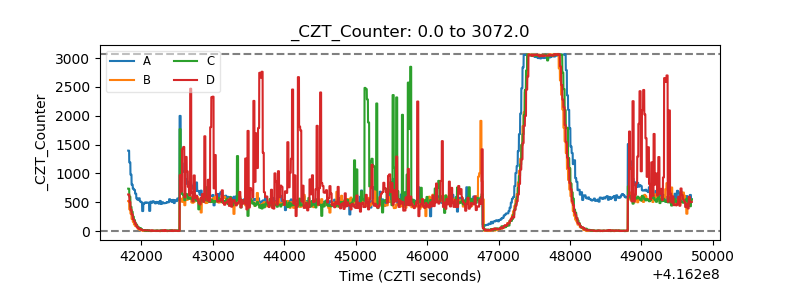 |
| +2.5 Volts monitor | 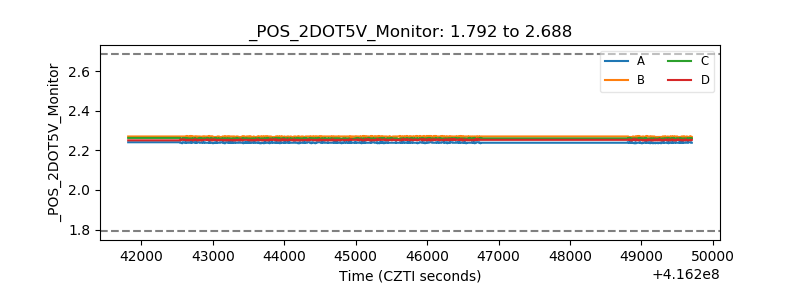 |
| +5 Volts monitor | 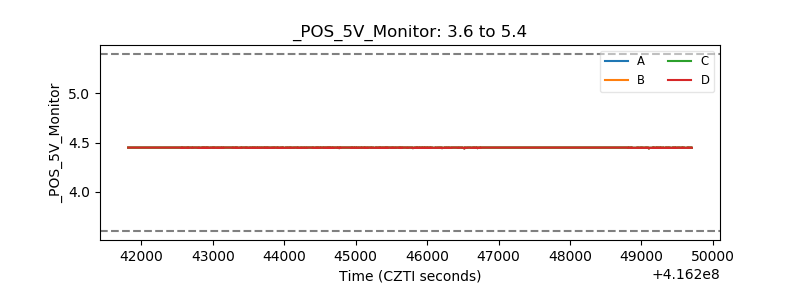 |
| _ROLL_ROT | 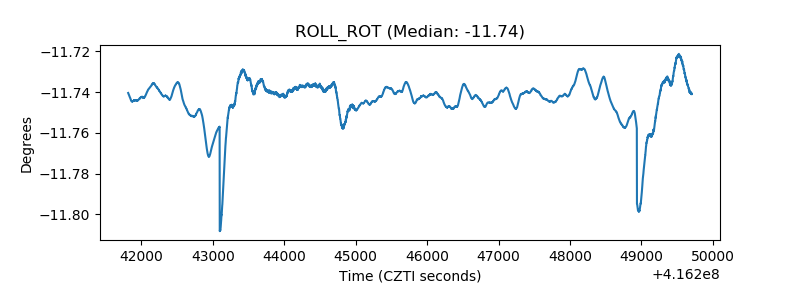 |
| _Roll_DEC | 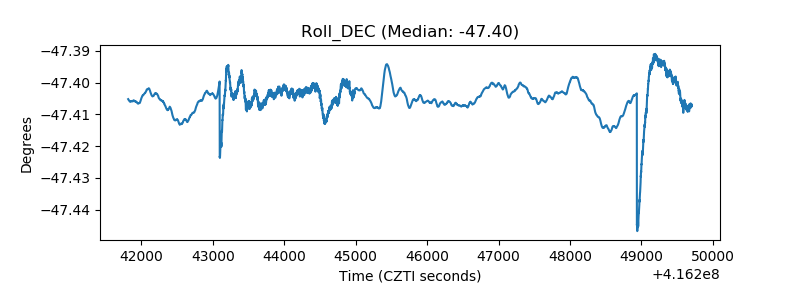 |
| _Roll_RA | 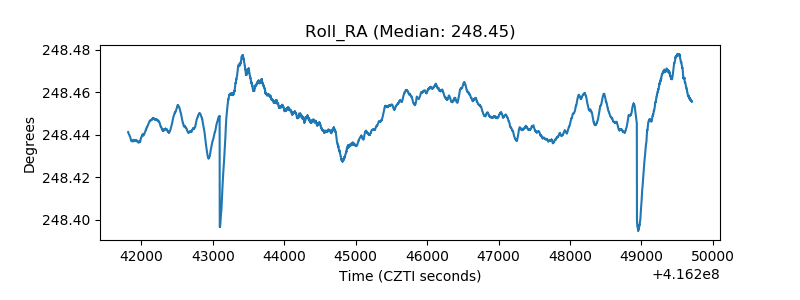 |
| Veto Counter | 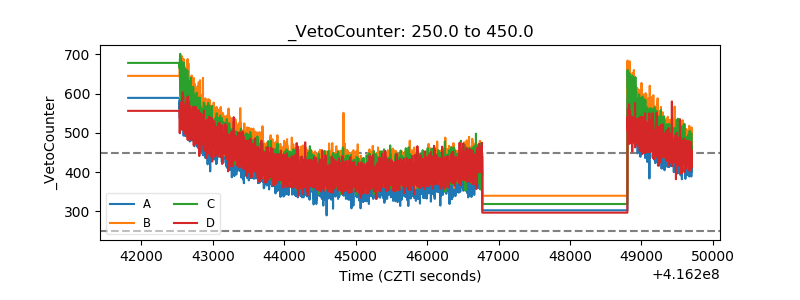 |