| Param | Original file | Final file |
|---|---|---|
| Filename | modeM0/AS1A12_056T02_9000005538_40287cztM0_level2.fits | modeM0/AS1A12_056T02_9000005538_40287cztM0_level2_quad_clean.evt |
| Size (bytes) | 324,138,240 | 92,707,200 |
| Size | 309.1 MB | 88.4 MB |
| Events in quadrant A | 3,088,568 | 641,232 |
| Events in quadrant B | 2,584,211 | 662,585 |
| Events in quadrant C | 2,499,748 | 619,868 |
| Events in quadrant D | 3,447,181 | 542,436 |
| Mode M0 | |||
|---|---|---|---|
| Quadrant | BADHDUFLAG | Total packets | Discarded packets |
| A | 0 | 12181 | 3 |
| B | 0 | 10600 | 2 |
| C | 0 | 10114 | 2 |
| D | 0 | 13597 | 2 |
| Mode M9 | |||
|---|---|---|---|
| Quadrant | BADHDUFLAG | Total packets | Discarded packets |
| A | 0 | 26 | 0 |
| B | 0 | 26 | 0 |
| C | 0 | 26 | 0 |
| D | 0 | 27 | 0 |
| Mode SS | |||
|---|---|---|---|
| Quadrant | BADHDUFLAG | Total packets | Discarded packets |
| A | 0 | 100 | 0 |
| B | 0 | 100 | 0 |
| C | 0 | 100 | 0 |
| D | 0 | 100 | 0 |
| Quadrant | Total seconds | Saturated seconds | Saturation percentage |
|---|---|---|---|
| A | 4862 | 92 | 1.892225% |
| B | 4862 | 23 | 0.473056% |
| C | 4862 | 11 | 0.226244% |
| D | 4862 | 295 | 6.067462% |
Noise dominated data is calculated using 1-second bins in cleaned event files. If a bin has >2000 counts, and if more than 50% of those come from <1% of pixels, then it is considered to be noise-dominated and hence unusable.
| Quadrant | # 1 sec bins | Bins with >0 counts | Bins with >2000 counts | High rate bins dominated by noise | Noise dominated (total time) | Noise dominated (detector-on time) | Marked lightcurve |
|---|---|---|---|---|---|---|---|
| A | 6984 | 4863 | 64 | 64 | 0.92% | 1.32% | 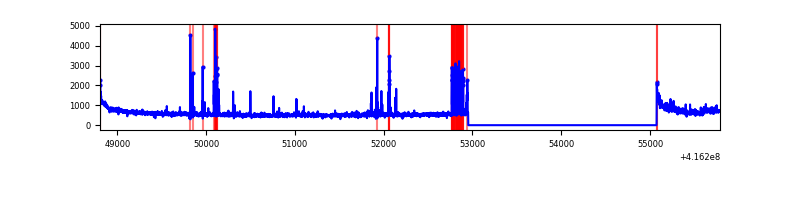 |
| B | 6984 | 4863 | 14 | 14 | 0.20% | 0.29% | 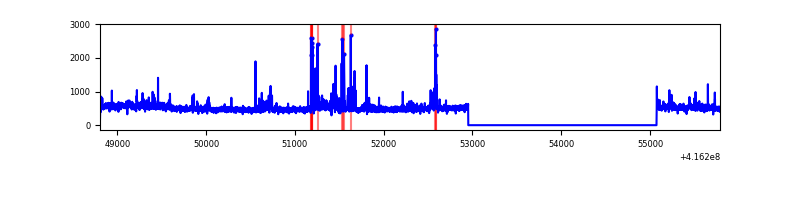 |
| C | 6984 | 4863 | 6 | 6 | 0.09% | 0.12% |  |
| D | 6984 | 4863 | 254 | 254 | 3.64% | 5.22% | 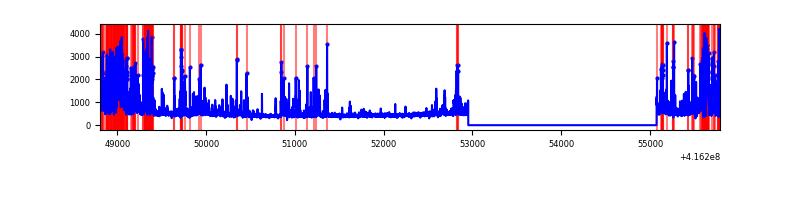 |
Top three noisy pixels from each quadrant. If the there are fewer than three noisy pixels in the level2.evt file, extra rows are filled as -1
| Pixel properties | Quadrant properties | ||||||
|---|---|---|---|---|---|---|---|
| Quadrant | DetID | PixID | Counts | Sigma | Mean | Median | Sigma |
| A | 10 | 83 | 459025 | 3864.25 | 585 | 576 | 118.6 |
| A | 6 | 10 | 263223 | 2213.84 | 585 | 576 | 118.6 |
| A | 13 | 248 | 46676 | 388.57 | 585 | 576 | 118.6 |
| B | 5 | 255 | 122430 | 1103.38 | 586 | 573 | 110.4 |
| B | 0 | 245 | 65478 | 587.69 | 586 | 573 | 110.4 |
| B | 4 | 171 | 49806 | 445.79 | 586 | 573 | 110.4 |
| C | 15 | 214 | 207269 | 1578.54 | 567 | 572 | 130.9 |
| C | 14 | 254 | 58265 | 440.6 | 567 | 572 | 130.9 |
| C | 0 | 10 | 16994 | 125.41 | 567 | 572 | 130.9 |
| D | 12 | 227 | 547949 | 4107.5 | 548 | 534 | 133.3 |
| D | 2 | 250 | 448889 | 3364.21 | 548 | 534 | 133.3 |
| D | 12 | 233 | 115150 | 860.01 | 548 | 534 | 133.3 |
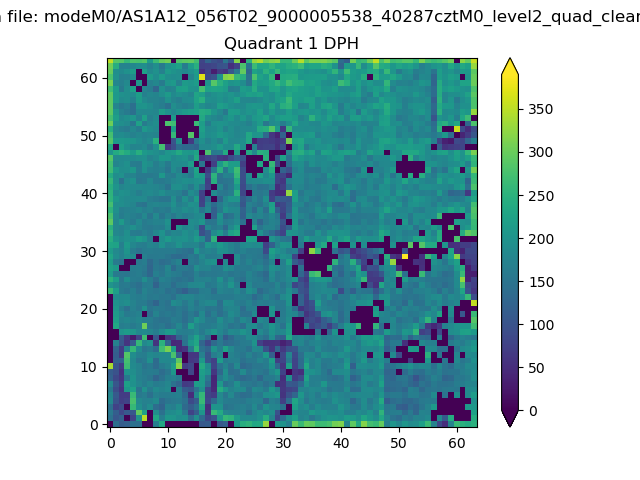
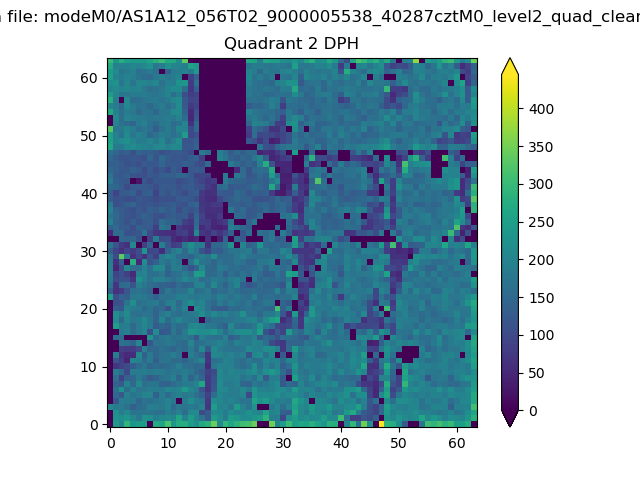
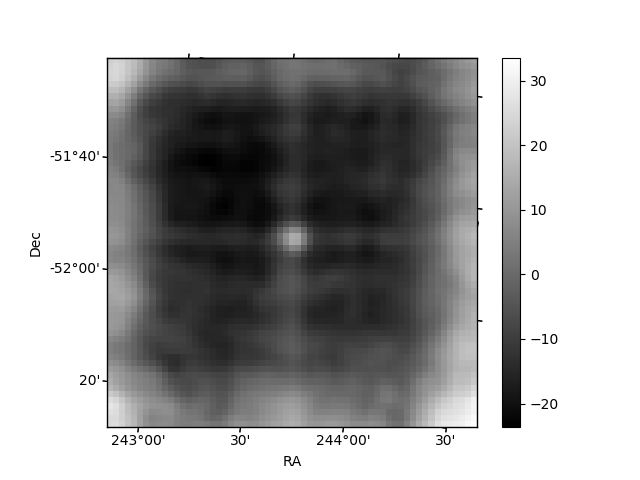
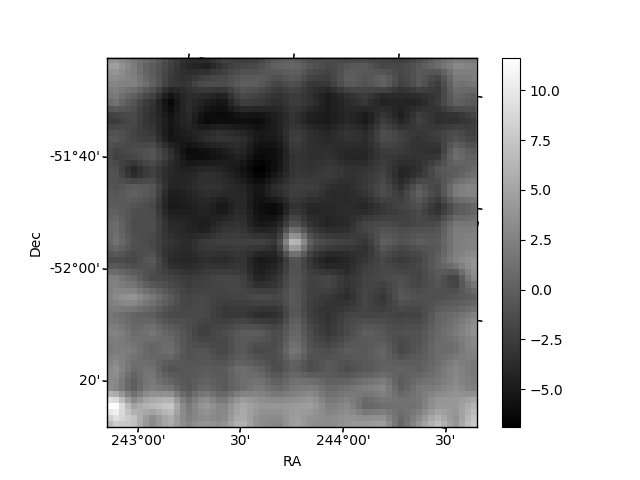
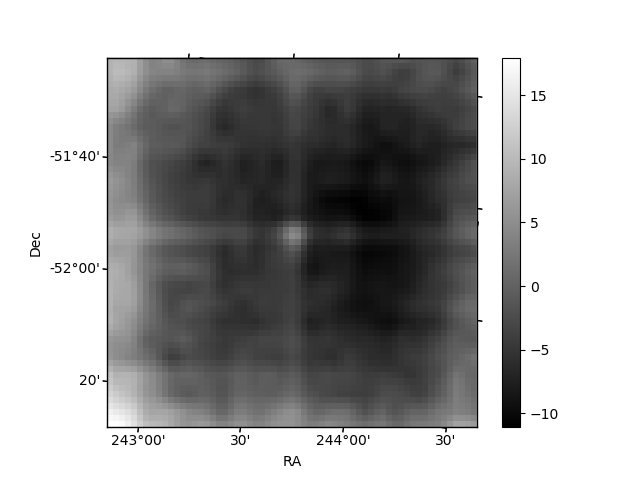
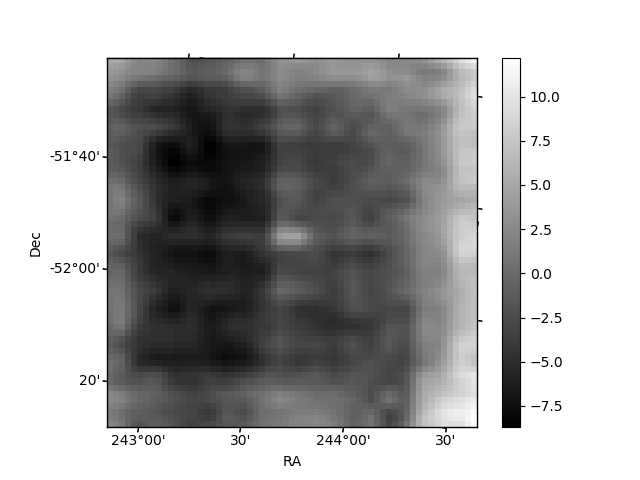
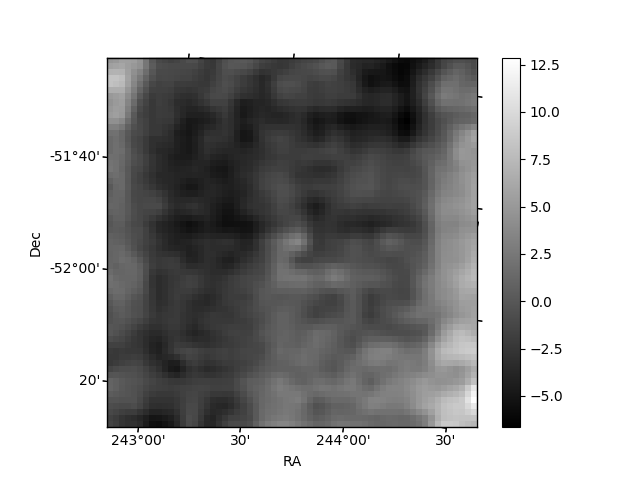
Histogram calculated using DETX and DETY for each event in the final _common_clean file
| Quadrant A | 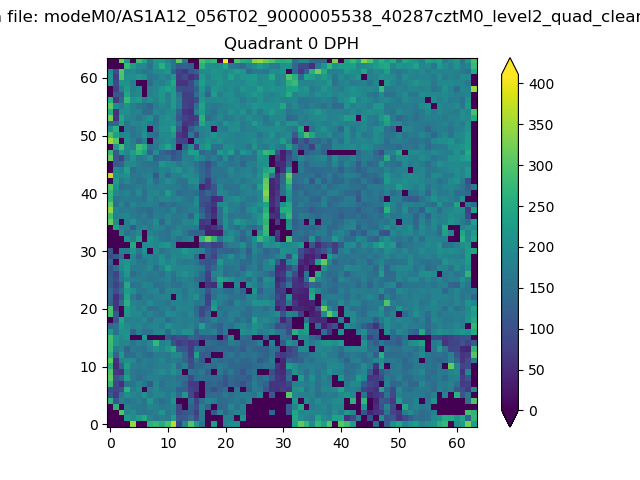 |
 |
Quadrant B |
|---|---|---|---|
| Quadrant D | 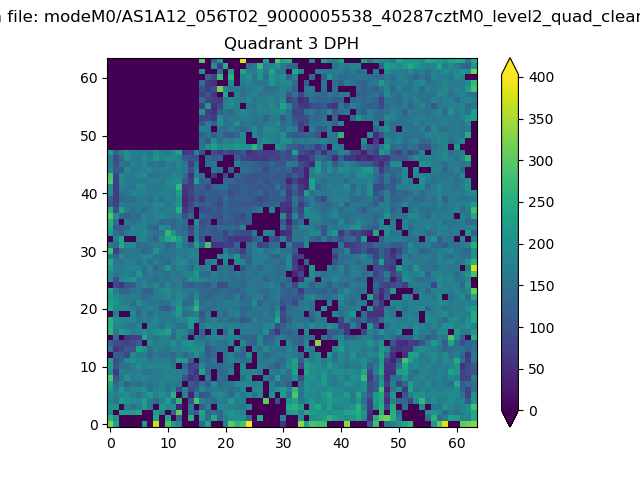 |
 |
Quadrant C |
| Plot type | Count rate plots | Images |
|---|---|---|
| Comparison with Poisson distribution Blue bars denote a histogram of data divided into 1 sec bins. Red curve is a Poisson curve with rate = median count rate of data. |
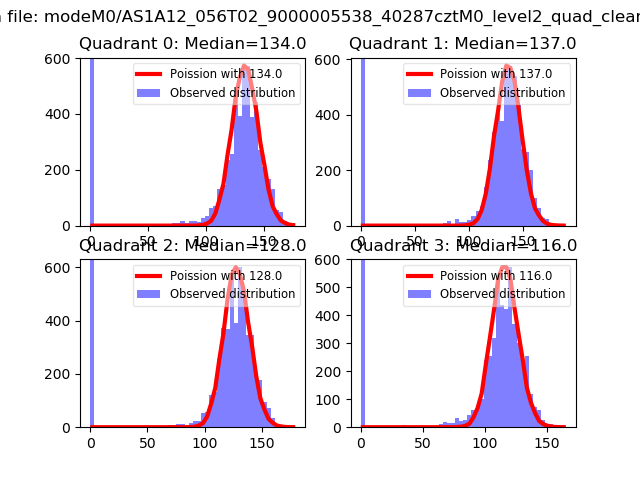 |
 |
| Quadrant-wise count rates Data is divided into 100 sec bins |
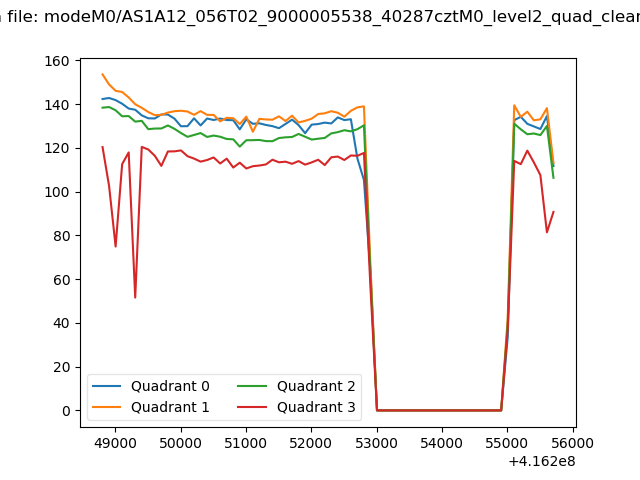 |
|
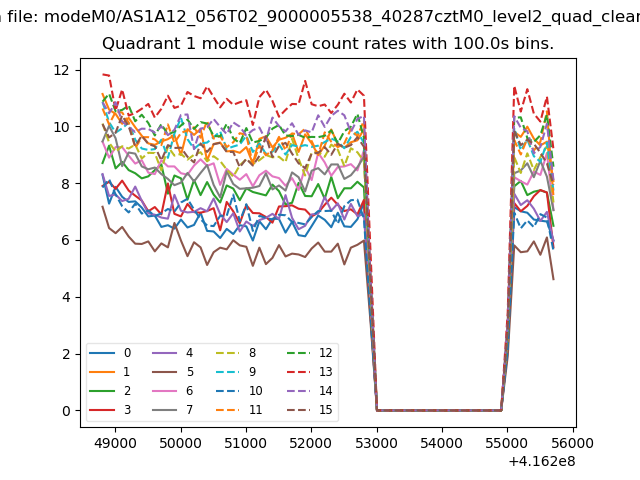
| Module-wise count rates for Quadrant A Data is divided into 100 sec bins |
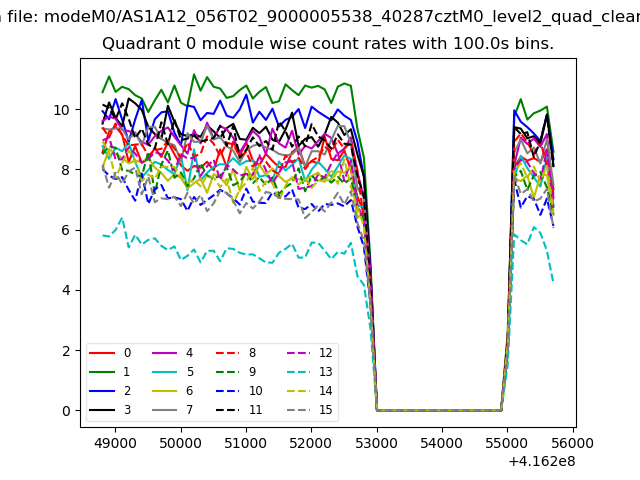 |
 |
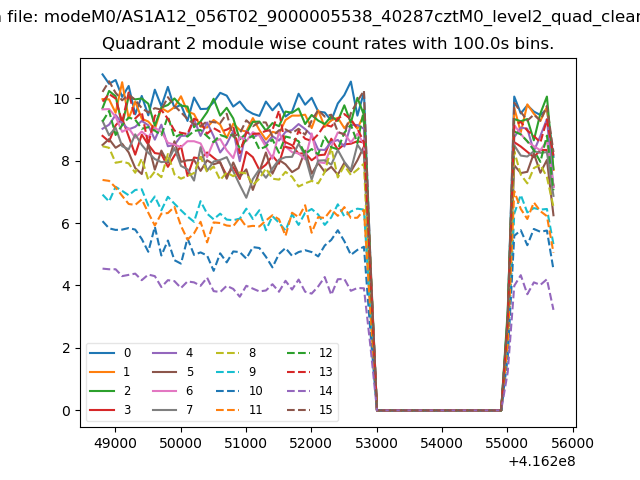
| Module-wise count rates for Quadrant B Data is divided into 100 sec bins |
 |
 |
| Module-wise count rates for Quadrant C Data is divided into 100 sec bins |
 |
 |
| Module-wise count rates for Quadrant D Data is divided into 100 sec bins |
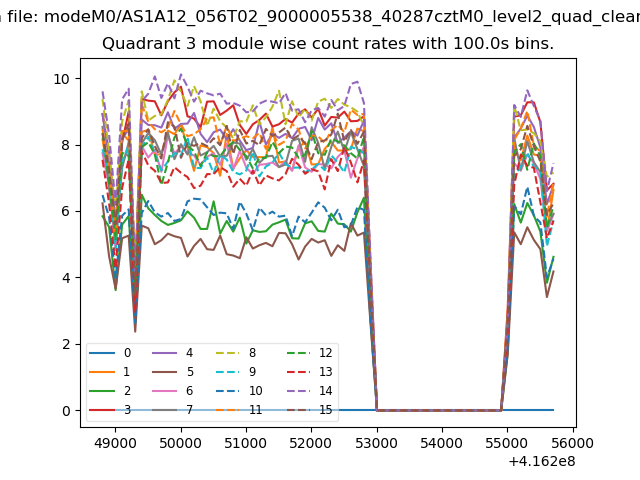 |
 |
| Parameter | Plot |
|---|---|
| CZT HV Monitor | 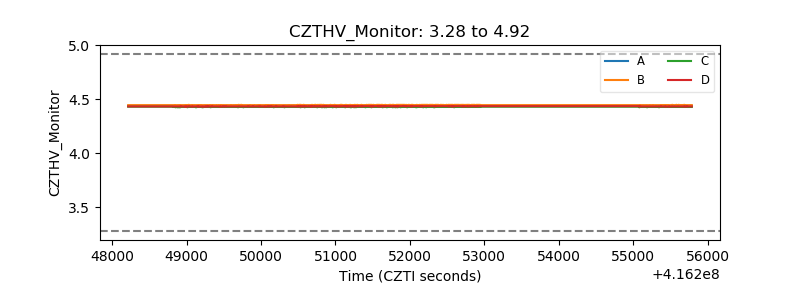 |
| D_VDD | 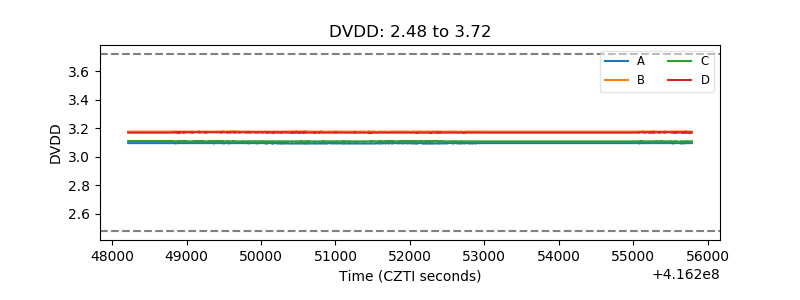 |
| Temperature 1 |  |
| Veto HV Monitor | 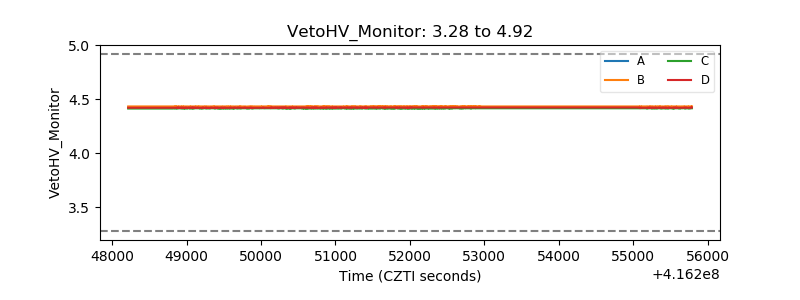 |
| Veto LLD | 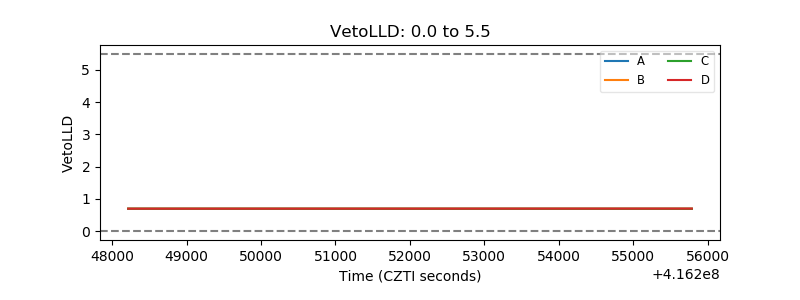 |
| Alpha Counter | 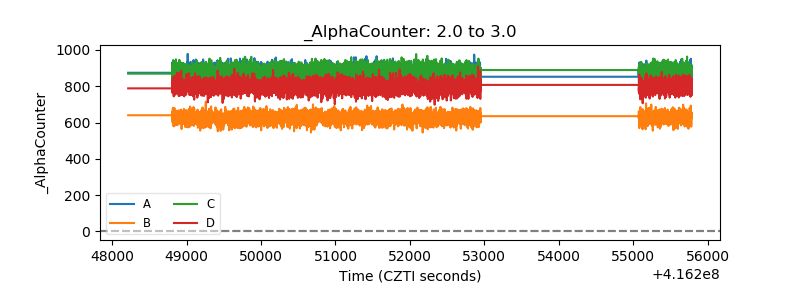 |
| _CPM_Rate | 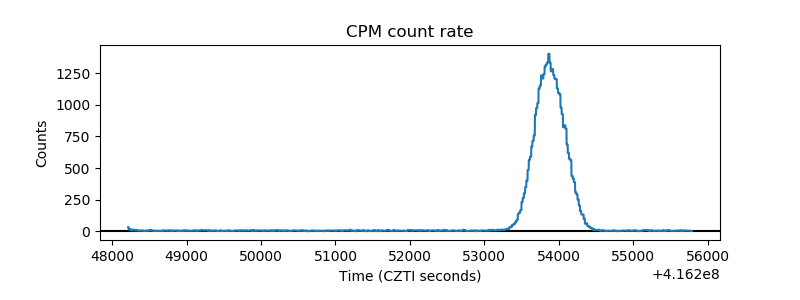 |
| CZT Counter | 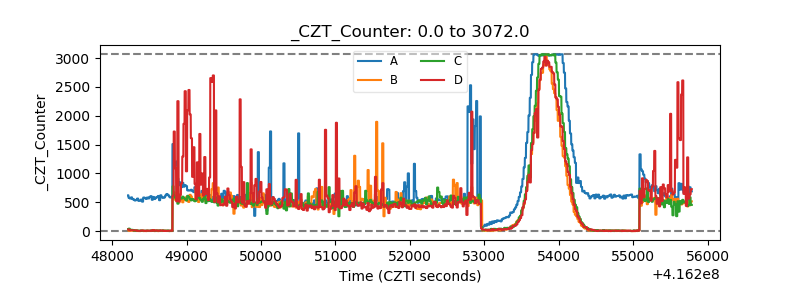 |
| +2.5 Volts monitor | 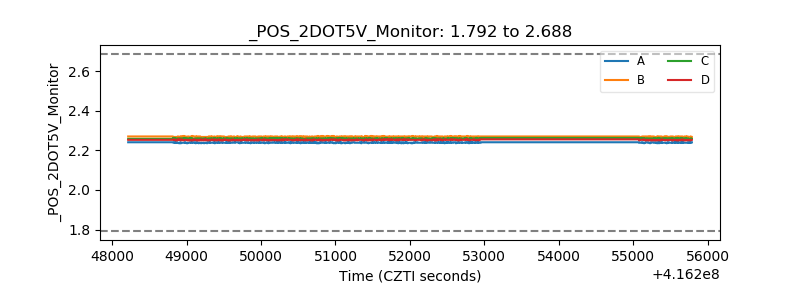 |
| +5 Volts monitor | 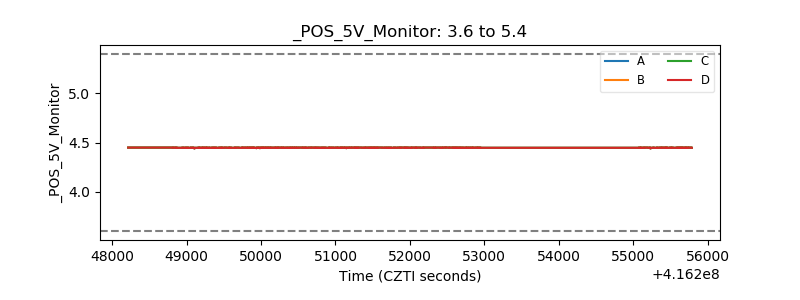 |
| _ROLL_ROT | 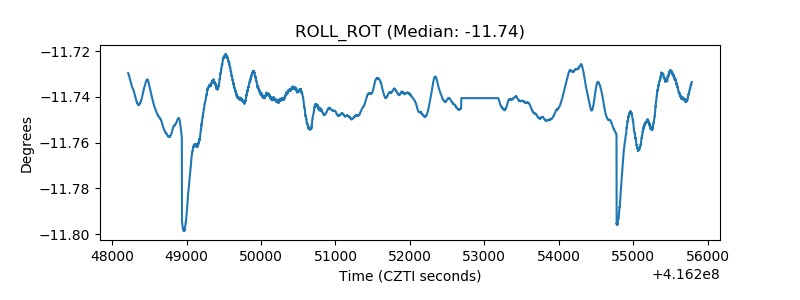 |
| _Roll_DEC | 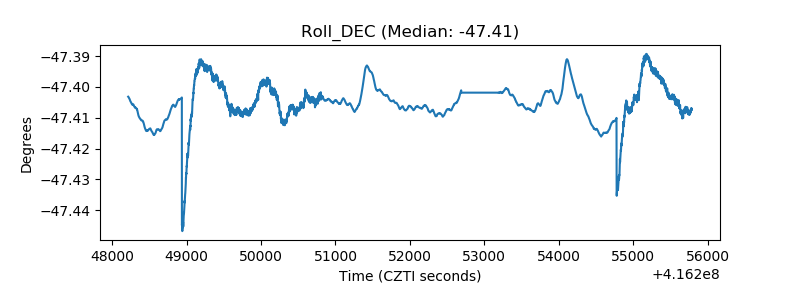 |
| _Roll_RA | 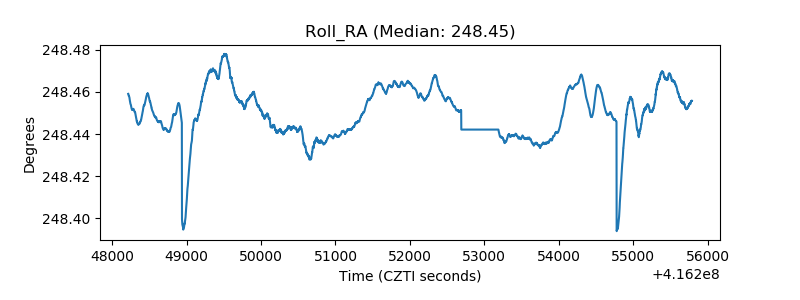 |
| Veto Counter | 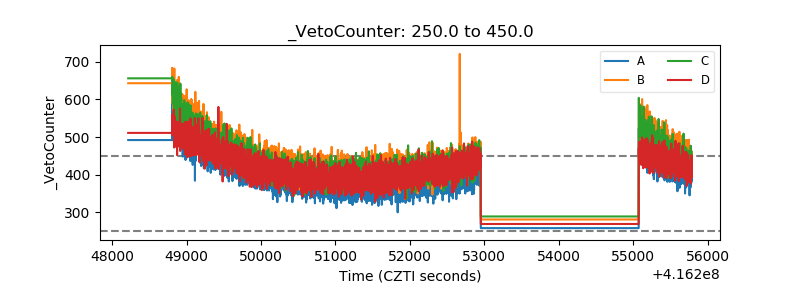 |