| Param | Original file | Final file |
|---|---|---|
| Filename | modeM0/AS1A12_056T02_9000005538_40288cztM0_level2.fits | modeM0/AS1A12_056T02_9000005538_40288cztM0_level2_quad_clean.evt |
| Size (bytes) | 317,459,520 | 89,562,240 |
| Size | 302.8 MB | 85.4 MB |
| Events in quadrant A | 3,436,177 | 616,425 |
| Events in quadrant B | 2,336,478 | 634,685 |
| Events in quadrant C | 2,553,976 | 593,522 |
| Events in quadrant D | 3,048,881 | 528,783 |
| Mode M0 | |||
|---|---|---|---|
| Quadrant | BADHDUFLAG | Total packets | Discarded packets |
| A | 0 | 13390 | 3 |
| B | 0 | 9963 | 2 |
| C | 0 | 10386 | 2 |
| D | 0 | 12409 | 2 |
| Mode M9 | |||
|---|---|---|---|
| Quadrant | BADHDUFLAG | Total packets | Discarded packets |
| A | 0 | 39 | 0 |
| B | 0 | 39 | 0 |
| C | 0 | 39 | 0 |
| D | 0 | 40 | 0 |
| Mode SS | |||
|---|---|---|---|
| Quadrant | BADHDUFLAG | Total packets | Discarded packets |
| A | 0 | 100 | 0 |
| B | 0 | 100 | 0 |
| C | 0 | 100 | 0 |
| D | 0 | 100 | 0 |
| Quadrant | Total seconds | Saturated seconds | Saturation percentage |
|---|---|---|---|
| A | 4823 | 48 | 0.995231% |
| B | 4823 | 13 | 0.269542% |
| C | 4823 | 28 | 0.580552% |
| D | 4823 | 197 | 4.084595% |
Noise dominated data is calculated using 1-second bins in cleaned event files. If a bin has >2000 counts, and if more than 50% of those come from <1% of pixels, then it is considered to be noise-dominated and hence unusable.
| Quadrant | # 1 sec bins | Bins with >0 counts | Bins with >2000 counts | High rate bins dominated by noise | Noise dominated (total time) | Noise dominated (detector-on time) | Marked lightcurve |
|---|---|---|---|---|---|---|---|
| A | 6947 | 4824 | 31 | 31 | 0.45% | 0.64% | 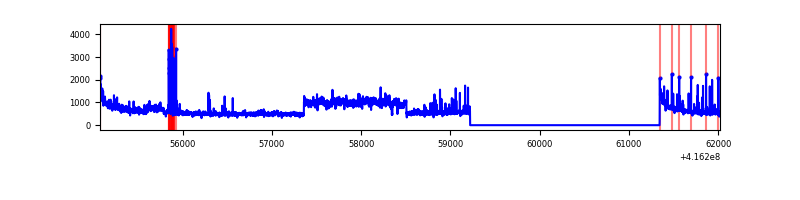 |
| B | 6947 | 4824 | 4 | 4 | 0.06% | 0.08% | 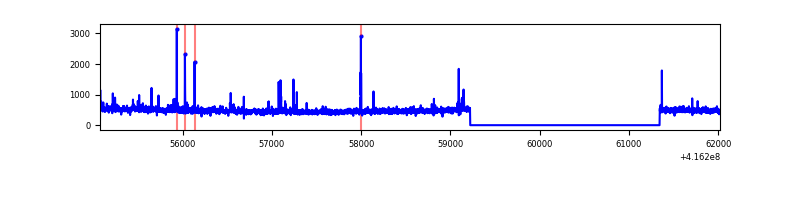 |
| C | 6947 | 4824 | 22 | 22 | 0.32% | 0.46% | 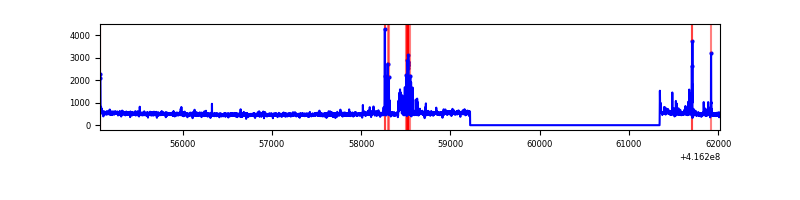 |
| D | 6947 | 4824 | 180 | 180 | 2.59% | 3.73% | 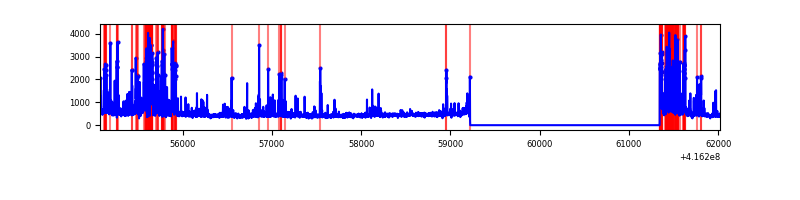 |
Top three noisy pixels from each quadrant. If the there are fewer than three noisy pixels in the level2.evt file, extra rows are filled as -1
| Pixel properties | Quadrant properties | ||||||
|---|---|---|---|---|---|---|---|
| Quadrant | DetID | PixID | Counts | Sigma | Mean | Median | Sigma |
| A | 6 | 10 | 667949 | 5852.31 | 560 | 552 | 114.0 |
| A | 10 | 83 | 445013 | 3897.41 | 560 | 552 | 114.0 |
| A | 13 | 248 | 93220 | 812.59 | 560 | 552 | 114.0 |
| B | 4 | 171 | 49611 | 454.19 | 563 | 549 | 108.0 |
| B | 0 | 245 | 42605 | 389.34 | 563 | 549 | 108.0 |
| B | 5 | 255 | 18657 | 167.64 | 563 | 549 | 108.0 |
| C | 15 | 214 | 206612 | 1612.7 | 548 | 552 | 127.8 |
| C | 14 | 254 | 167027 | 1302.89 | 548 | 552 | 127.8 |
| C | 3 | 233 | 25252 | 193.31 | 548 | 552 | 127.8 |
| D | 1 | 47 | 318552 | 2429.38 | 532 | 519 | 130.9 |
| D | 2 | 250 | 255995 | 1951.52 | 532 | 519 | 130.9 |
| D | 12 | 233 | 180303 | 1373.33 | 532 | 519 | 130.9 |
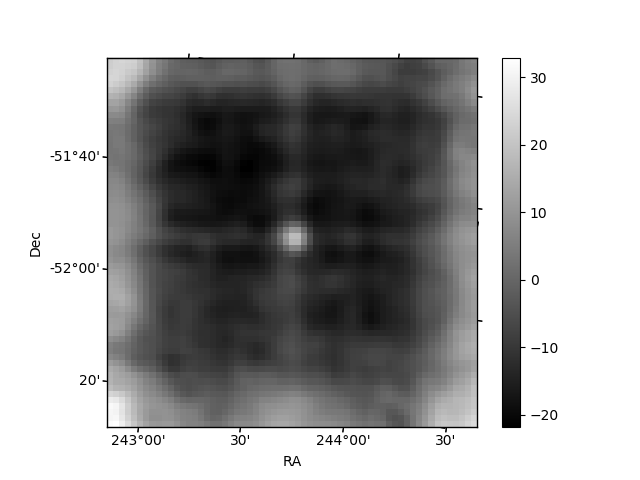
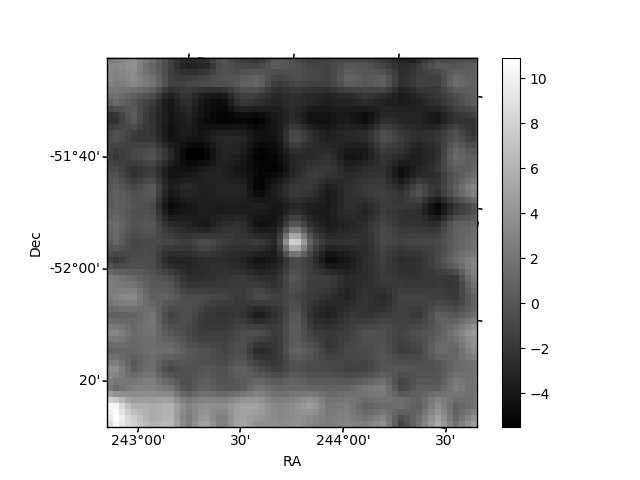
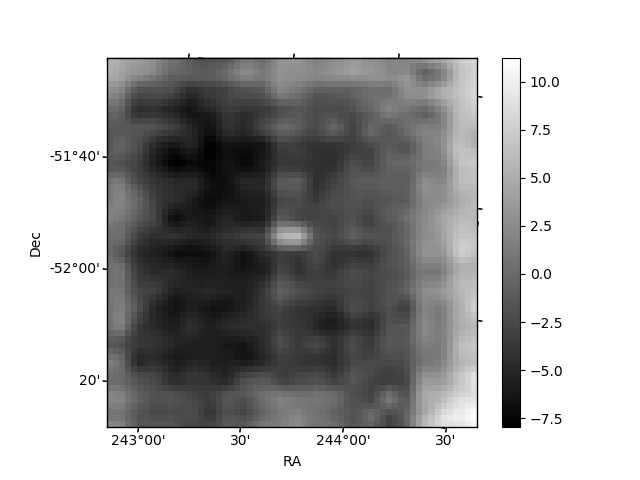
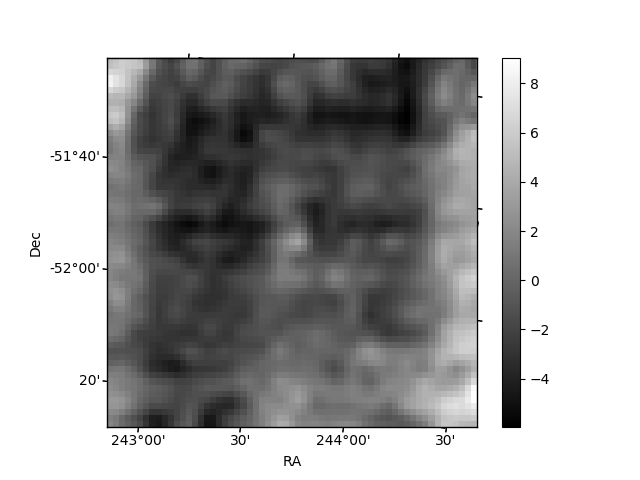
Histogram calculated using DETX and DETY for each event in the final _common_clean file
| Quadrant A | 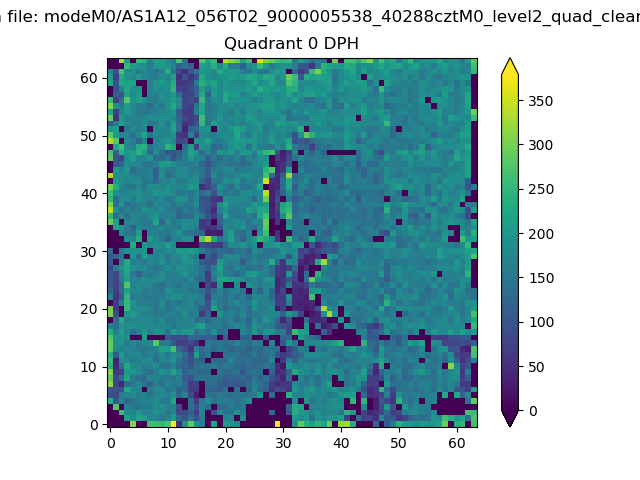 |
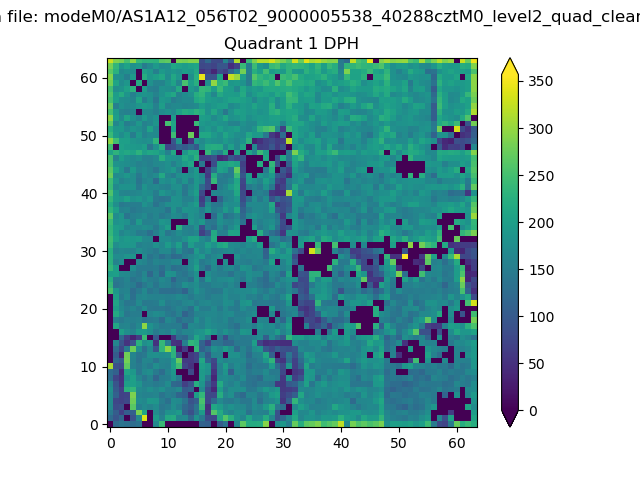 |
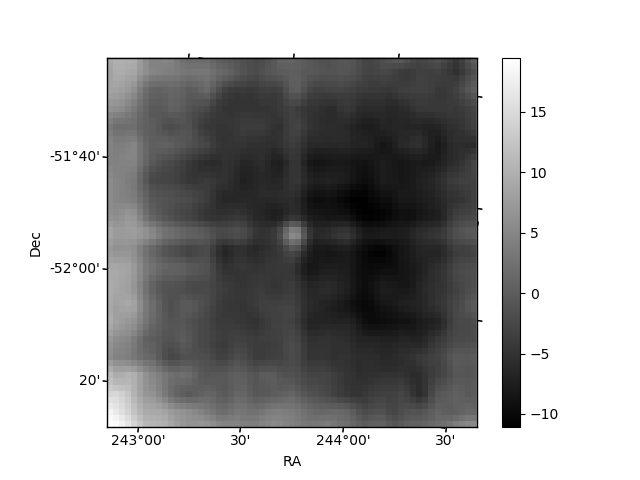
Quadrant B |
|---|---|---|---|
| Quadrant D | 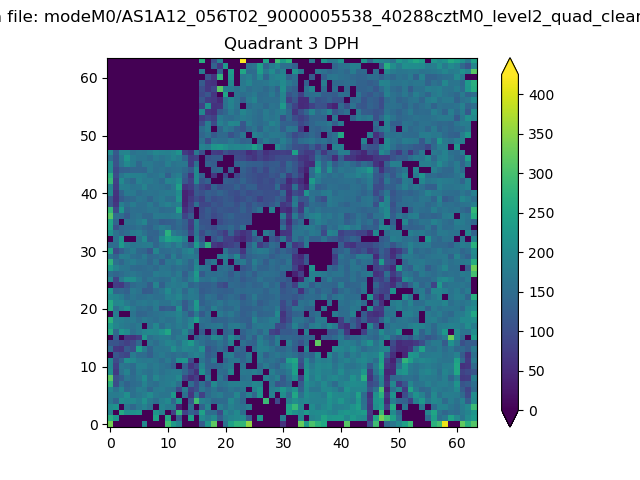 |
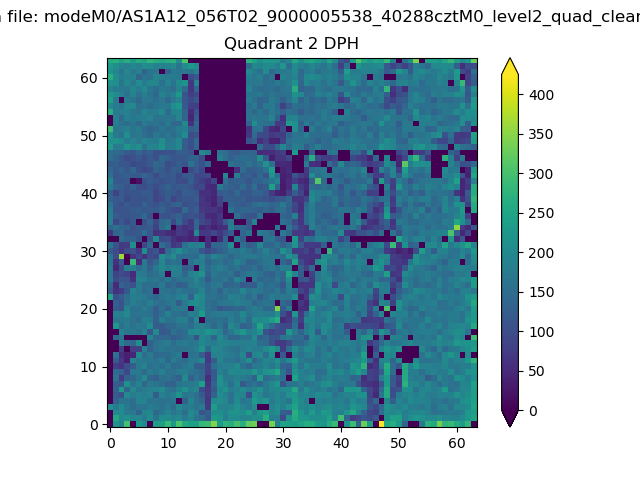 |
Quadrant C |
| Plot type | Count rate plots | Images |
|---|---|---|
| Comparison with Poisson distribution Blue bars denote a histogram of data divided into 1 sec bins. Red curve is a Poisson curve with rate = median count rate of data. |
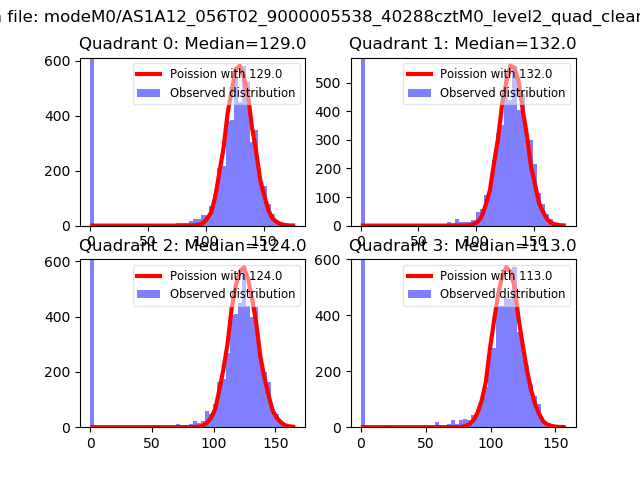 |
 |
| Quadrant-wise count rates Data is divided into 100 sec bins |
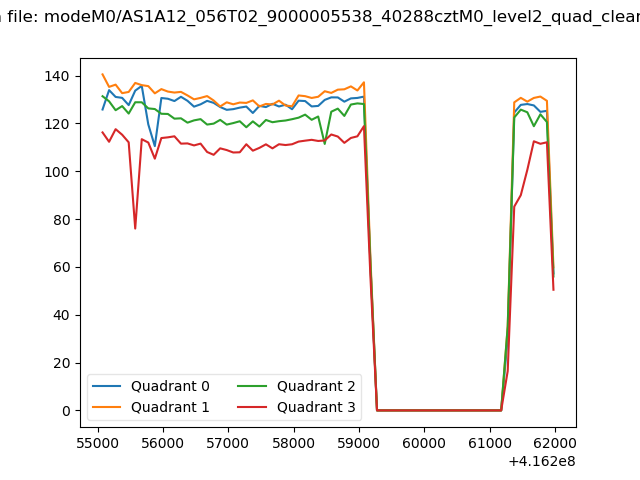 |
|
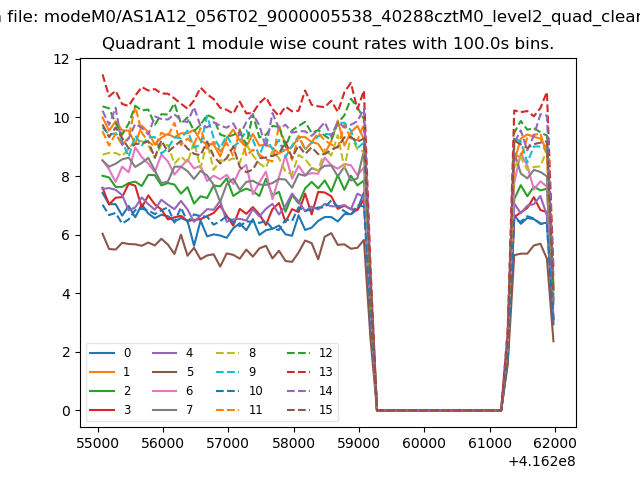
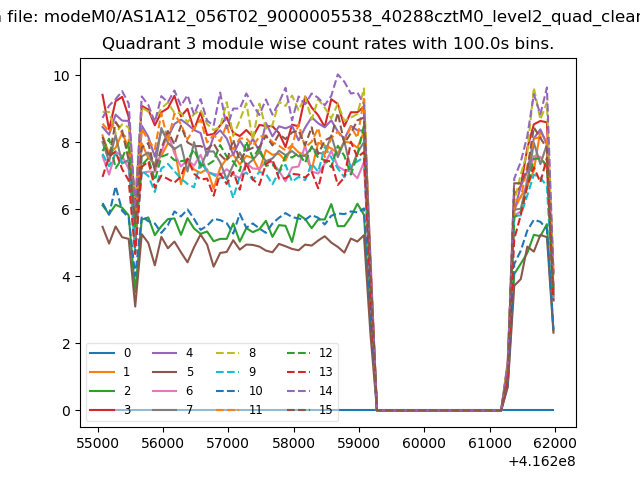
| Module-wise count rates for Quadrant A Data is divided into 100 sec bins |
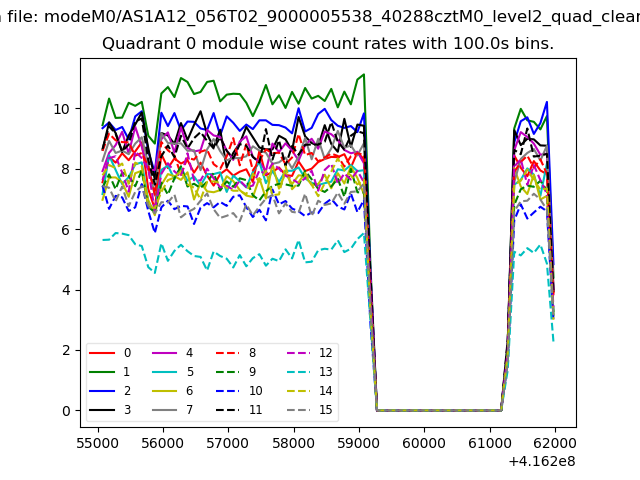 |
 |
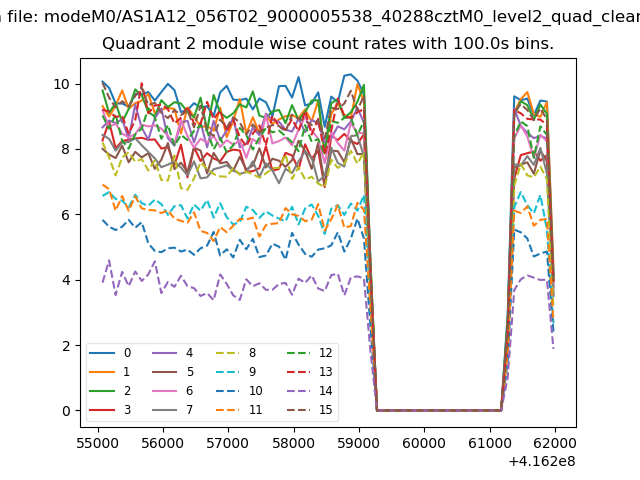
| Module-wise count rates for Quadrant B Data is divided into 100 sec bins |
 |
 |
| Module-wise count rates for Quadrant C Data is divided into 100 sec bins |
 |
 |
| Module-wise count rates for Quadrant D Data is divided into 100 sec bins |
 |
 |
| Parameter | Plot |
|---|---|
| CZT HV Monitor | 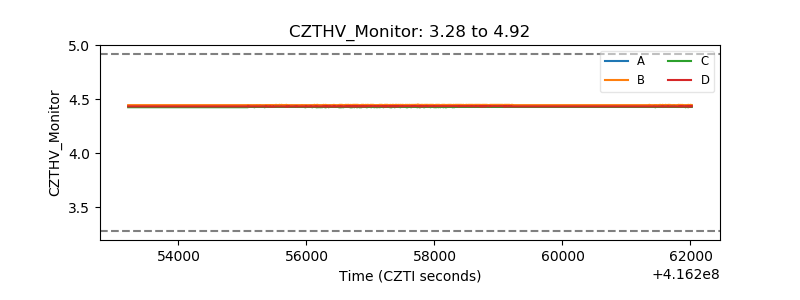 |
| D_VDD | 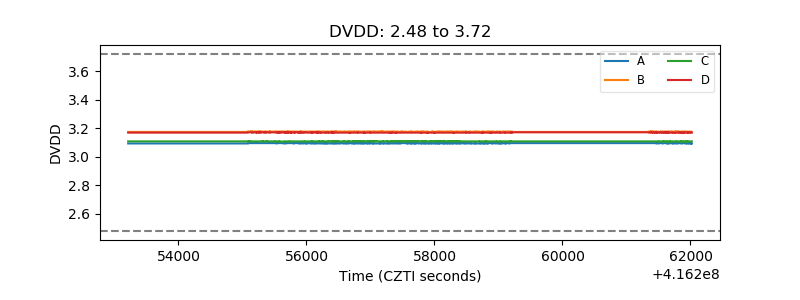 |
| Temperature 1 | 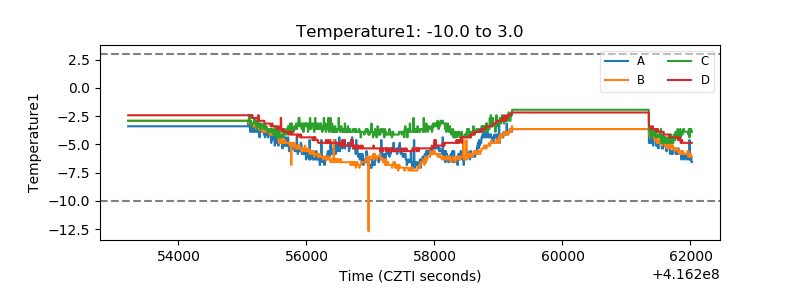 |
| Veto HV Monitor | 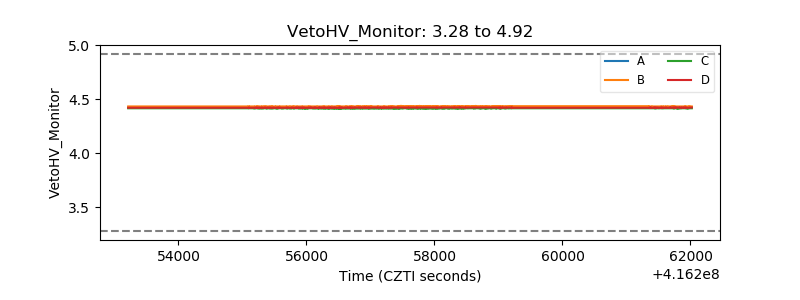 |
| Veto LLD | 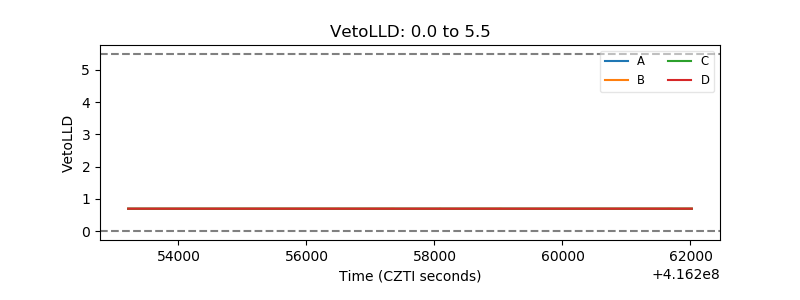 |
| Alpha Counter | 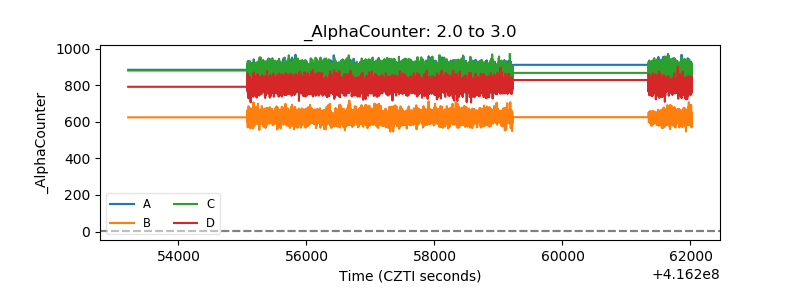 |
| _CPM_Rate |  |
| CZT Counter | 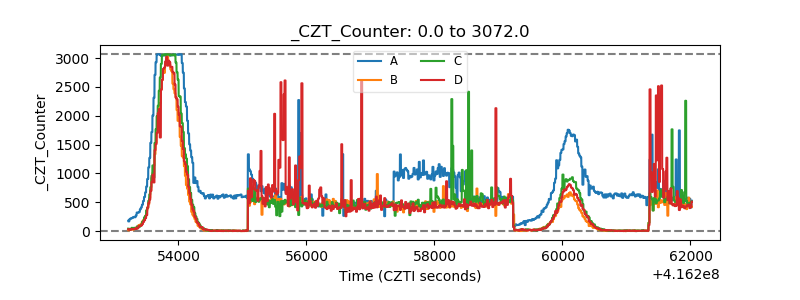 |
| +2.5 Volts monitor | 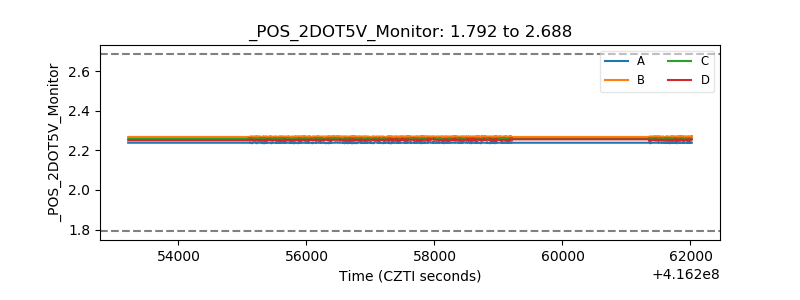 |
| +5 Volts monitor | 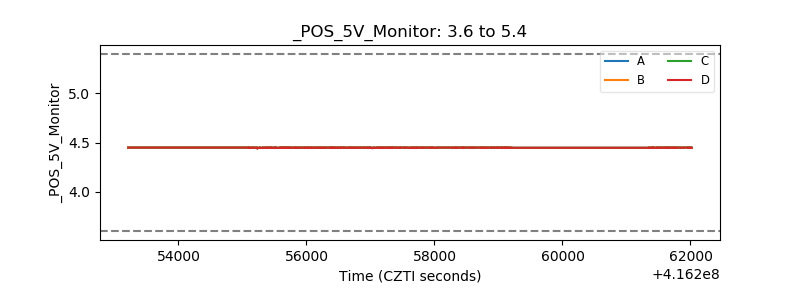 |
| _ROLL_ROT | 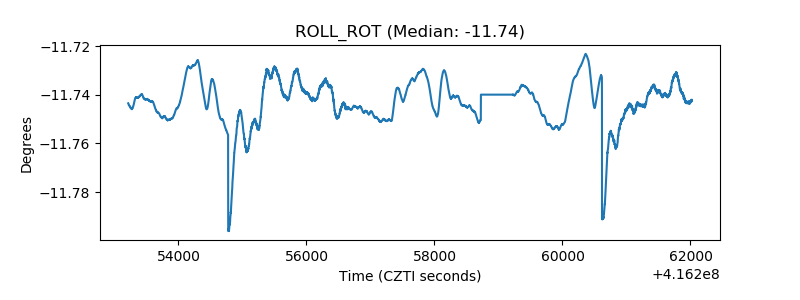 |
| _Roll_DEC | 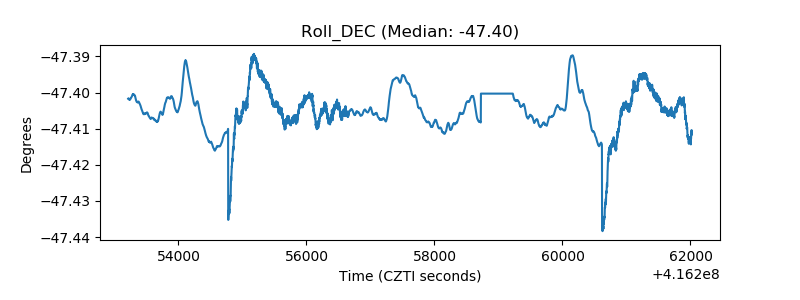 |
| _Roll_RA | 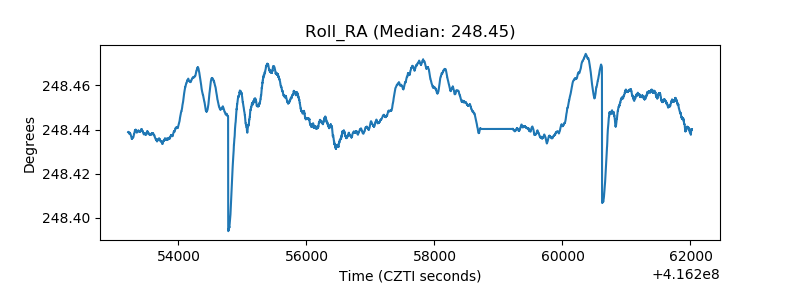 |
| Veto Counter | 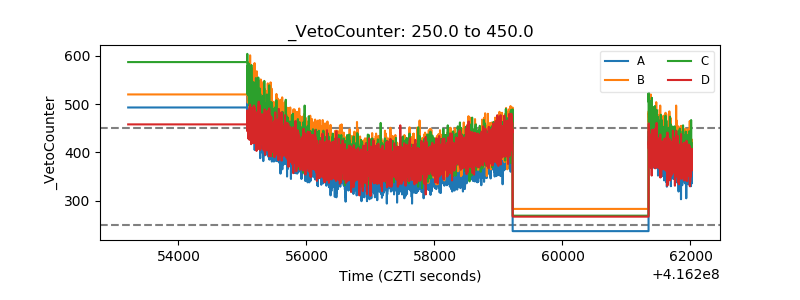 |