| Param | Original file | Final file |
|---|---|---|
| Filename | modeM0/AS1A12_056T02_9000005538_40289cztM0_level2.fits | modeM0/AS1A12_056T02_9000005538_40289cztM0_level2_quad_clean.evt |
| Size (bytes) | 345,162,240 | 88,254,720 |
| Size | 329.2 MB | 84.2 MB |
| Events in quadrant A | 2,896,413 | 611,491 |
| Events in quadrant B | 2,374,185 | 628,606 |
| Events in quadrant C | 3,106,896 | 578,795 |
| Events in quadrant D | 4,010,745 | 504,194 |
| Mode M0 | |||
|---|---|---|---|
| Quadrant | BADHDUFLAG | Total packets | Discarded packets |
| A | 0 | 11639 | 3 |
| B | 0 | 10309 | 2 |
| C | 0 | 12277 | 2 |
| D | 0 | 15389 | 2 |
| Mode M9 | |||
|---|---|---|---|
| Quadrant | BADHDUFLAG | Total packets | Discarded packets |
| A | 0 | 41 | 0 |
| B | 0 | 41 | 0 |
| C | 0 | 41 | 0 |
| D | 0 | 41 | 0 |
| Mode SS | |||
|---|---|---|---|
| Quadrant | BADHDUFLAG | Total packets | Discarded packets |
| A | 0 | 100 | 0 |
| B | 0 | 100 | 0 |
| C | 0 | 100 | 0 |
| D | 0 | 100 | 0 |
| Quadrant | Total seconds | Saturated seconds | Saturation percentage |
|---|---|---|---|
| A | 4989 | 34 | 0.681499% |
| B | 4989 | 15 | 0.300661% |
| C | 4989 | 153 | 3.066747% |
| D | 4989 | 453 | 9.079976% |
Noise dominated data is calculated using 1-second bins in cleaned event files. If a bin has >2000 counts, and if more than 50% of those come from <1% of pixels, then it is considered to be noise-dominated and hence unusable.
| Quadrant | # 1 sec bins | Bins with >0 counts | Bins with >2000 counts | High rate bins dominated by noise | Noise dominated (total time) | Noise dominated (detector-on time) | Marked lightcurve |
|---|---|---|---|---|---|---|---|
| A | 7022 | 4990 | 29 | 29 | 0.41% | 0.58% | 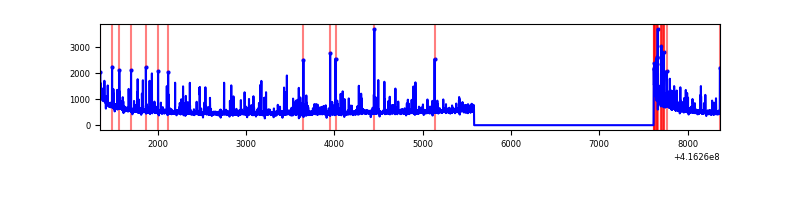 |
| B | 7022 | 4990 | 7 | 7 | 0.10% | 0.14% | 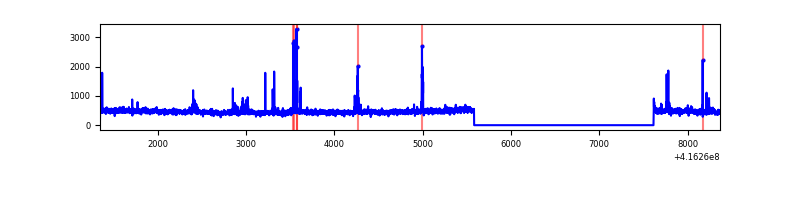 |
| C | 7022 | 4990 | 134 | 134 | 1.91% | 2.69% | 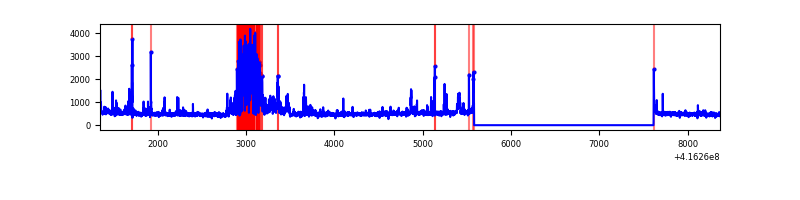 |
| D | 7022 | 4990 | 393 | 393 | 5.60% | 7.88% | 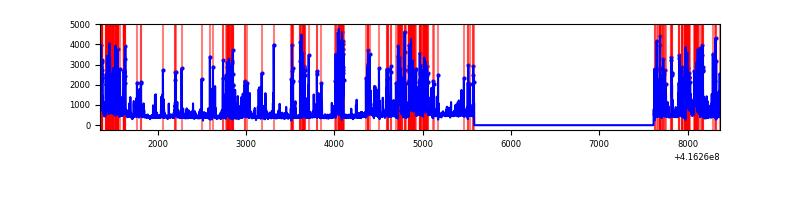 |
Top three noisy pixels from each quadrant. If the there are fewer than three noisy pixels in the level2.evt file, extra rows are filled as -1
| Pixel properties | Quadrant properties | ||||||
|---|---|---|---|---|---|---|---|
| Quadrant | DetID | PixID | Counts | Sigma | Mean | Median | Sigma |
| A | 10 | 83 | 442839 | 3826.63 | 562 | 552 | 115.6 |
| A | 6 | 10 | 145594 | 1254.89 | 562 | 552 | 115.6 |
| A | 13 | 248 | 81074 | 696.67 | 562 | 552 | 115.6 |
| B | 4 | 171 | 76760 | 697.0 | 563 | 548 | 109.3 |
| B | 5 | 255 | 53854 | 487.51 | 563 | 548 | 109.3 |
| B | 0 | 230 | 18989 | 168.65 | 563 | 548 | 109.3 |
| C | 14 | 254 | 735401 | 5677.96 | 549 | 553 | 129.4 |
| C | 15 | 214 | 211481 | 1629.78 | 549 | 553 | 129.4 |
| C | 0 | 10 | 15977 | 119.18 | 549 | 553 | 129.4 |
| D | 12 | 227 | 912752 | 7128.62 | 522 | 508 | 128.0 |
| D | 1 | 47 | 493197 | 3850.06 | 522 | 508 | 128.0 |
| D | 2 | 250 | 377972 | 2949.65 | 522 | 508 | 128.0 |
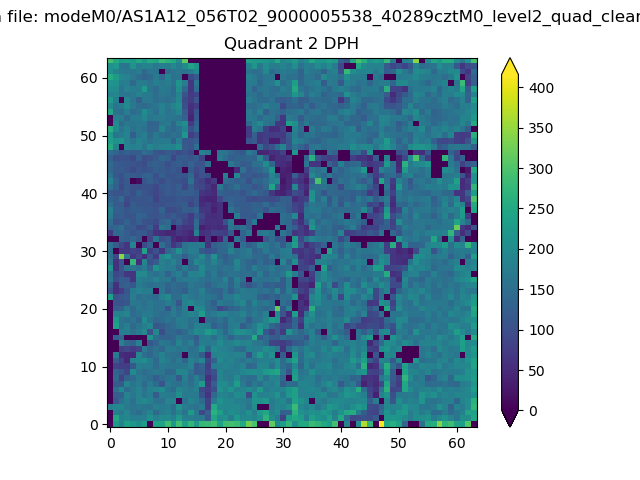
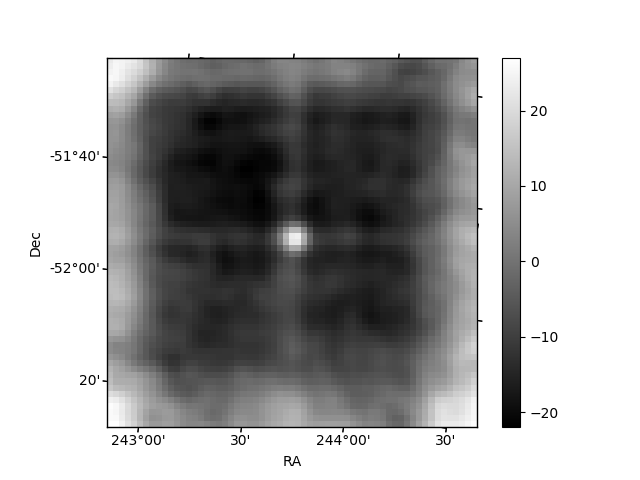
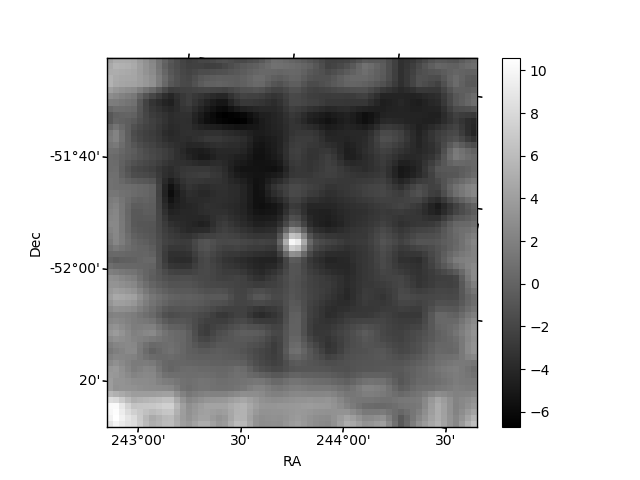
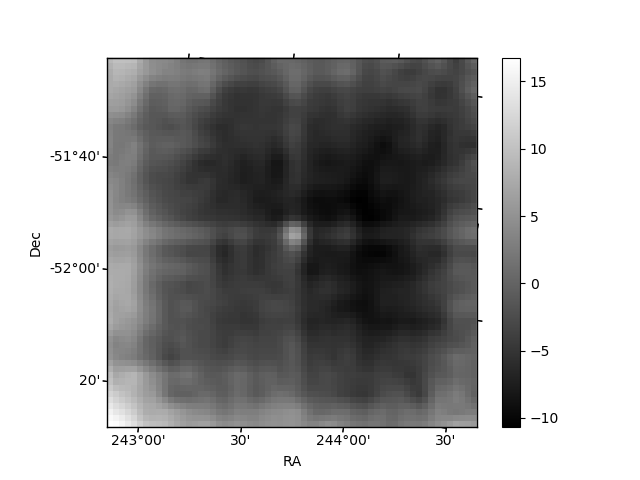
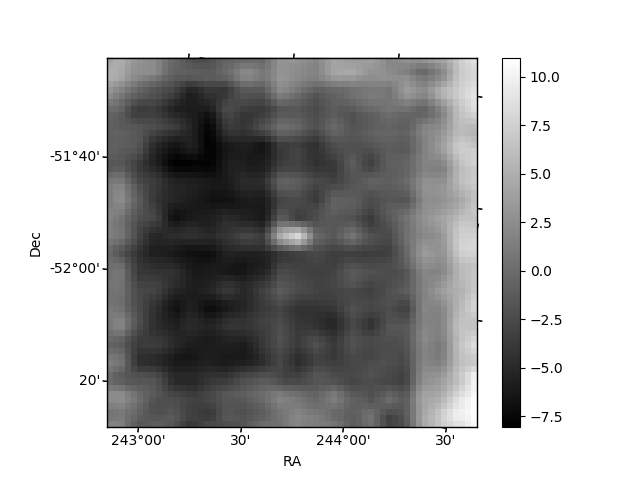
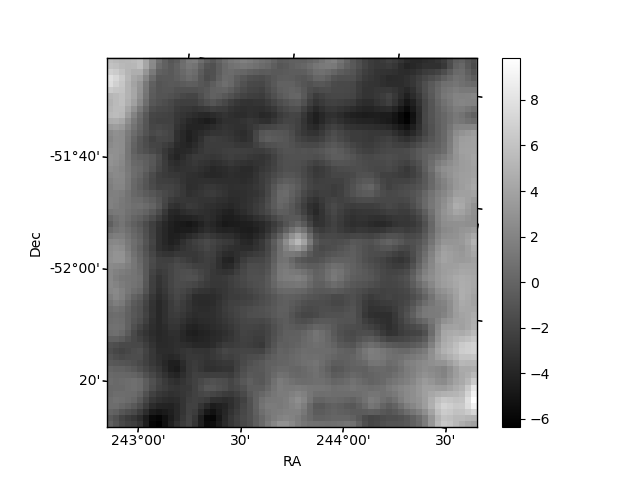
Histogram calculated using DETX and DETY for each event in the final _common_clean file
| Quadrant A | 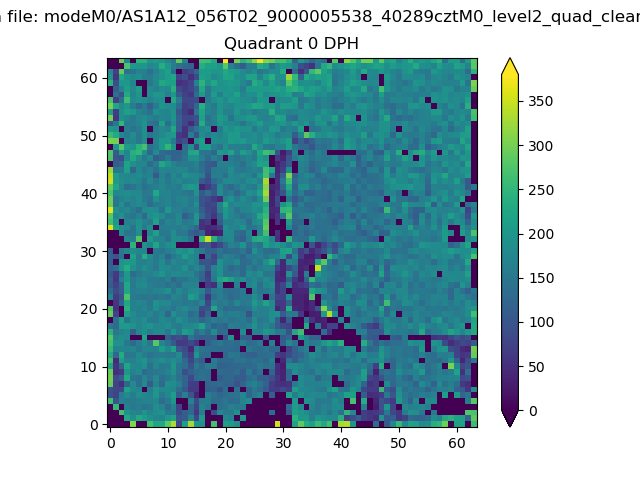 |
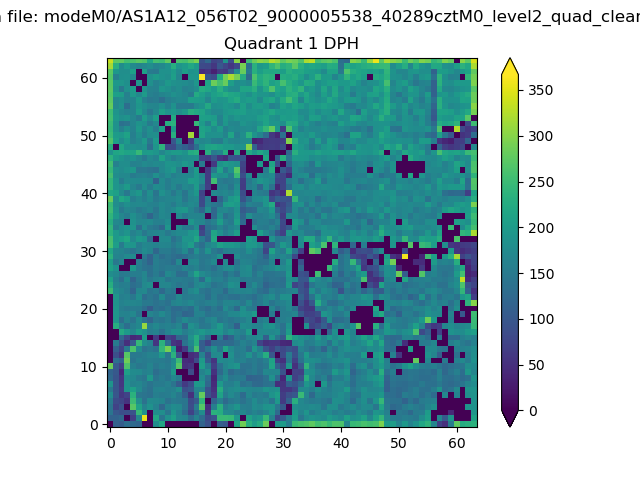 |
Quadrant B |
|---|---|---|---|
| Quadrant D | 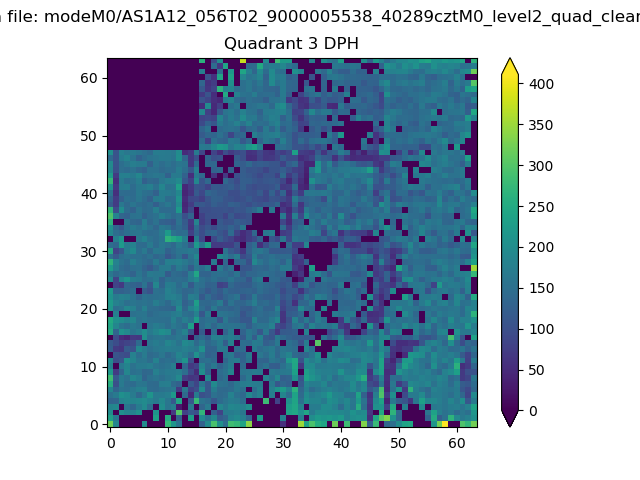 |
 |
Quadrant C |
| Plot type | Count rate plots | Images |
|---|---|---|
| Comparison with Poisson distribution Blue bars denote a histogram of data divided into 1 sec bins. Red curve is a Poisson curve with rate = median count rate of data. |
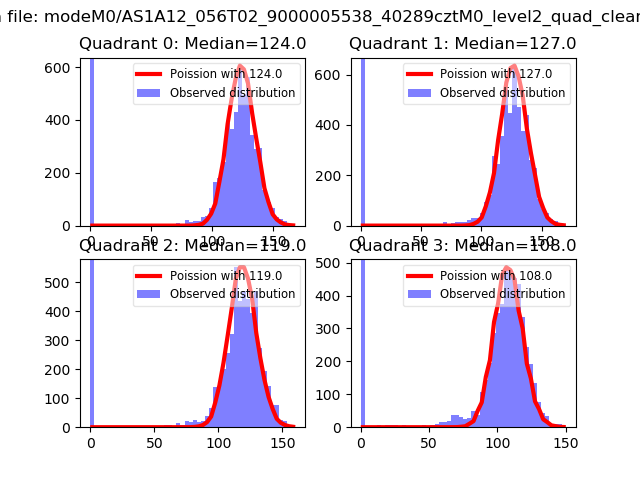 |
 |
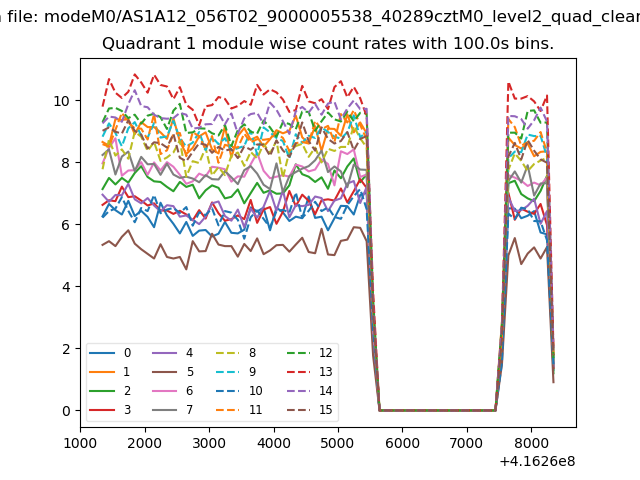
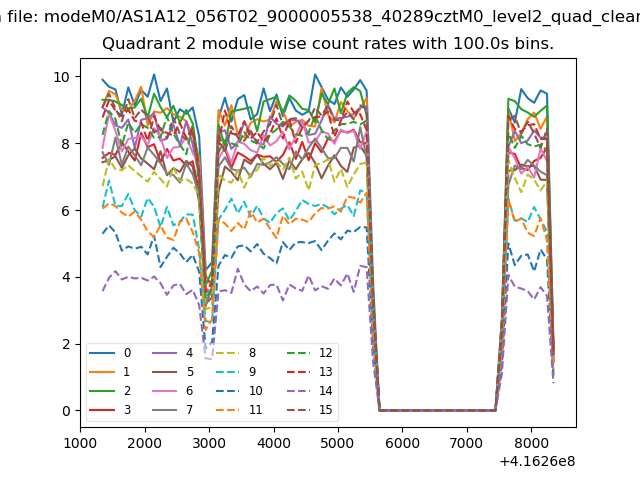
| Quadrant-wise count rates Data is divided into 100 sec bins |
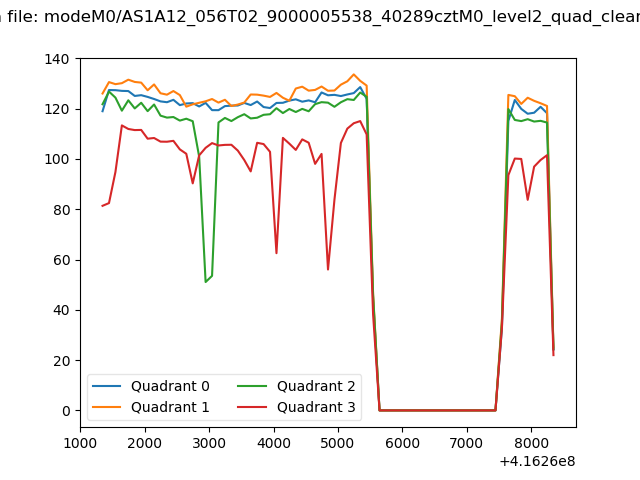 |
|
| Module-wise count rates for Quadrant A Data is divided into 100 sec bins |
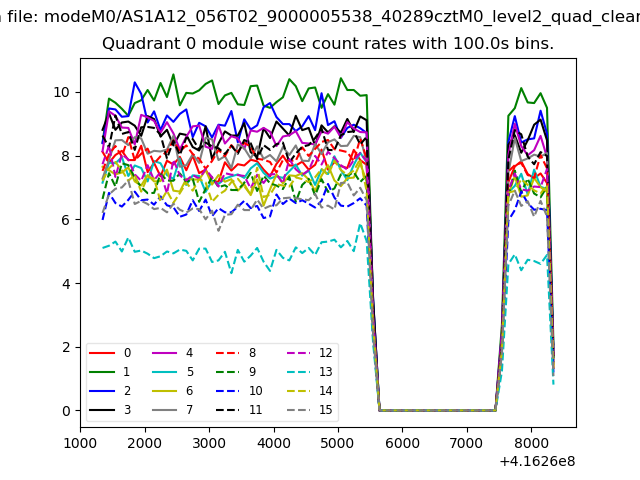 |
 |
| Module-wise count rates for Quadrant B Data is divided into 100 sec bins |
 |
 |
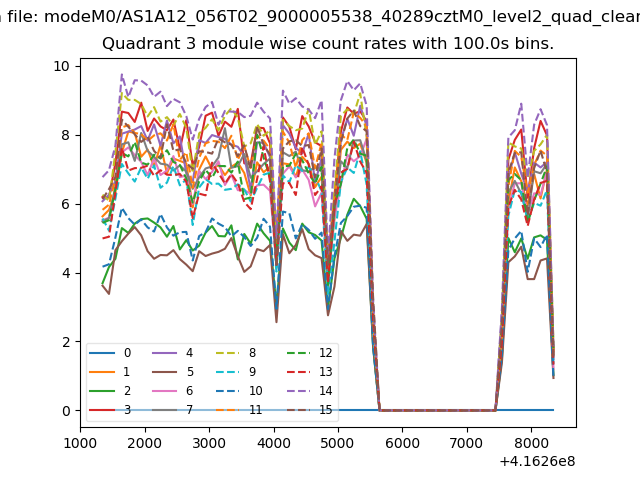
| Module-wise count rates for Quadrant C Data is divided into 100 sec bins |
 |
 |
| Module-wise count rates for Quadrant D Data is divided into 100 sec bins |
 |
 |
| Parameter | Plot |
|---|---|
| CZT HV Monitor | 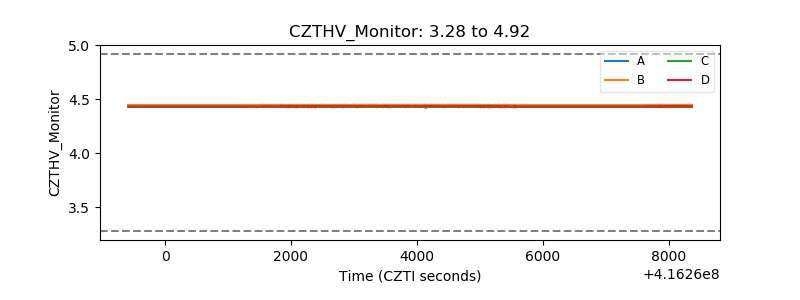 |
| D_VDD | 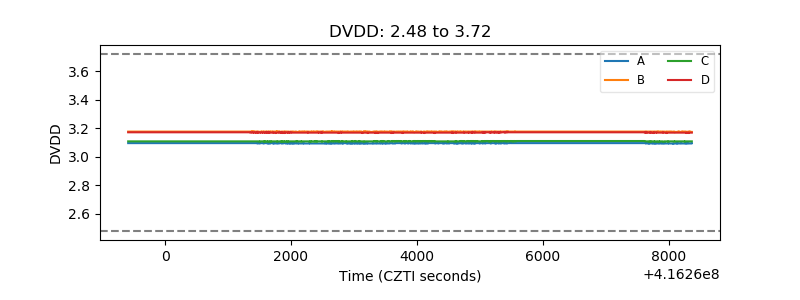 |
| Temperature 1 | 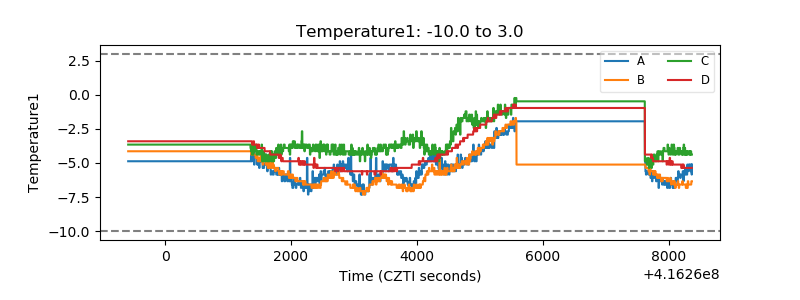 |
| Veto HV Monitor | 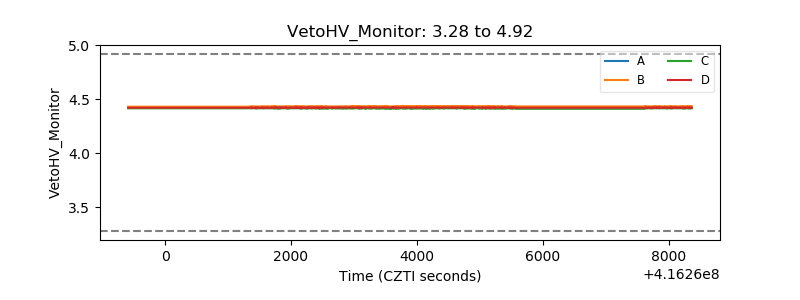 |
| Veto LLD | 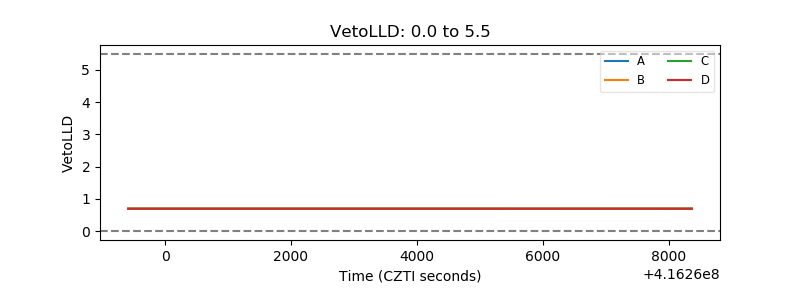 |
| Alpha Counter | 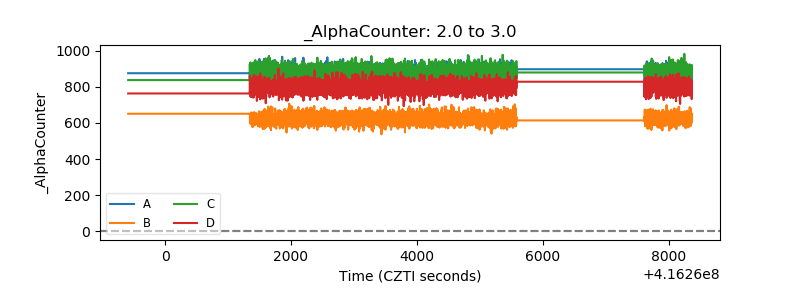 |
| _CPM_Rate | 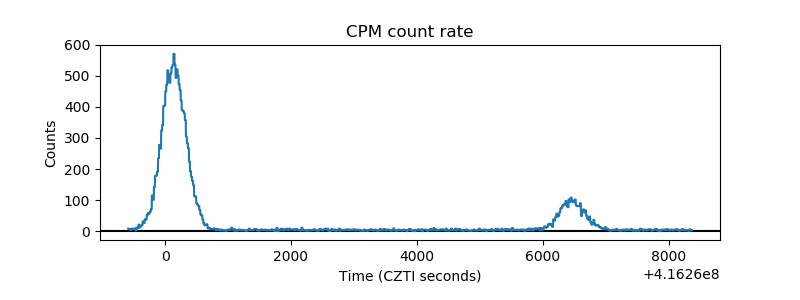 |
| CZT Counter | 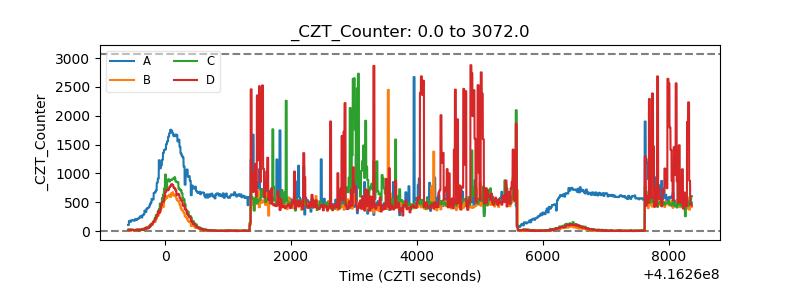 |
| +2.5 Volts monitor | 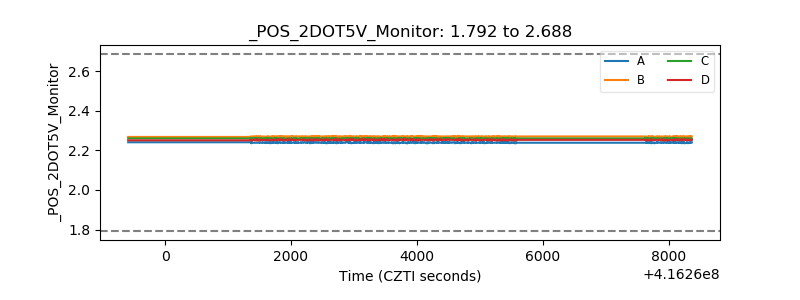 |
| +5 Volts monitor | 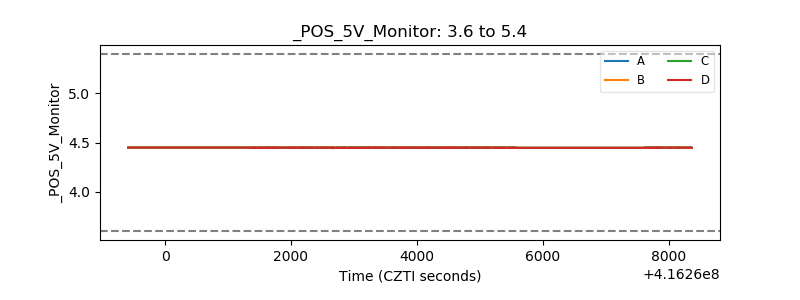 |
| _ROLL_ROT | 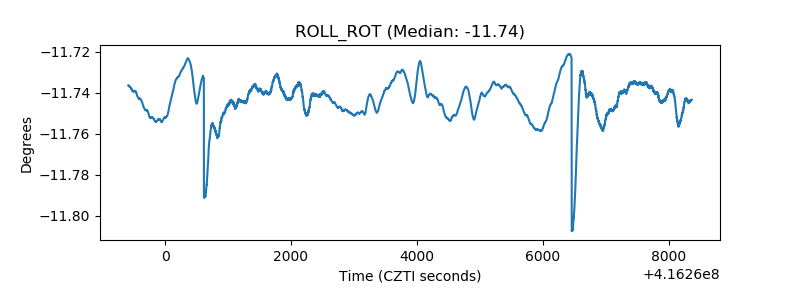 |
| _Roll_DEC | 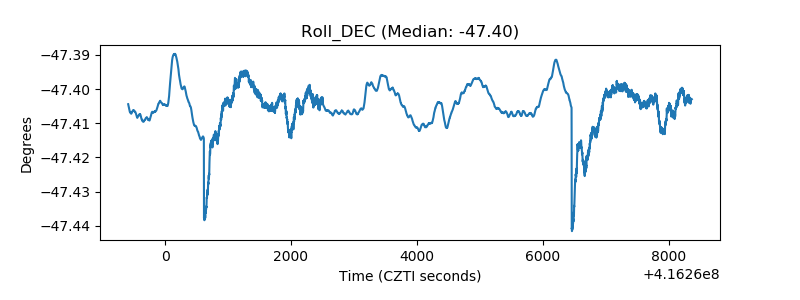 |
| _Roll_RA |  |
| Veto Counter | 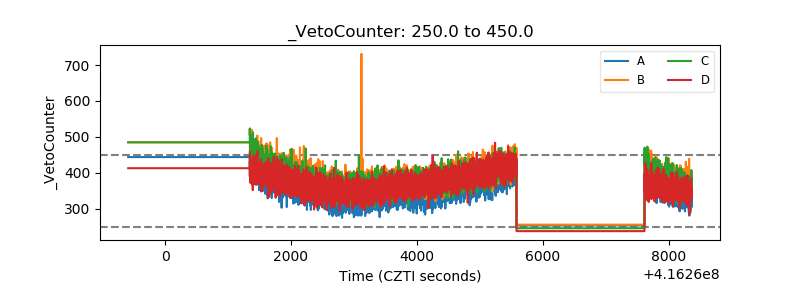 |