| Param | Original file | Final file |
|---|---|---|
| Filename | modeM0/AS1A12_056T02_9000005538_40290cztM0_level2.fits | modeM0/AS1A12_056T02_9000005538_40290cztM0_level2_quad_clean.evt |
| Size (bytes) | 336,738,240 | 91,860,480 |
| Size | 321.1 MB | 87.6 MB |
| Events in quadrant A | 3,180,337 | 622,635 |
| Events in quadrant B | 2,557,345 | 639,359 |
| Events in quadrant C | 2,788,360 | 606,558 |
| Events in quadrant D | 3,526,220 | 541,997 |
| Mode M0 | |||
|---|---|---|---|
| Quadrant | BADHDUFLAG | Total packets | Discarded packets |
| A | 0 | 12823 | 3 |
| B | 0 | 11172 | 2 |
| C | 0 | 11497 | 2 |
| D | 0 | 14274 | 2 |
| Mode M9 | |||
|---|---|---|---|
| Quadrant | BADHDUFLAG | Total packets | Discarded packets |
| A | 0 | 24 | 0 |
| B | 0 | 24 | 0 |
| C | 0 | 24 | 0 |
| D | 0 | 25 | 0 |
| Mode SS | |||
|---|---|---|---|
| Quadrant | BADHDUFLAG | Total packets | Discarded packets |
| A | 0 | 108 | 0 |
| B | 0 | 108 | 0 |
| C | 0 | 108 | 0 |
| D | 0 | 108 | 0 |
| Quadrant | Total seconds | Saturated seconds | Saturation percentage |
|---|---|---|---|
| A | 5298 | 55 | 1.038128% |
| B | 5298 | 33 | 0.622877% |
| C | 5298 | 54 | 1.019253% |
| D | 5298 | 223 | 4.209136% |
Noise dominated data is calculated using 1-second bins in cleaned event files. If a bin has >2000 counts, and if more than 50% of those come from <1% of pixels, then it is considered to be noise-dominated and hence unusable.
| Quadrant | # 1 sec bins | Bins with >0 counts | Bins with >2000 counts | High rate bins dominated by noise | Noise dominated (total time) | Noise dominated (detector-on time) | Marked lightcurve |
|---|---|---|---|---|---|---|---|
| A | 7001 | 5299 | 30 | 30 | 0.43% | 0.57% |  |
| B | 7001 | 5299 | 15 | 15 | 0.21% | 0.28% |  |
| C | 7001 | 5299 | 52 | 52 | 0.74% | 0.98% |  |
| D | 7001 | 5299 | 196 | 196 | 2.80% | 3.70% |  |
Top three noisy pixels from each quadrant. If the there are fewer than three noisy pixels in the level2.evt file, extra rows are filled as -1
| Pixel properties | Quadrant properties | ||||||
|---|---|---|---|---|---|---|---|
| Quadrant | DetID | PixID | Counts | Sigma | Mean | Median | Sigma |
| A | 10 | 83 | 457735 | 3806.99 | 589 | 580 | 120.1 |
| A | 6 | 10 | 251455 | 2089.18 | 589 | 580 | 120.1 |
| A | 13 | 248 | 166413 | 1380.99 | 589 | 580 | 120.1 |
| B | 5 | 255 | 144006 | 1258.45 | 589 | 574 | 114.0 |
| B | 4 | 171 | 52618 | 456.63 | 589 | 574 | 114.0 |
| B | 0 | 230 | 22427 | 191.73 | 589 | 574 | 114.0 |
| C | 15 | 214 | 223485 | 1635.57 | 581 | 585 | 136.3 |
| C | 9 | 187 | 161599 | 1181.47 | 581 | 585 | 136.3 |
| C | 14 | 254 | 122518 | 894.7 | 581 | 585 | 136.3 |
| D | 12 | 227 | 490053 | 3523.74 | 566 | 552 | 138.9 |
| D | 2 | 250 | 431359 | 3101.22 | 566 | 552 | 138.9 |
| D | 1 | 47 | 276562 | 1986.89 | 566 | 552 | 138.9 |
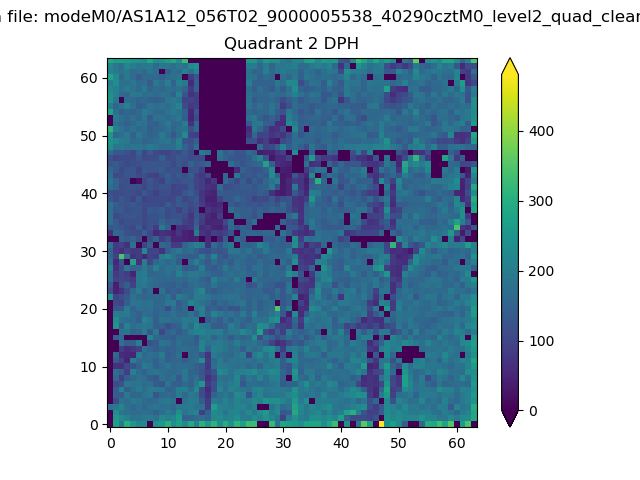
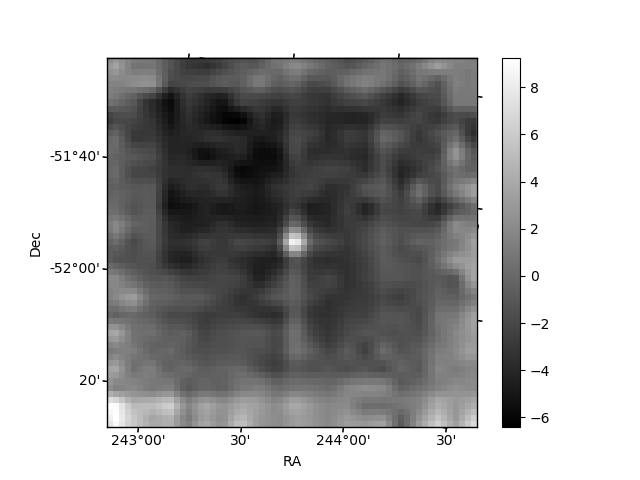
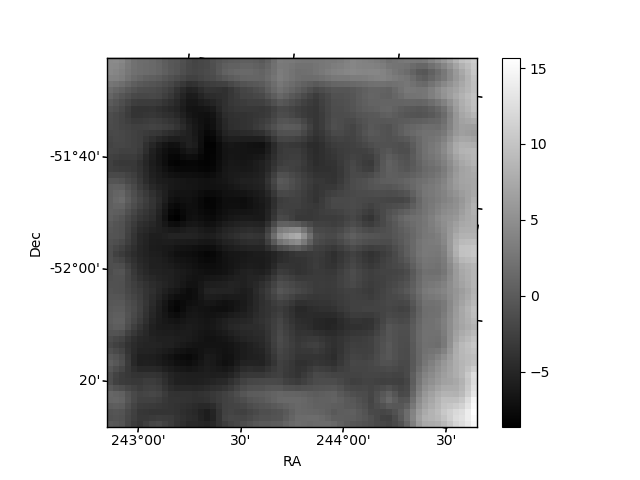
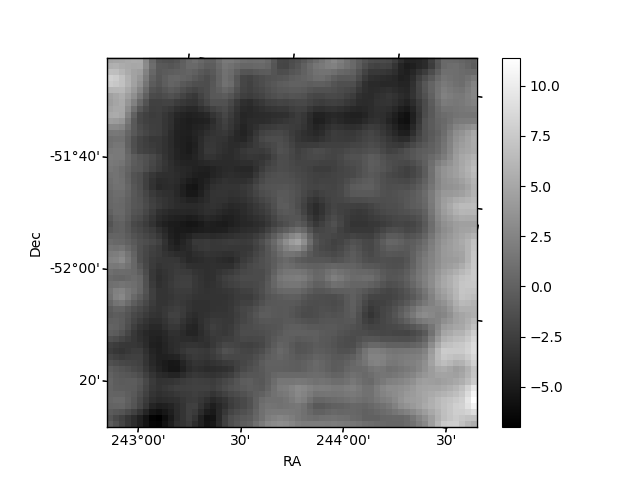
Histogram calculated using DETX and DETY for each event in the final _common_clean file
| Quadrant A | 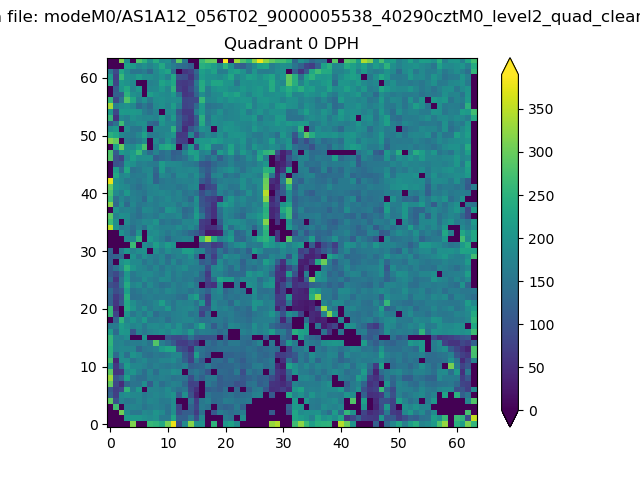 |
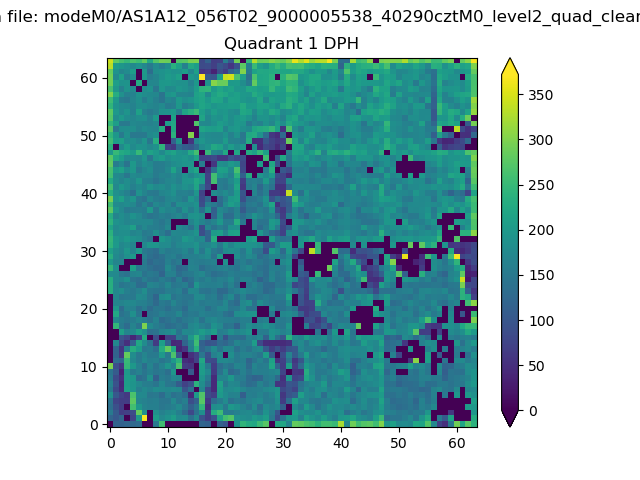 |
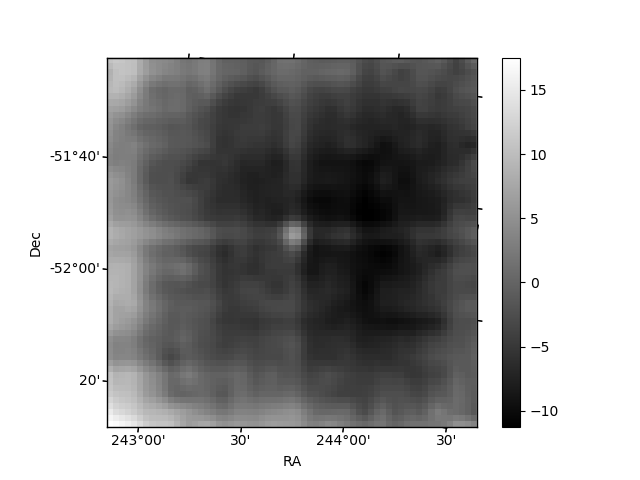
Quadrant B |
|---|---|---|---|
| Quadrant D | 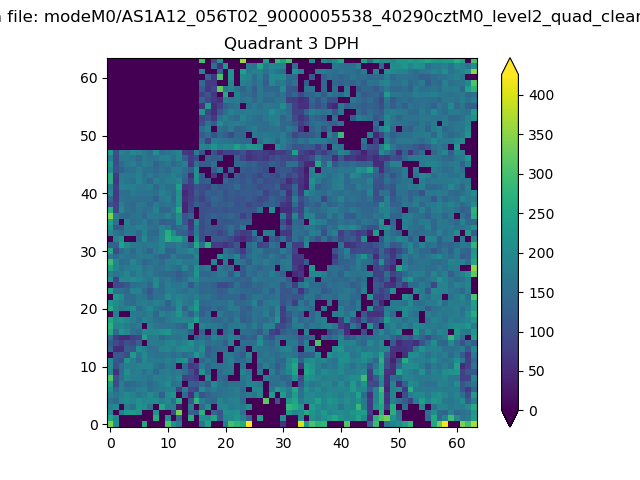 |
 |
Quadrant C |
| Plot type | Count rate plots | Images |
|---|---|---|
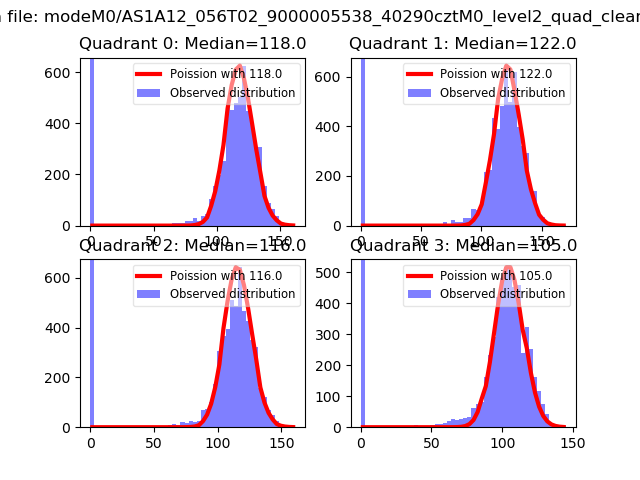
| Comparison with Poisson distribution Blue bars denote a histogram of data divided into 1 sec bins. Red curve is a Poisson curve with rate = median count rate of data. |
 |
 |
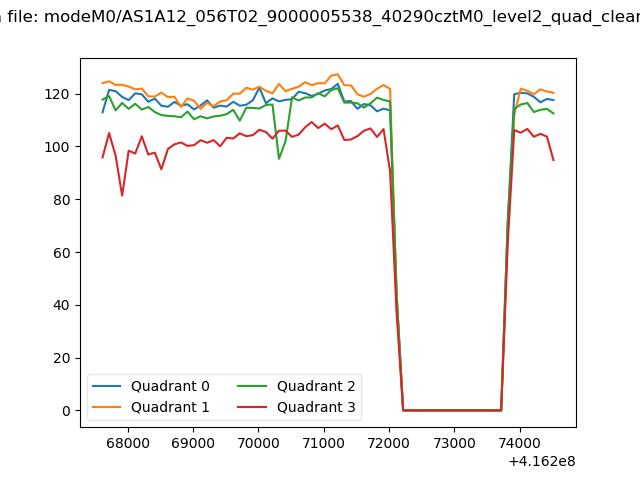
| Quadrant-wise count rates Data is divided into 100 sec bins |
 |
|
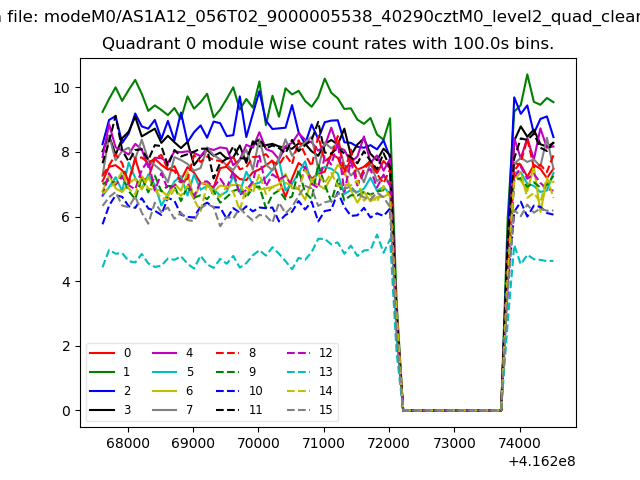
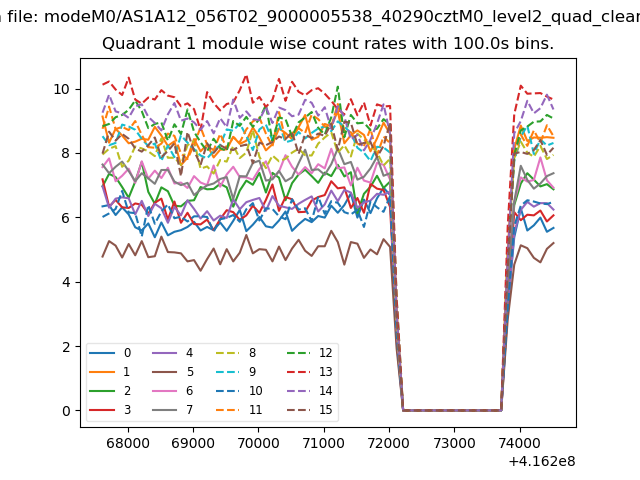
| Module-wise count rates for Quadrant A Data is divided into 100 sec bins |
 |
 |
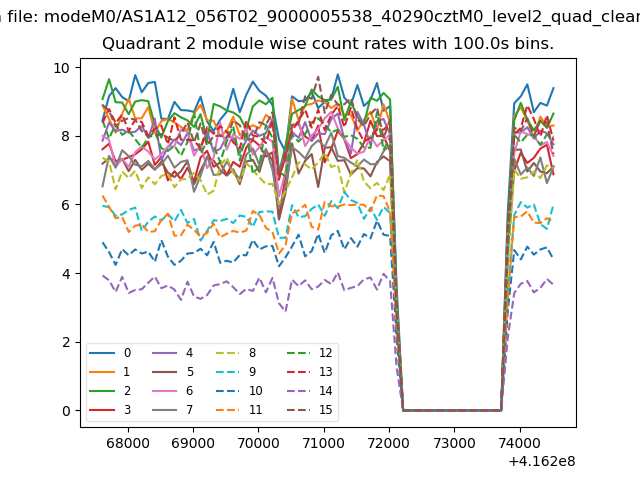
| Module-wise count rates for Quadrant B Data is divided into 100 sec bins |
 |
 |
| Module-wise count rates for Quadrant C Data is divided into 100 sec bins |
 |
 |
| Module-wise count rates for Quadrant D Data is divided into 100 sec bins |
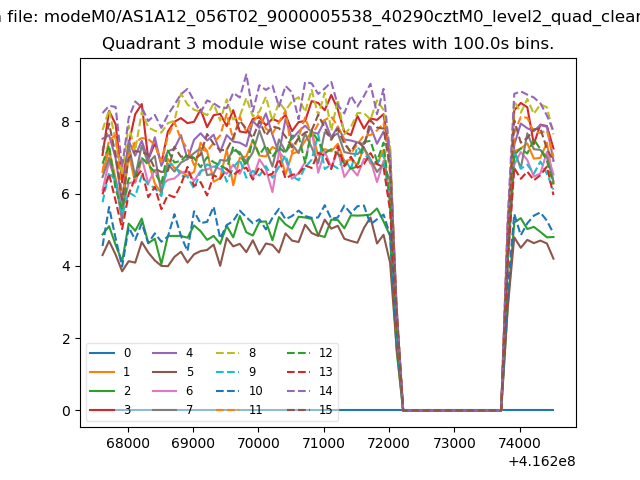 |
 |
| Parameter | Plot |
|---|---|
| CZT HV Monitor | 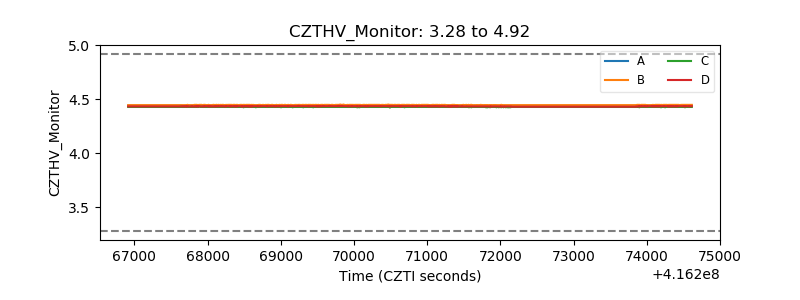 |
| D_VDD | 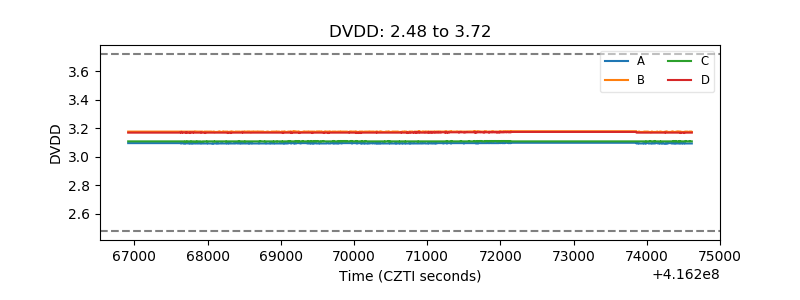 |
| Temperature 1 | 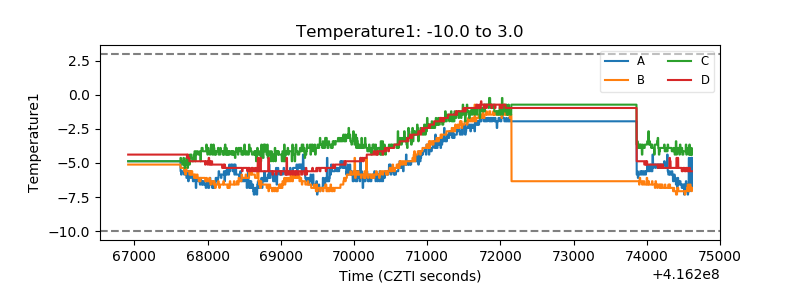 |
| Veto HV Monitor | 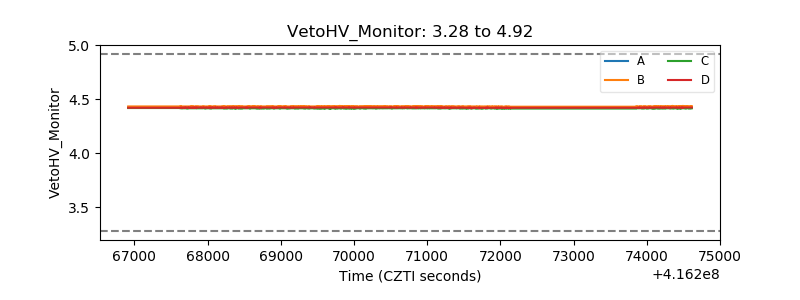 |
| Veto LLD | 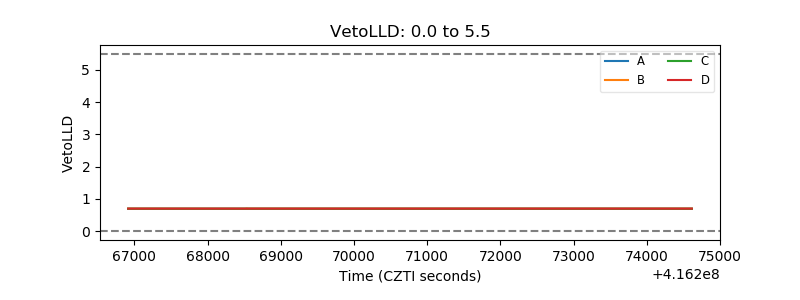 |
| Alpha Counter |  |
| _CPM_Rate | 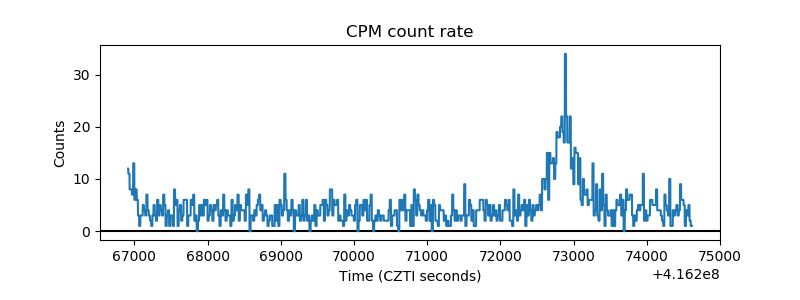 |
| CZT Counter | 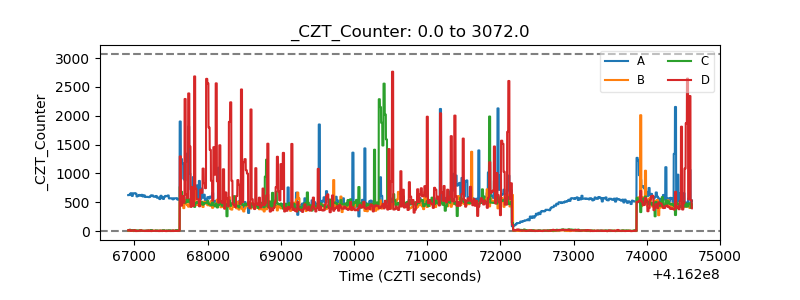 |
| +2.5 Volts monitor |  |
| +5 Volts monitor | 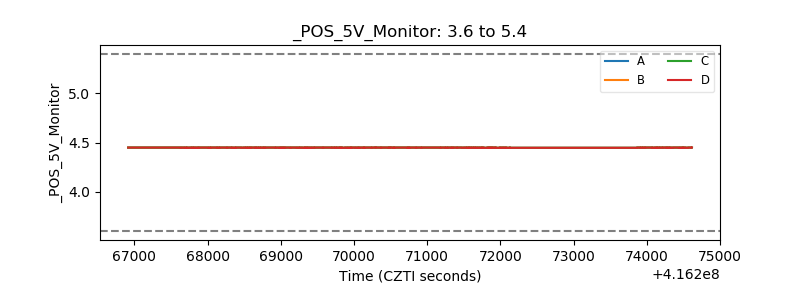 |
| _ROLL_ROT | 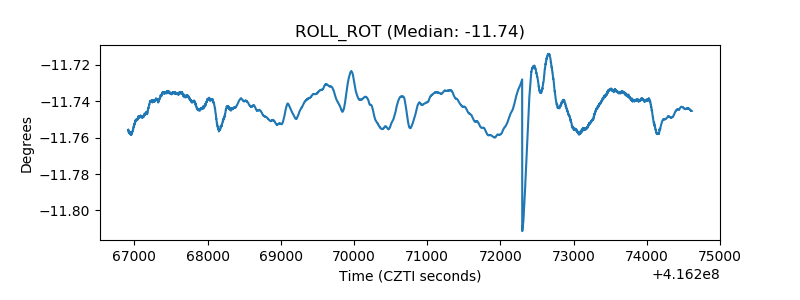 |
| _Roll_DEC | 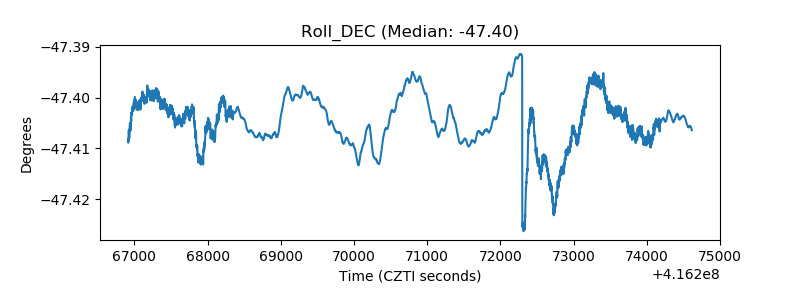 |
| _Roll_RA | 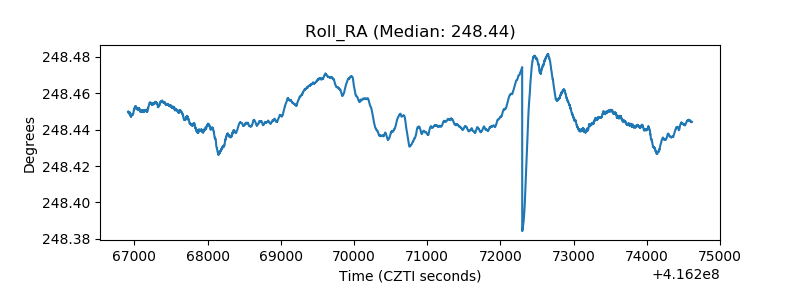 |
| Veto Counter | 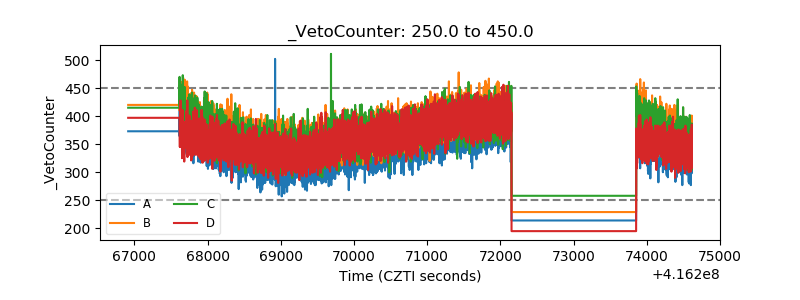 |