| Param | Original file | Final file |
|---|---|---|
| Filename | modeM0/AS1A12_056T02_9000005538_40291cztM0_level2.fits | modeM0/AS1A12_056T02_9000005538_40291cztM0_level2_quad_clean.evt |
| Size (bytes) | 338,097,600 | 98,052,480 |
| Size | 322.4 MB | 93.5 MB |
| Events in quadrant A | 3,490,893 | 655,946 |
| Events in quadrant B | 2,740,948 | 678,022 |
| Events in quadrant C | 2,733,222 | 648,701 |
| Events in quadrant D | 3,104,790 | 586,626 |
| Mode M0 | |||
|---|---|---|---|
| Quadrant | BADHDUFLAG | Total packets | Discarded packets |
| A | 0 | 13969 | 3 |
| B | 0 | 12014 | 2 |
| C | 0 | 11568 | 2 |
| D | 0 | 13290 | 2 |
| Mode M9 | |||
|---|---|---|---|
| Quadrant | BADHDUFLAG | Total packets | Discarded packets |
| A | 0 | 23 | 0 |
| B | 0 | 23 | 0 |
| C | 0 | 23 | 0 |
| D | 0 | 24 | 0 |
| Mode SS | |||
|---|---|---|---|
| Quadrant | BADHDUFLAG | Total packets | Discarded packets |
| A | 0 | 116 | 0 |
| B | 0 | 116 | 0 |
| C | 0 | 116 | 0 |
| D | 0 | 116 | 0 |
| Quadrant | Total seconds | Saturated seconds | Saturation percentage |
|---|---|---|---|
| A | 5717 | 128 | 2.238937% |
| B | 5717 | 36 | 0.629701% |
| C | 5717 | 2 | 0.034983% |
| D | 5717 | 85 | 1.486794% |
Noise dominated data is calculated using 1-second bins in cleaned event files. If a bin has >2000 counts, and if more than 50% of those come from <1% of pixels, then it is considered to be noise-dominated and hence unusable.
| Quadrant | # 1 sec bins | Bins with >0 counts | Bins with >2000 counts | High rate bins dominated by noise | Noise dominated (total time) | Noise dominated (detector-on time) | Marked lightcurve |
|---|---|---|---|---|---|---|---|
| A | 7119 | 5718 | 122 | 122 | 1.71% | 2.13% | 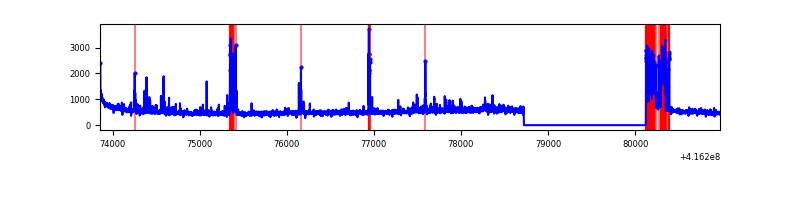 |
| B | 7119 | 5718 | 13 | 13 | 0.18% | 0.23% | 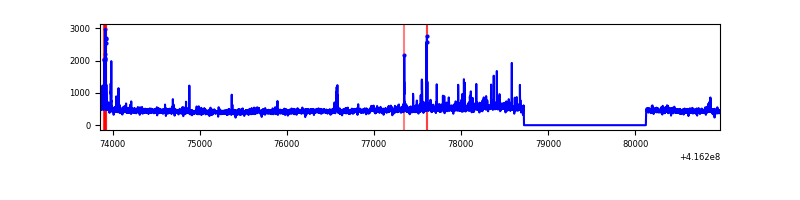 |
| C | 7119 | 5718 | 0 | 0 | 0.00% | 0.00% | 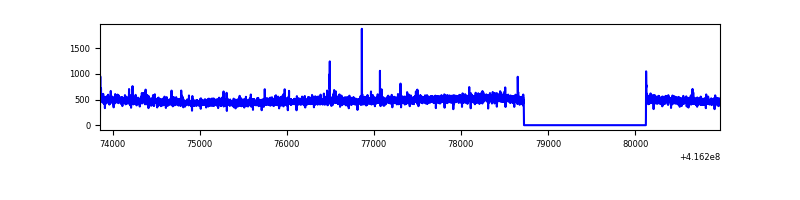 |
| D | 7119 | 5718 | 74 | 74 | 1.04% | 1.29% | 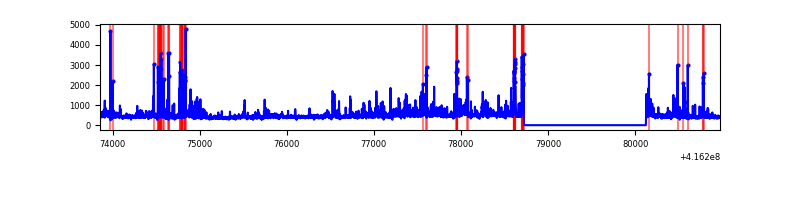 |
Top three noisy pixels from each quadrant. If the there are fewer than three noisy pixels in the level2.evt file, extra rows are filled as -1
| Pixel properties | Quadrant properties | ||||||
|---|---|---|---|---|---|---|---|
| Quadrant | DetID | PixID | Counts | Sigma | Mean | Median | Sigma |
| A | 10 | 83 | 489654 | 3716.91 | 636 | 624 | 131.6 |
| A | 15 | 96 | 270018 | 2047.55 | 636 | 624 | 131.6 |
| A | 13 | 248 | 163913 | 1241.09 | 636 | 624 | 131.6 |
| B | 5 | 255 | 64372 | 514.51 | 638 | 620 | 123.9 |
| B | 4 | 171 | 49001 | 390.46 | 638 | 620 | 123.9 |
| B | 0 | 245 | 35803 | 283.94 | 638 | 620 | 123.9 |
| C | 15 | 214 | 242427 | 1637.41 | 630 | 635 | 147.7 |
| C | 14 | 254 | 24876 | 164.16 | 630 | 635 | 147.7 |
| C | 1 | 16 | 6118 | 37.13 | 630 | 635 | 147.7 |
| D | 12 | 227 | 337983 | 2197.82 | 624 | 607 | 153.5 |
| D | 2 | 250 | 84953 | 549.47 | 624 | 607 | 153.5 |
| D | 12 | 233 | 84851 | 548.8 | 624 | 607 | 153.5 |
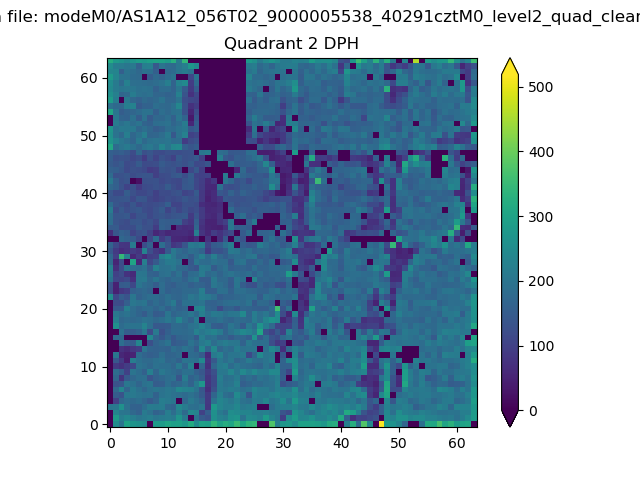
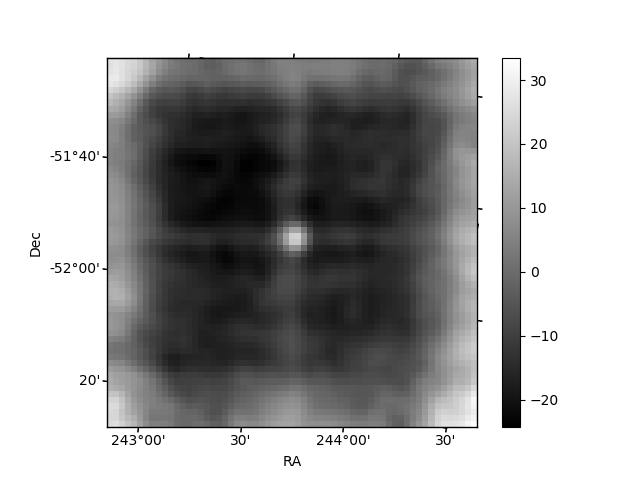
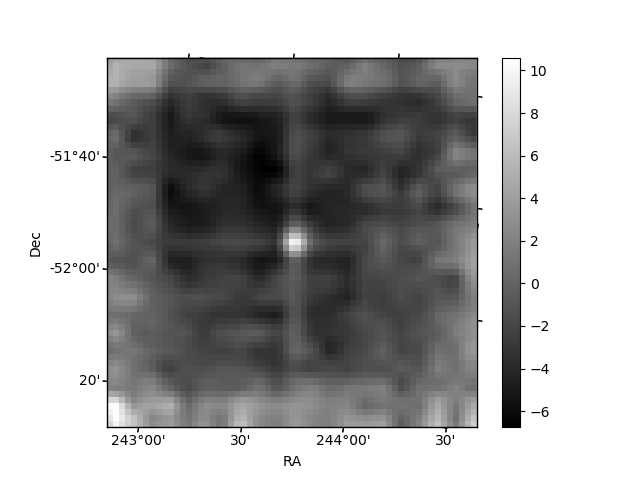
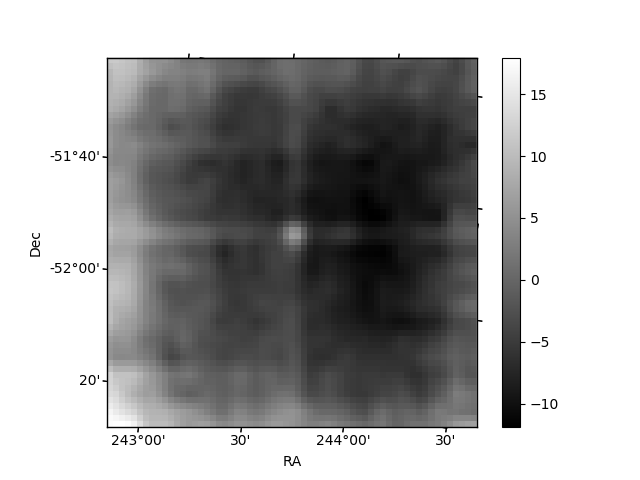
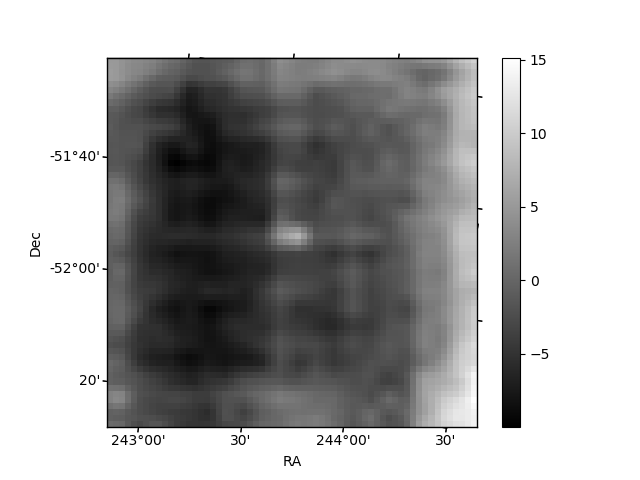
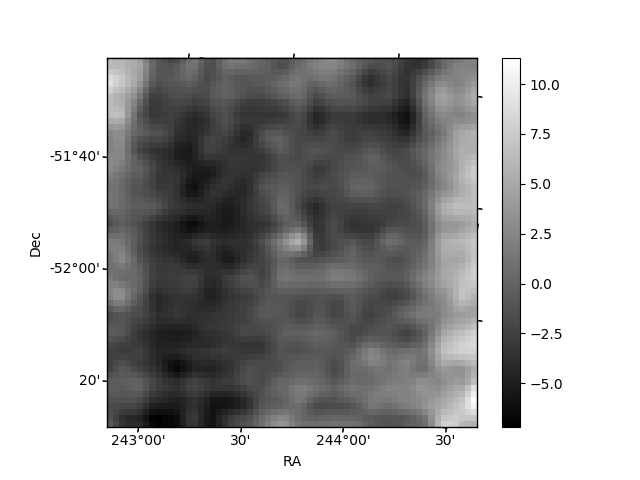
Histogram calculated using DETX and DETY for each event in the final _common_clean file
| Quadrant A | 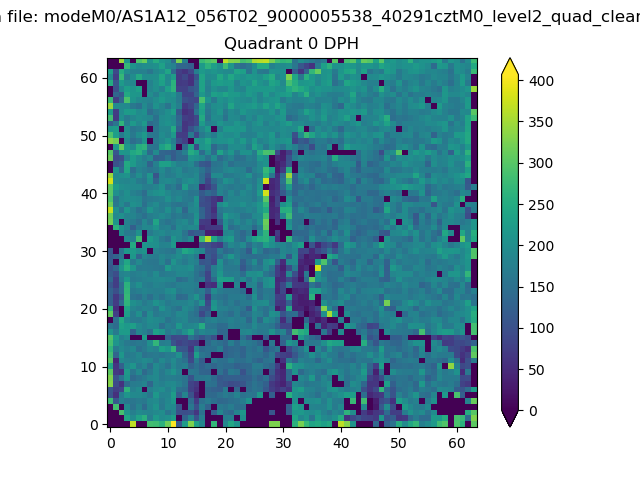 |
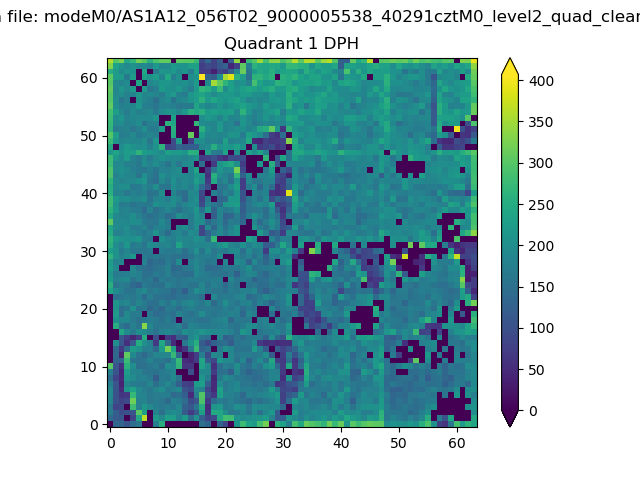 |
Quadrant B |
|---|---|---|---|
| Quadrant D | 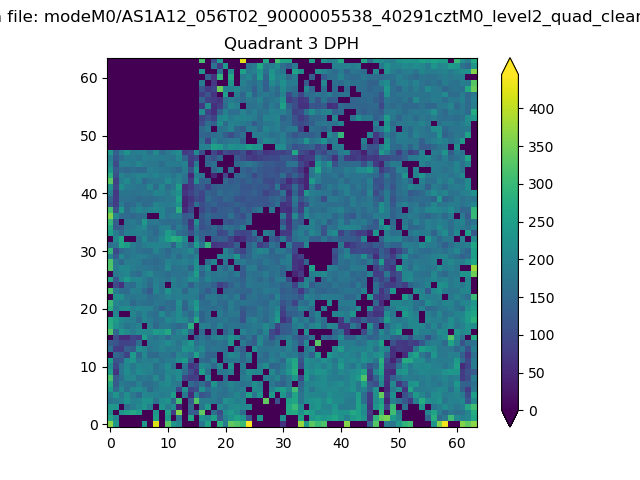 |
 |
Quadrant C |
| Plot type | Count rate plots | Images |
|---|---|---|
| Comparison with Poisson distribution Blue bars denote a histogram of data divided into 1 sec bins. Red curve is a Poisson curve with rate = median count rate of data. |
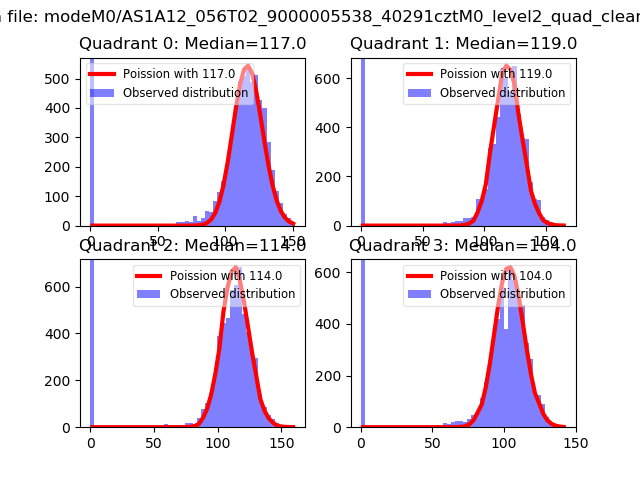 |
 |
| Quadrant-wise count rates Data is divided into 100 sec bins |
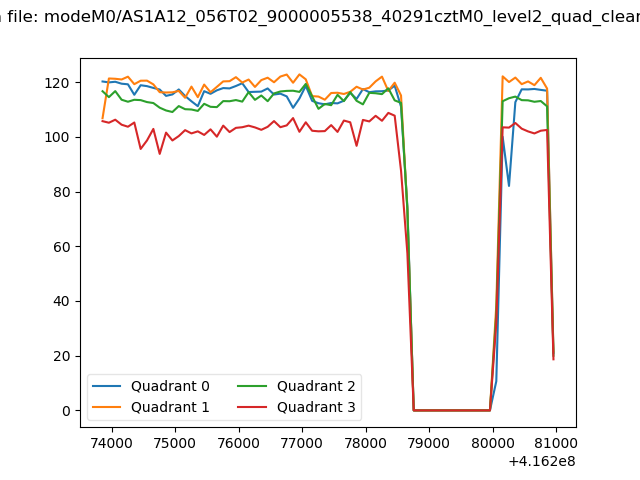 |
|
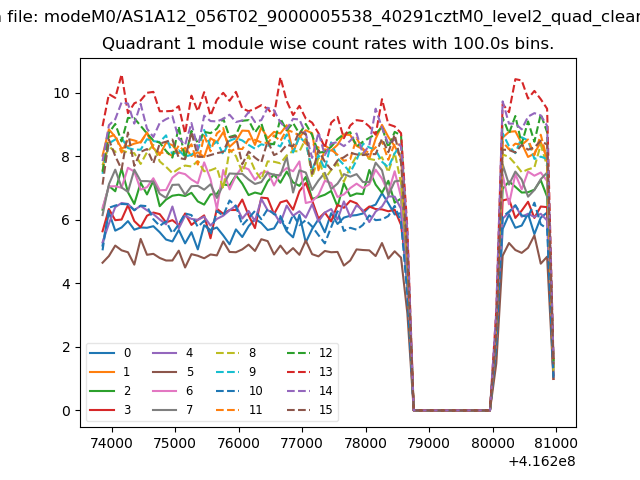
| Module-wise count rates for Quadrant A Data is divided into 100 sec bins |
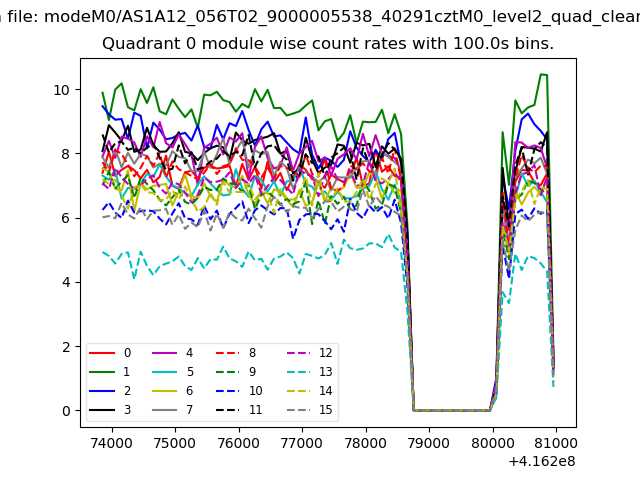 |
 |
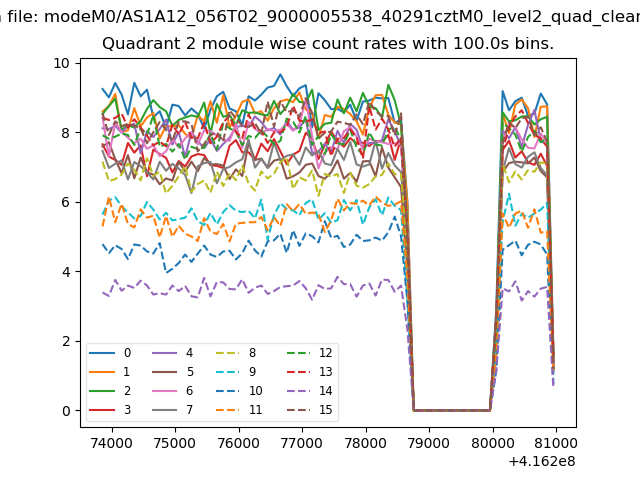
| Module-wise count rates for Quadrant B Data is divided into 100 sec bins |
 |
 |
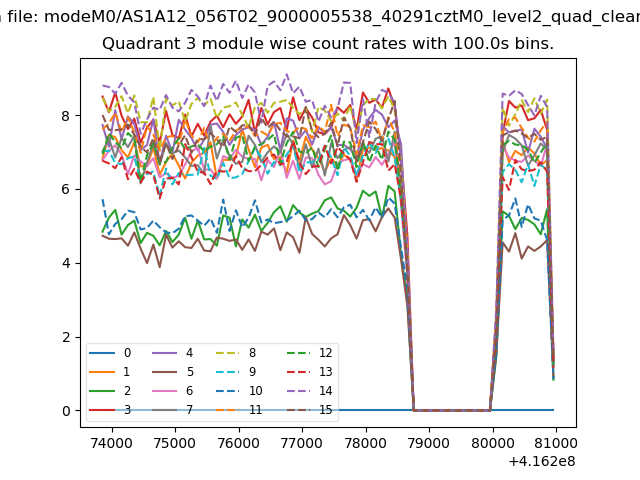
| Module-wise count rates for Quadrant C Data is divided into 100 sec bins |
 |
 |
| Module-wise count rates for Quadrant D Data is divided into 100 sec bins |
 |
 |
| Parameter | Plot |
|---|---|
| CZT HV Monitor | 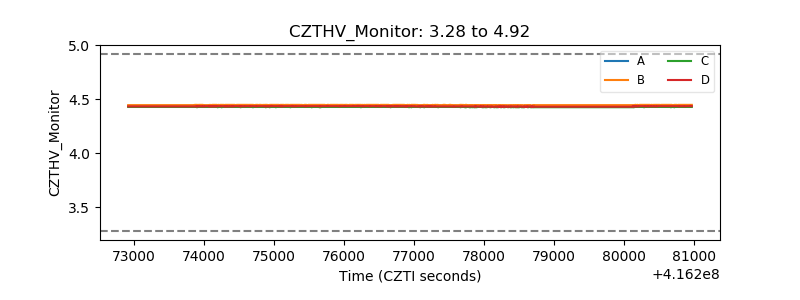 |
| D_VDD | 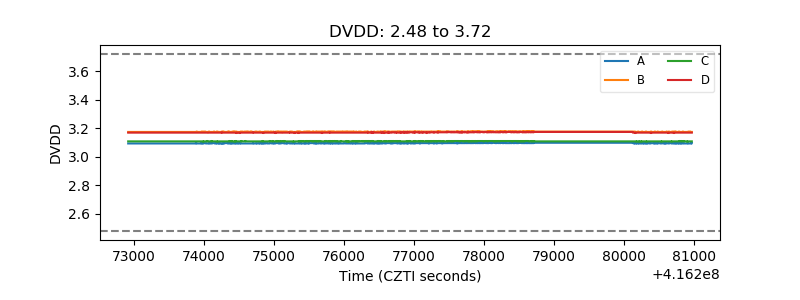 |
| Temperature 1 | 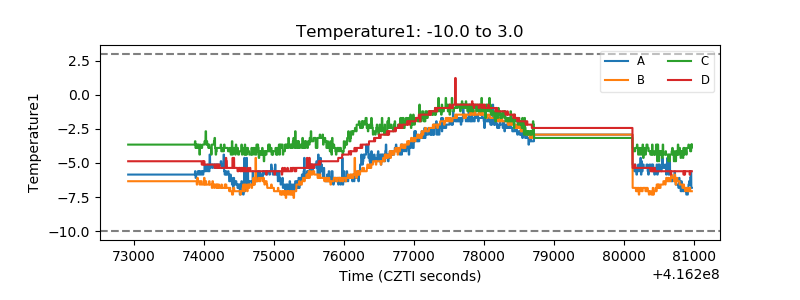 |
| Veto HV Monitor | 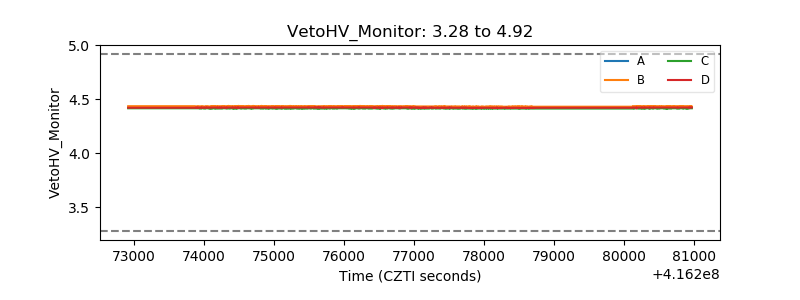 |
| Veto LLD | 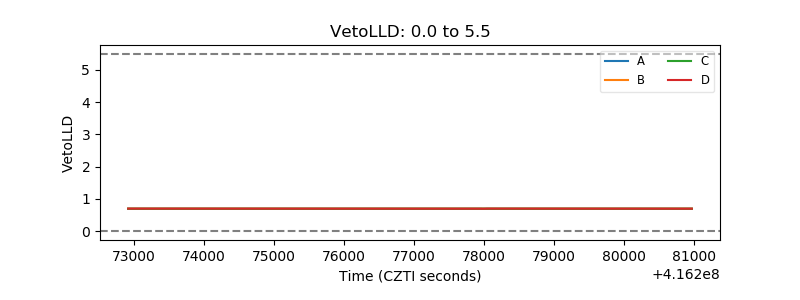 |
| Alpha Counter | 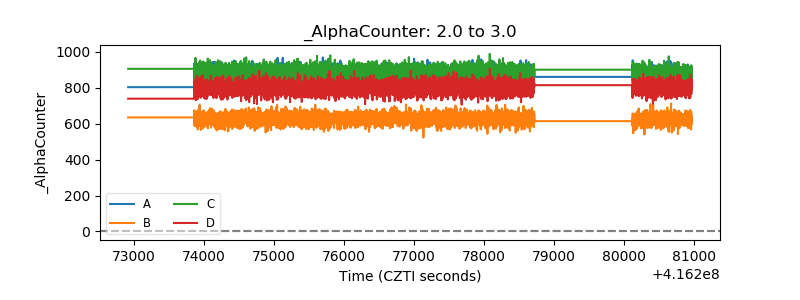 |
| _CPM_Rate | 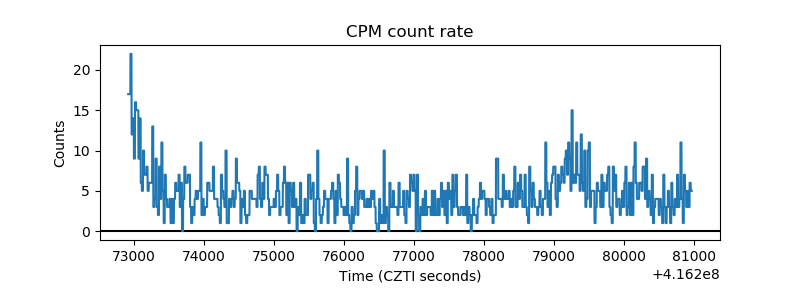 |
| CZT Counter | 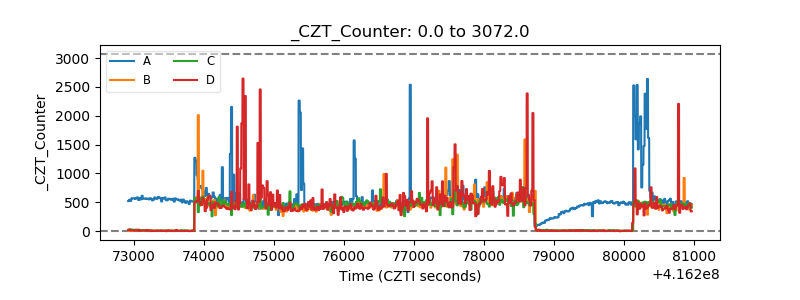 |
| +2.5 Volts monitor | 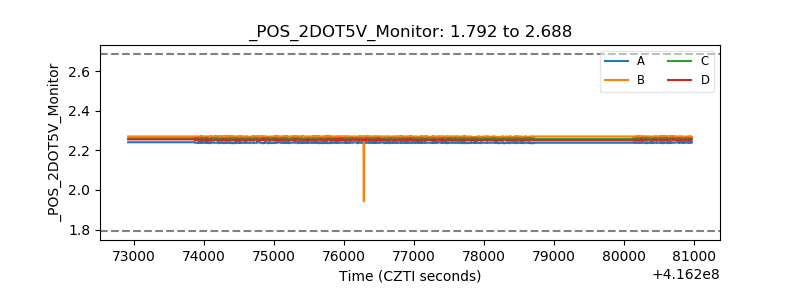 |
| +5 Volts monitor | 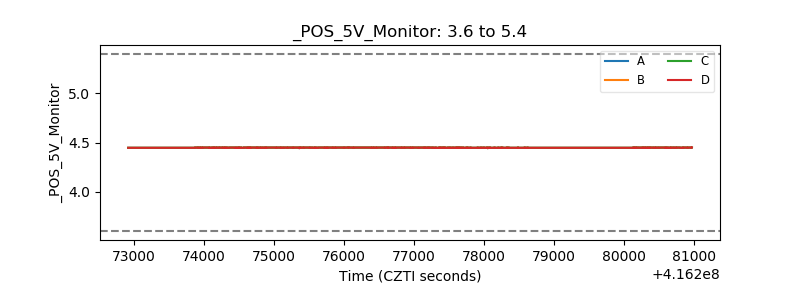 |
| _ROLL_ROT | 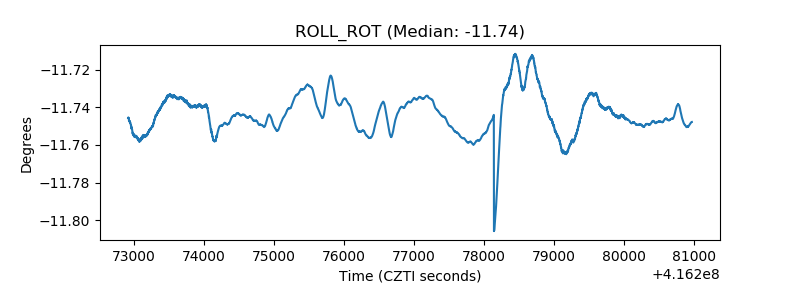 |
| _Roll_DEC | 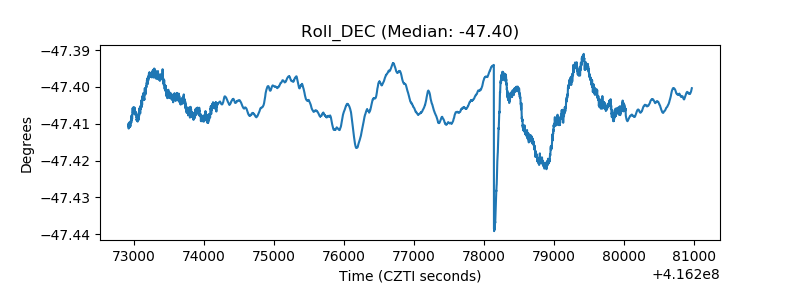 |
| _Roll_RA | 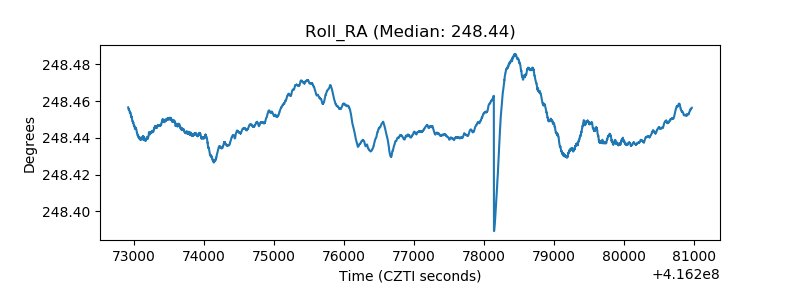 |
| Veto Counter | 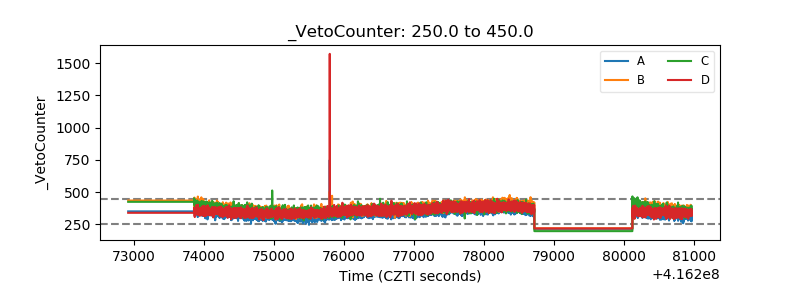 |