| Param | Original file | Final file |
|---|---|---|
| Filename | modeM0/AS1A12_056T02_9000005538_40296cztM0_level2.fits | modeM0/AS1A12_056T02_9000005538_40296cztM0_level2_quad_clean.evt |
| Size (bytes) | 961,776,000 | 237,971,520 |
| Size | 917.2 MB | 226.9 MB |
| Events in quadrant A | 10,216,351 | 1,537,939 |
| Events in quadrant B | 7,395,979 | 1,653,081 |
| Events in quadrant C | 7,178,880 | 1,603,189 |
| Events in quadrant D | 9,689,861 | 1,411,567 |
| Mode M0 | |||
|---|---|---|---|
| Quadrant | BADHDUFLAG | Total packets | Discarded packets |
| A | 0 | 39397 | 4 |
| B | 0 | 31939 | 3 |
| C | 0 | 30059 | 3 |
| D | 0 | 39034 | 3 |
| Mode M9 | |||
|---|---|---|---|
| Quadrant | BADHDUFLAG | Total packets | Discarded packets |
| A | 0 | 37 | 0 |
| B | 0 | 37 | 0 |
| C | 0 | 37 | 0 |
| D | 0 | 38 | 0 |
| Mode SS | |||
|---|---|---|---|
| Quadrant | BADHDUFLAG | Total packets | Discarded packets |
| A | 0 | 294 | 0 |
| B | 0 | 294 | 0 |
| C | 0 | 294 | 0 |
| D | 0 | 294 | 0 |
| Quadrant | Total seconds | Saturated seconds | Saturation percentage |
|---|---|---|---|
| A | 14471 | 824 | 5.694147% |
| B | 14471 | 103 | 0.711768% |
| C | 14471 | 53 | 0.366250% |
| D | 14471 | 609 | 4.208417% |
Noise dominated data is calculated using 1-second bins in cleaned event files. If a bin has >2000 counts, and if more than 50% of those come from <1% of pixels, then it is considered to be noise-dominated and hence unusable.
| Quadrant | # 1 sec bins | Bins with >0 counts | Bins with >2000 counts | High rate bins dominated by noise | Noise dominated (total time) | Noise dominated (detector-on time) | Marked lightcurve |
|---|---|---|---|---|---|---|---|
| A | 17095 | 14473 | 670 | 670 | 3.92% | 4.63% | 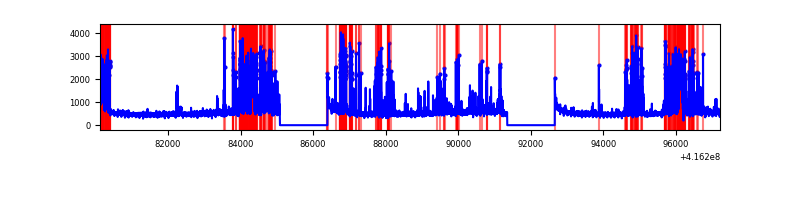 |
| B | 17095 | 14473 | 48 | 48 | 0.28% | 0.33% | 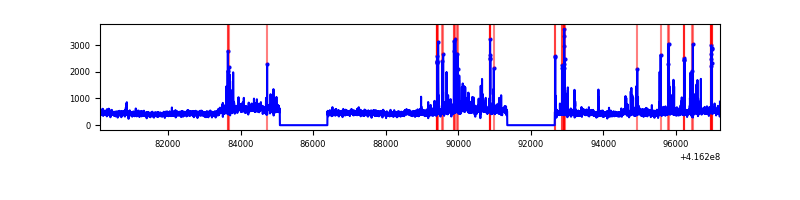 |
| C | 17095 | 14473 | 34 | 34 | 0.20% | 0.23% | 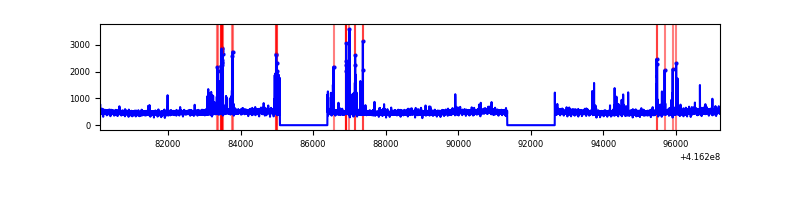 |
| D | 17095 | 14473 | 545 | 545 | 3.19% | 3.77% | 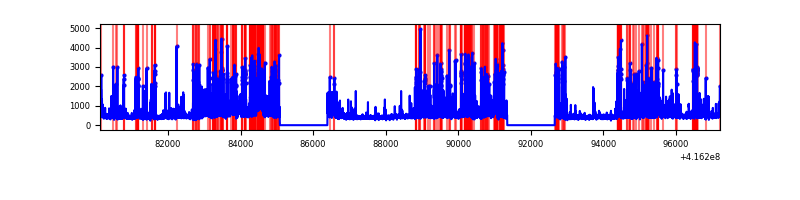 |
Top three noisy pixels from each quadrant. If the there are fewer than three noisy pixels in the level2.evt file, extra rows are filled as -1
| Pixel properties | Quadrant properties | ||||||
|---|---|---|---|---|---|---|---|
| Quadrant | DetID | PixID | Counts | Sigma | Mean | Median | Sigma |
| A | 13 | 248 | 2421758 | 7498.03 | 1594 | 1565 | 322.8 |
| A | 10 | 83 | 1082753 | 3349.64 | 1594 | 1565 | 322.8 |
| A | 15 | 96 | 271393 | 835.96 | 1594 | 1565 | 322.8 |
| B | 7 | 202 | 386907 | 1255.8 | 1617 | 1574 | 306.8 |
| B | 5 | 255 | 249721 | 808.71 | 1617 | 1574 | 306.8 |
| B | 4 | 171 | 166751 | 538.31 | 1617 | 1574 | 306.8 |
| C | 15 | 214 | 601294 | 1620.28 | 1594 | 1608 | 370.1 |
| C | 14 | 254 | 318808 | 857.04 | 1594 | 1608 | 370.1 |
| C | 7 | 247 | 17165 | 42.03 | 1594 | 1608 | 370.1 |
| D | 12 | 227 | 1691967 | 4394.06 | 1571 | 1531 | 384.7 |
| D | 12 | 233 | 825681 | 2142.27 | 1571 | 1531 | 384.7 |
| D | 2 | 250 | 282286 | 729.78 | 1571 | 1531 | 384.7 |
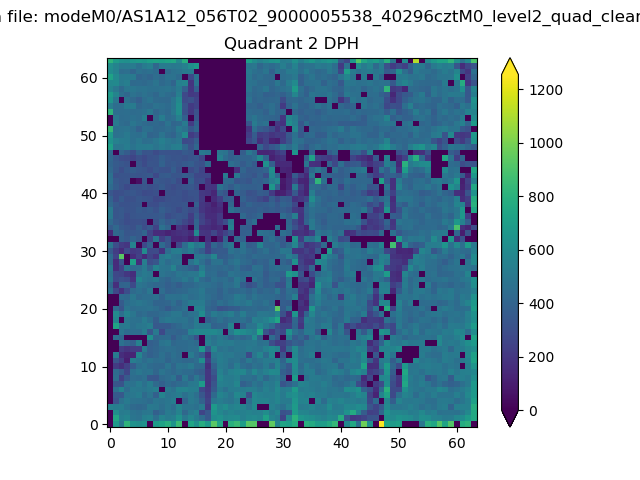
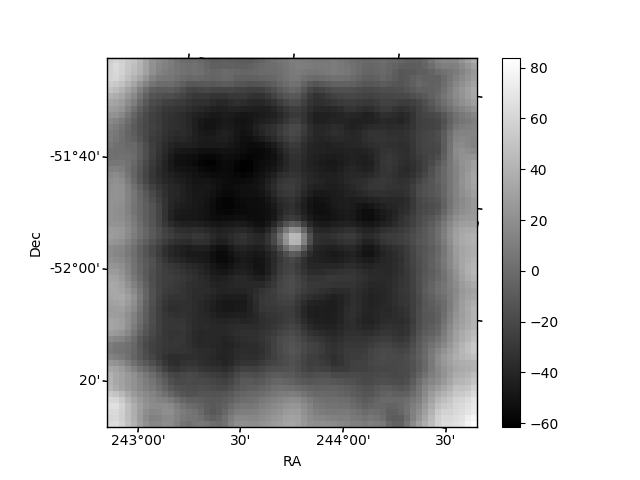
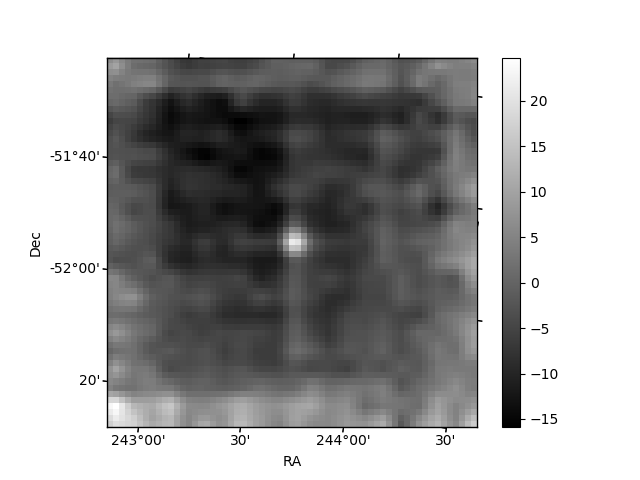
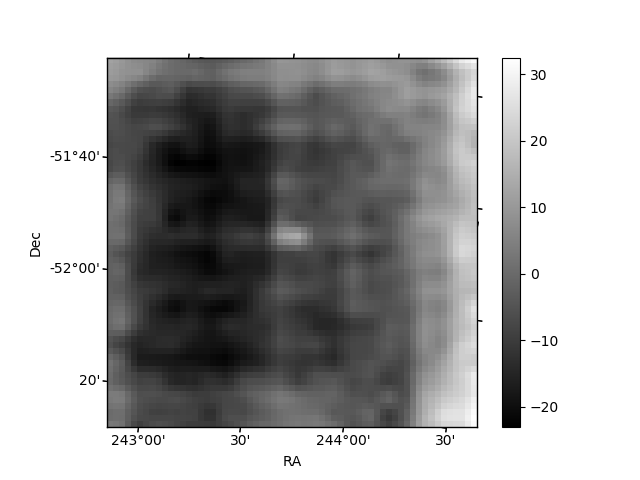
Histogram calculated using DETX and DETY for each event in the final _common_clean file
| Quadrant A | 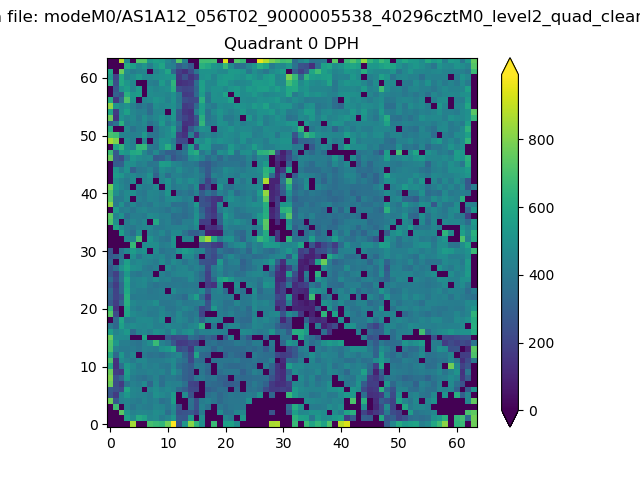 |
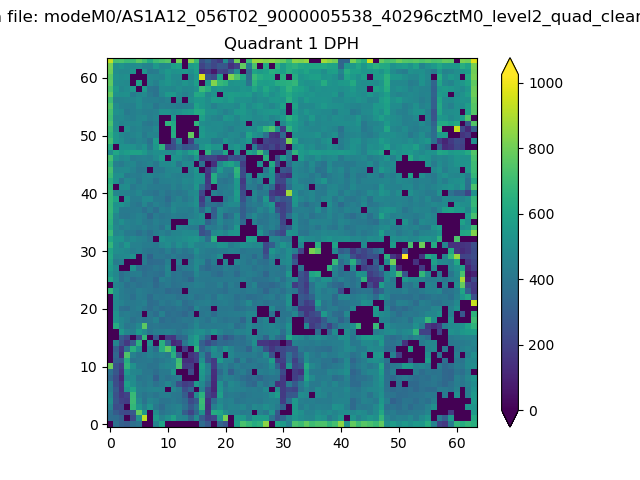 |
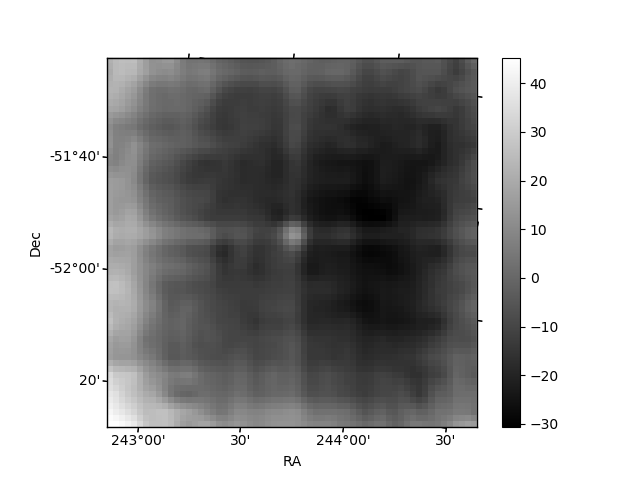
Quadrant B |
|---|---|---|---|
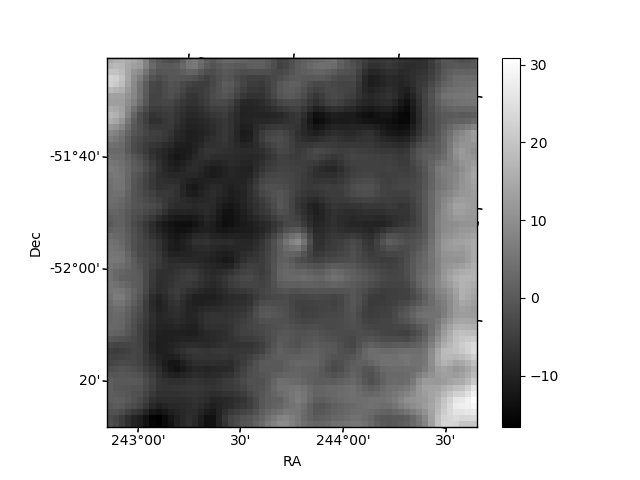
| Quadrant D | 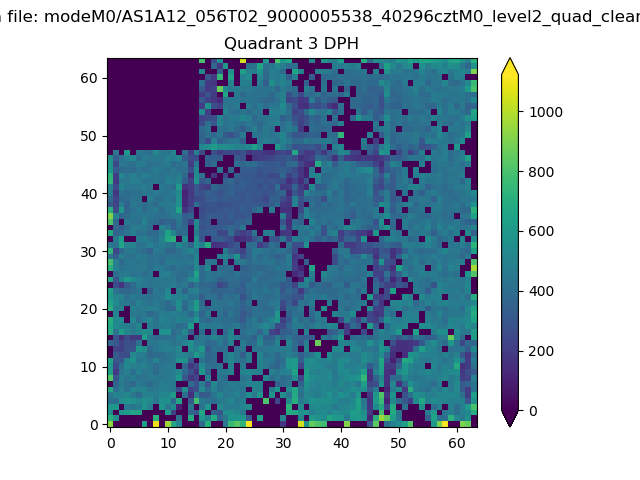 |
 |
Quadrant C |
| Plot type | Count rate plots | Images |
|---|---|---|
| Comparison with Poisson distribution Blue bars denote a histogram of data divided into 1 sec bins. Red curve is a Poisson curve with rate = median count rate of data. |
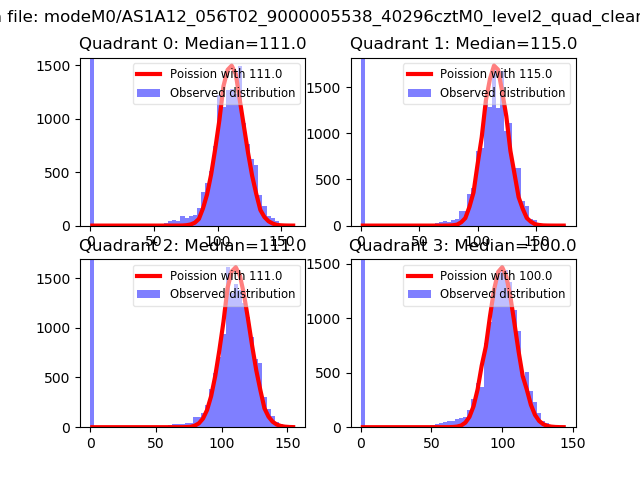 |
 |
| Quadrant-wise count rates Data is divided into 100 sec bins |
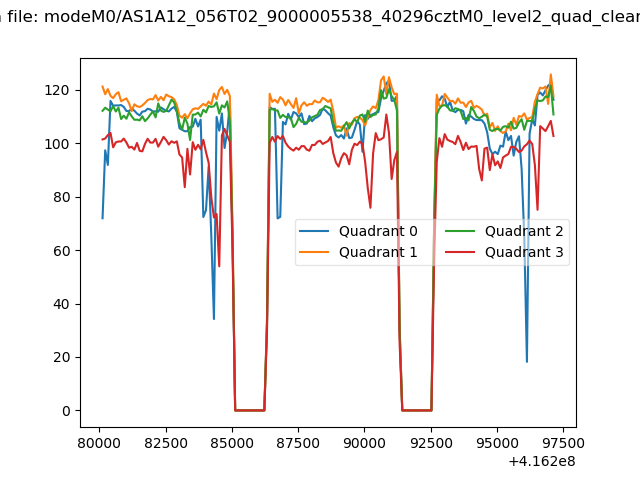 |
|
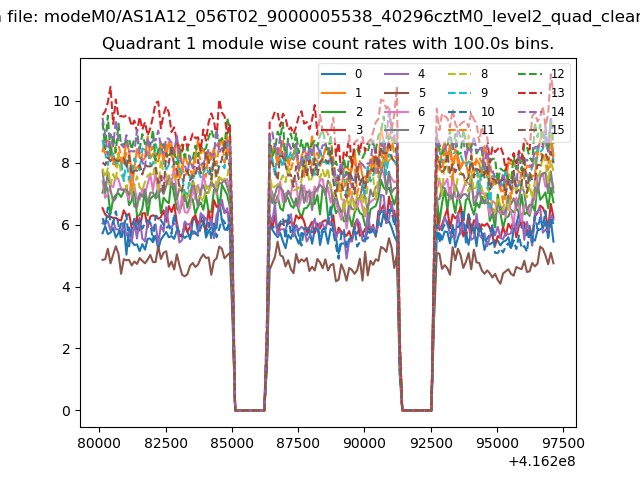
| Module-wise count rates for Quadrant A Data is divided into 100 sec bins |
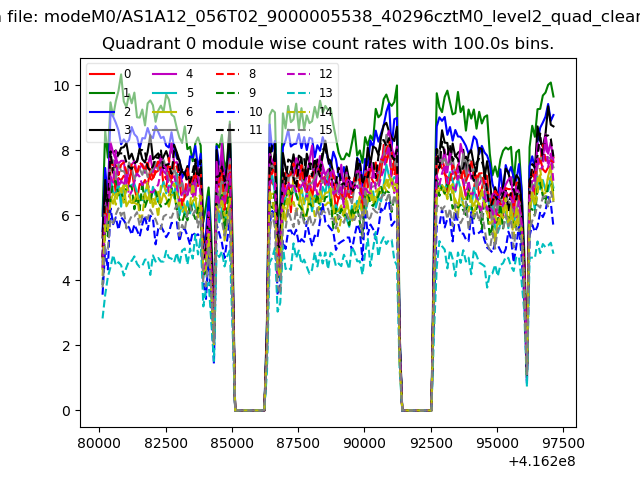 |
 |
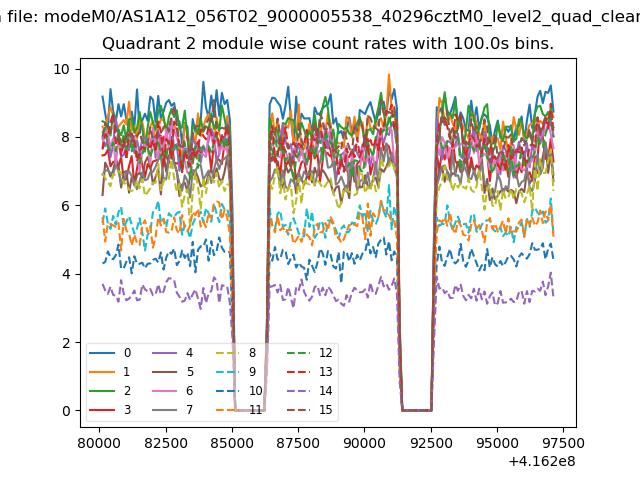
| Module-wise count rates for Quadrant B Data is divided into 100 sec bins |
 |
 |
| Module-wise count rates for Quadrant C Data is divided into 100 sec bins |
 |
 |
| Module-wise count rates for Quadrant D Data is divided into 100 sec bins |
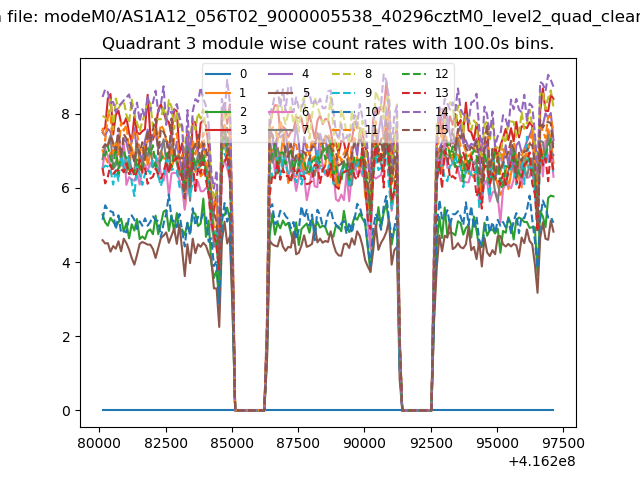 |
 |
| Parameter | Plot |
|---|---|
| CZT HV Monitor | 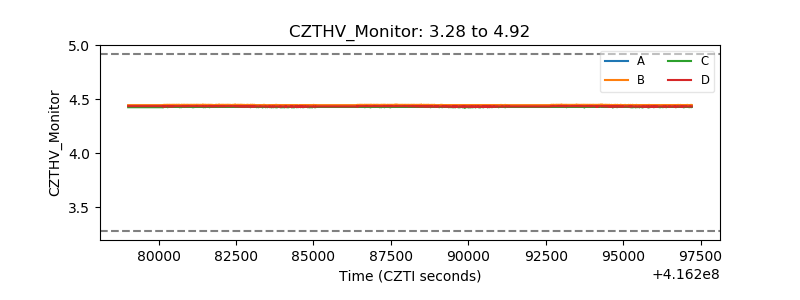 |
| D_VDD | 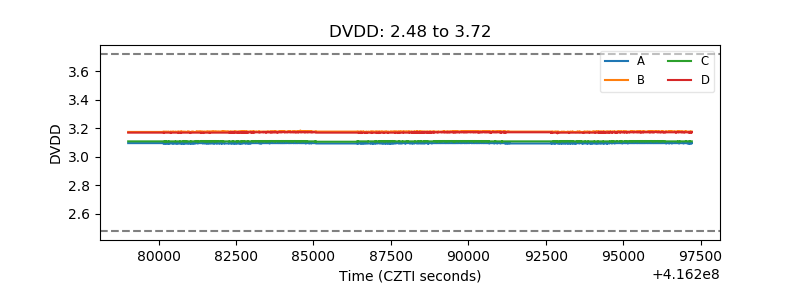 |
| Temperature 1 | 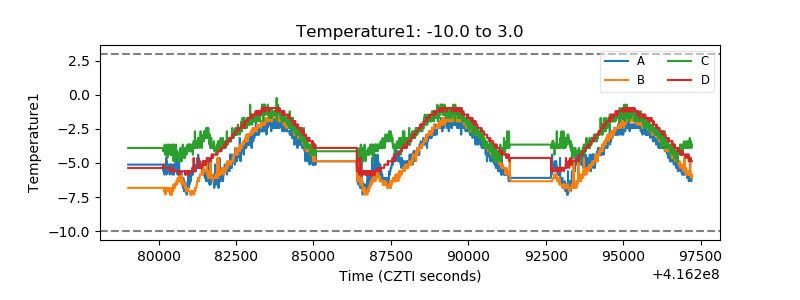 |
| Veto HV Monitor | 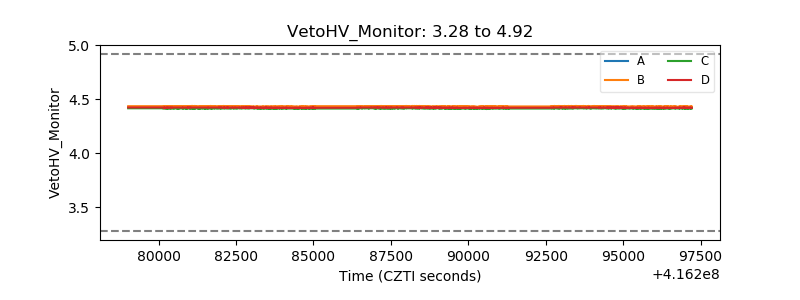 |
| Veto LLD | 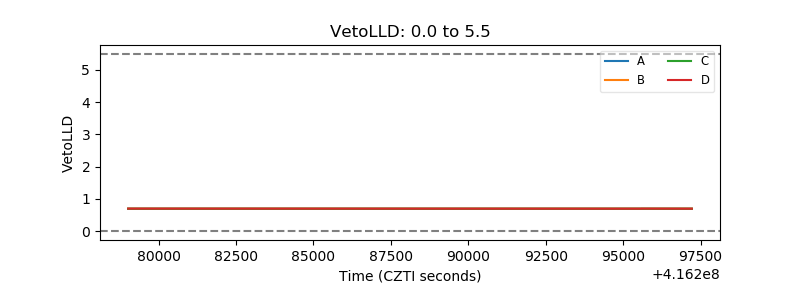 |
| Alpha Counter | 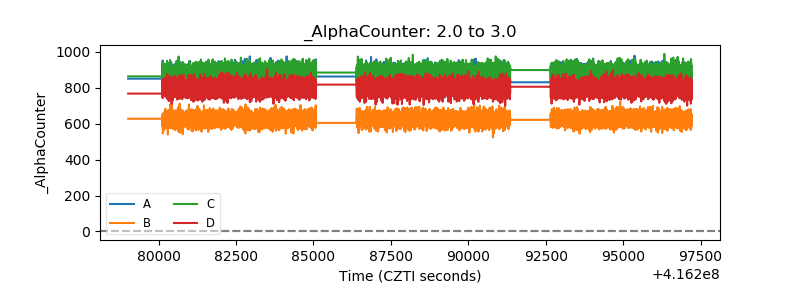 |
| _CPM_Rate | 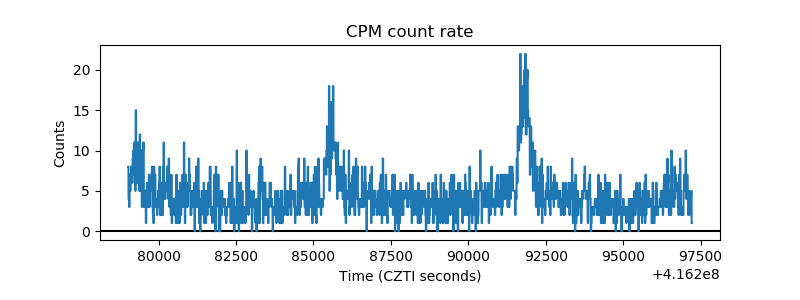 |
| CZT Counter | 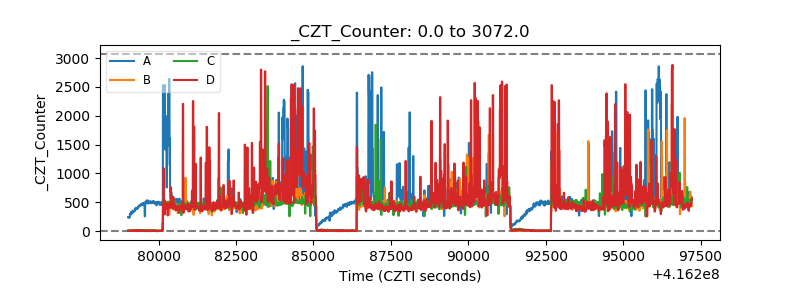 |
| +2.5 Volts monitor | 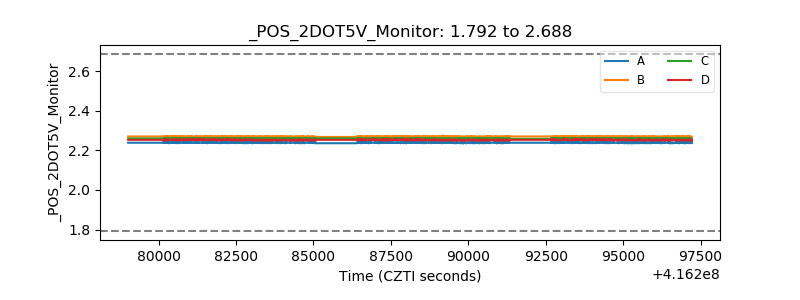 |
| +5 Volts monitor | 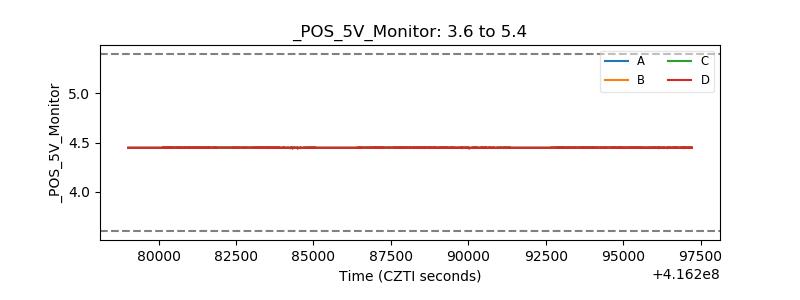 |
| _ROLL_ROT | 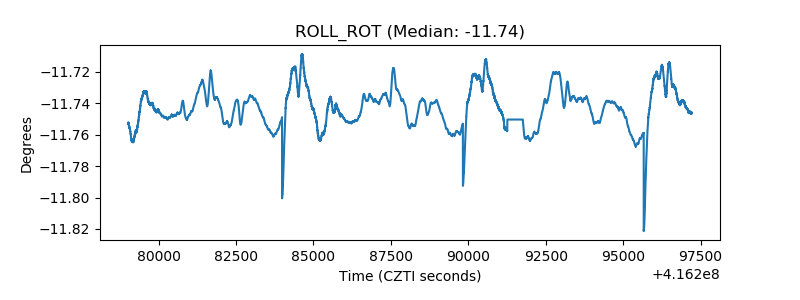 |
| _Roll_DEC | 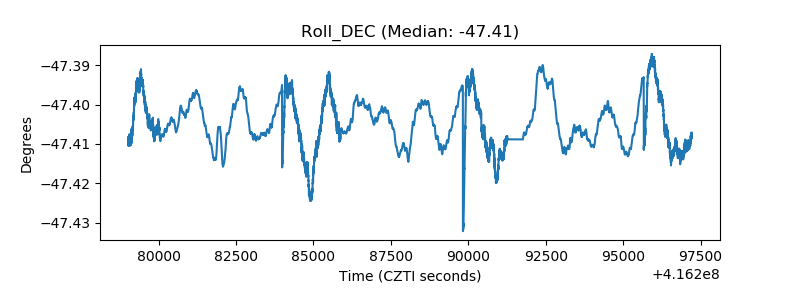 |
| _Roll_RA | 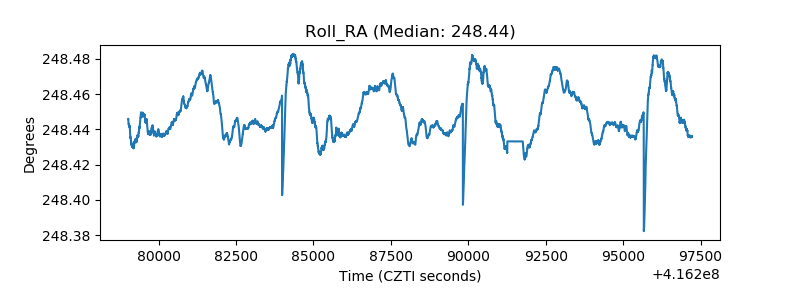 |
| Veto Counter | 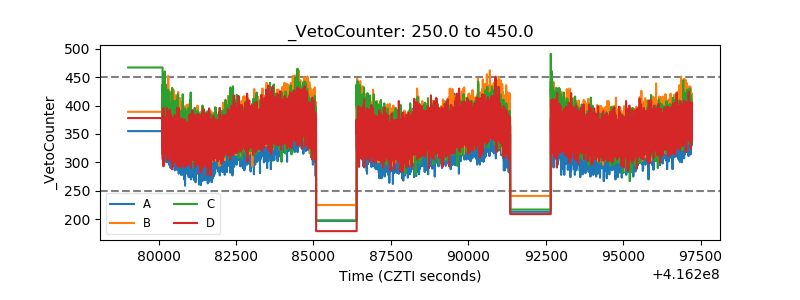 |