| Param | Original file | Final file |
|---|---|---|
| Filename | modeM0/AS1A12_056T02_9000005538_40298cztM0_level2.fits | modeM0/AS1A12_056T02_9000005538_40298cztM0_level2_quad_clean.evt |
| Size (bytes) | 1,058,777,280 | 257,581,440 |
| Size | 1009.7 MB | 245.6 MB |
| Events in quadrant A | 9,297,190 | 1,722,509 |
| Events in quadrant B | 7,469,177 | 1,801,569 |
| Events in quadrant C | 8,842,076 | 1,723,999 |
| Events in quadrant D | 12,390,182 | 1,486,771 |
| Mode M0 | |||
|---|---|---|---|
| Quadrant | BADHDUFLAG | Total packets | Discarded packets |
| A | 0 | 36606 | 5 |
| B | 0 | 32220 | 4 |
| C | 0 | 35706 | 4 |
| D | 0 | 47192 | 4 |
| Mode M9 | |||
|---|---|---|---|
| Quadrant | BADHDUFLAG | Total packets | Discarded packets |
| A | 0 | 63 | 0 |
| B | 0 | 63 | 0 |
| C | 0 | 63 | 0 |
| D | 0 | 63 | 0 |
| Mode SS | |||
|---|---|---|---|
| Quadrant | BADHDUFLAG | Total packets | Discarded packets |
| A | 0 | 316 | 0 |
| B | 0 | 316 | 0 |
| C | 0 | 316 | 0 |
| D | 0 | 316 | 0 |
| Quadrant | Total seconds | Saturated seconds | Saturation percentage |
|---|---|---|---|
| A | 15425 | 384 | 2.489465% |
| B | 15425 | 56 | 0.363047% |
| C | 15425 | 206 | 1.335494% |
| D | 15425 | 1163 | 7.539708% |
Noise dominated data is calculated using 1-second bins in cleaned event files. If a bin has >2000 counts, and if more than 50% of those come from <1% of pixels, then it is considered to be noise-dominated and hence unusable.
| Quadrant | # 1 sec bins | Bins with >0 counts | Bins with >2000 counts | High rate bins dominated by noise | Noise dominated (total time) | Noise dominated (detector-on time) | Marked lightcurve |
|---|---|---|---|---|---|---|---|
| A | 21666 | 15429 | 264 | 264 | 1.22% | 1.71% | 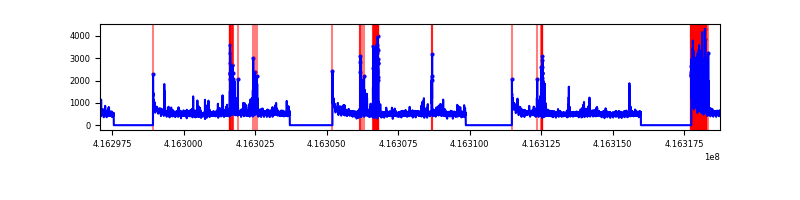 |
| B | 21666 | 15429 | 26 | 26 | 0.12% | 0.17% | 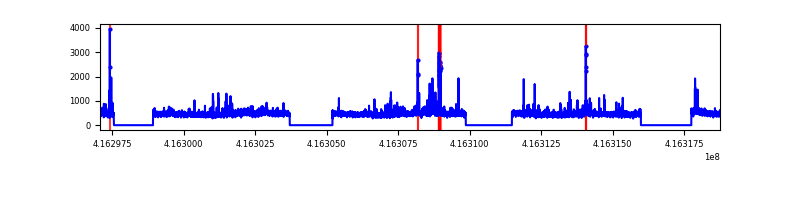 |
| C | 21666 | 15429 | 157 | 157 | 0.72% | 1.02% | 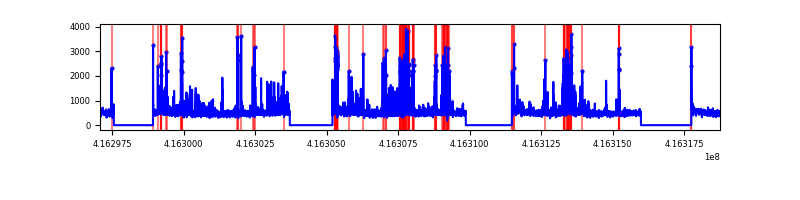 |
| D | 21666 | 15429 | 1097 | 1097 | 5.06% | 7.11% | 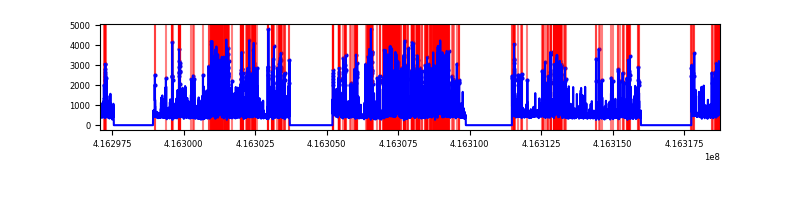 |
Top three noisy pixels from each quadrant. If the there are fewer than three noisy pixels in the level2.evt file, extra rows are filled as -1
| Pixel properties | Quadrant properties | ||||||
|---|---|---|---|---|---|---|---|
| Quadrant | DetID | PixID | Counts | Sigma | Mean | Median | Sigma |
| A | 10 | 83 | 1220477 | 3478.52 | 1736 | 1705 | 350.4 |
| A | 13 | 248 | 998991 | 2846.37 | 1736 | 1705 | 350.4 |
| A | 12 | 189 | 122679 | 345.27 | 1736 | 1705 | 350.4 |
| B | 0 | 230 | 162402 | 482.79 | 1736 | 1688 | 332.9 |
| B | 0 | 245 | 137361 | 407.56 | 1736 | 1688 | 332.9 |
| B | 5 | 255 | 102625 | 303.22 | 1736 | 1688 | 332.9 |
| C | 14 | 254 | 988772 | 2525.48 | 1697 | 1712 | 390.8 |
| C | 15 | 214 | 645411 | 1646.96 | 1697 | 1712 | 390.8 |
| C | 9 | 187 | 513722 | 1310.02 | 1697 | 1712 | 390.8 |
| D | 12 | 227 | 3215083 | 7852.84 | 1661 | 1614 | 409.2 |
| D | 12 | 233 | 1487666 | 3631.5 | 1661 | 1614 | 409.2 |
| D | 1 | 47 | 686415 | 1673.47 | 1661 | 1614 | 409.2 |
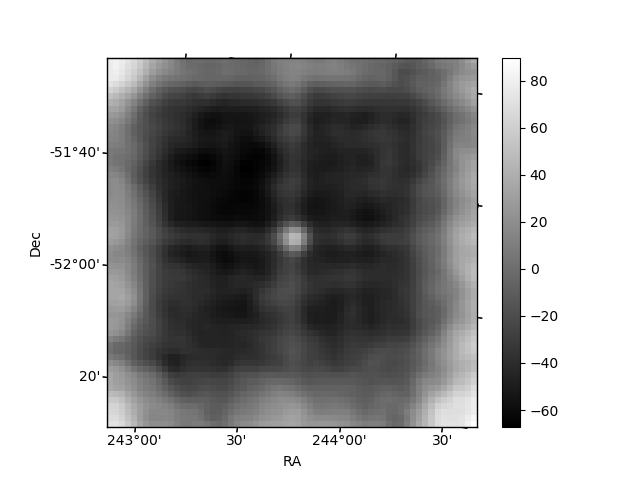
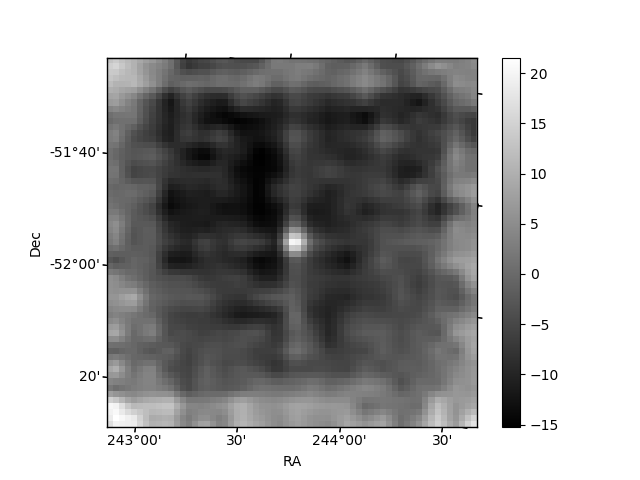
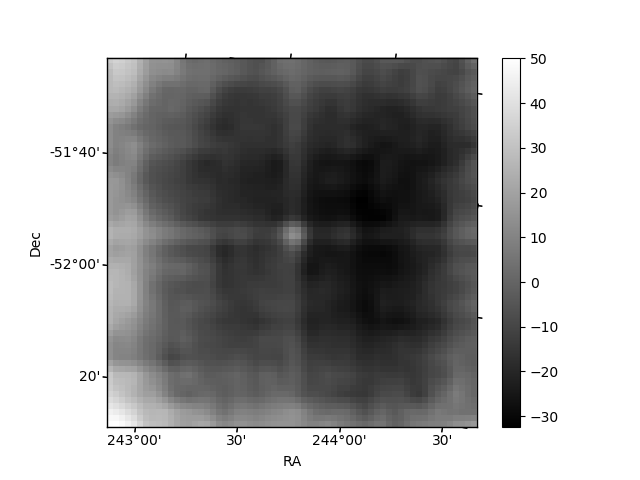
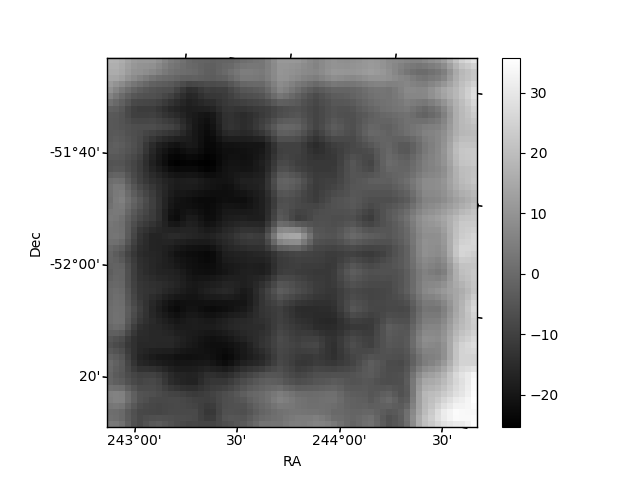
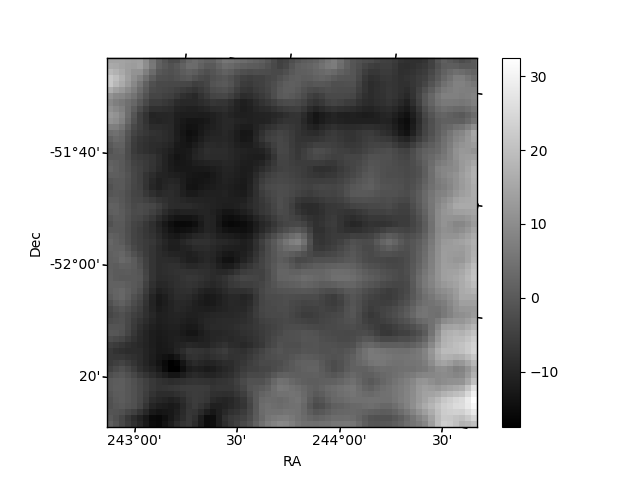
Histogram calculated using DETX and DETY for each event in the final _common_clean file
| Quadrant A | 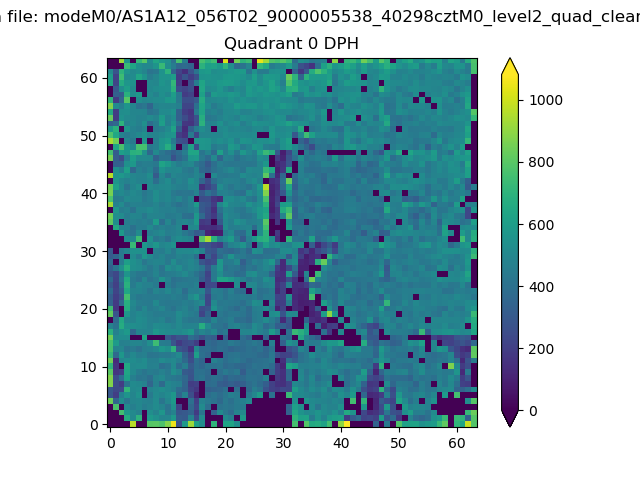 |
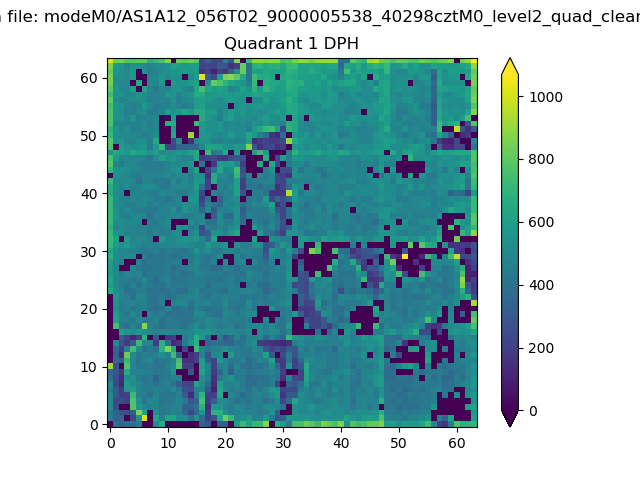 |
Quadrant B |
|---|---|---|---|
| Quadrant D | 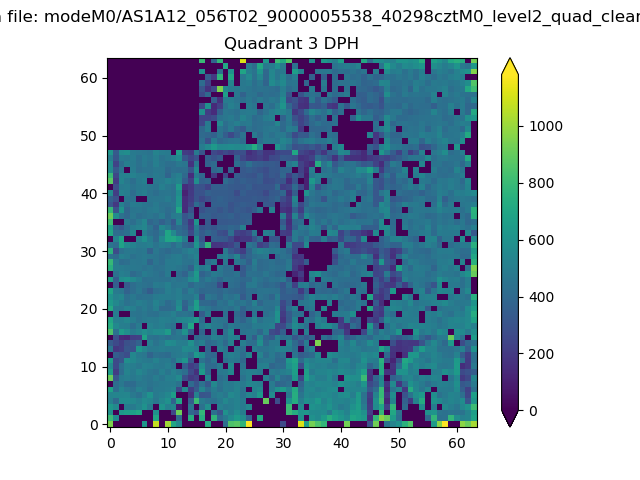 |
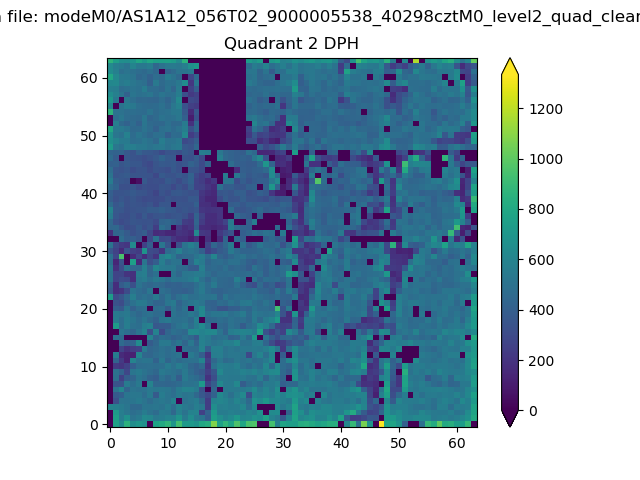 |
Quadrant C |
| Plot type | Count rate plots | Images |
|---|---|---|
| Comparison with Poisson distribution Blue bars denote a histogram of data divided into 1 sec bins. Red curve is a Poisson curve with rate = median count rate of data. |
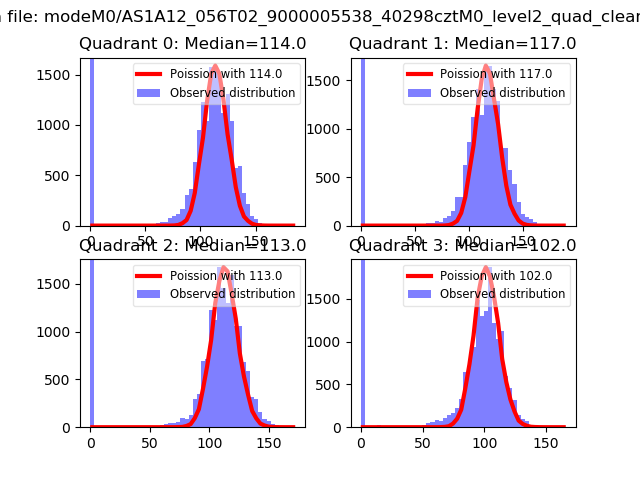 |
 |
| Quadrant-wise count rates Data is divided into 100 sec bins |
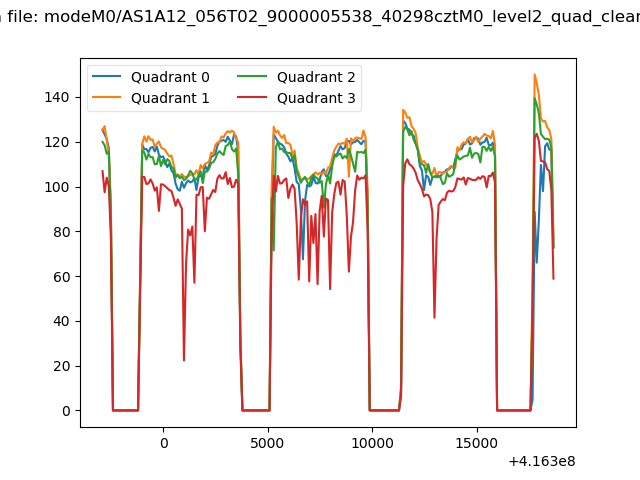 |
|
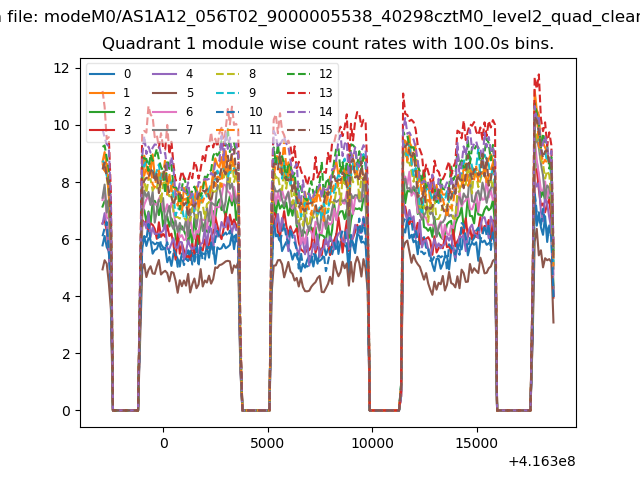
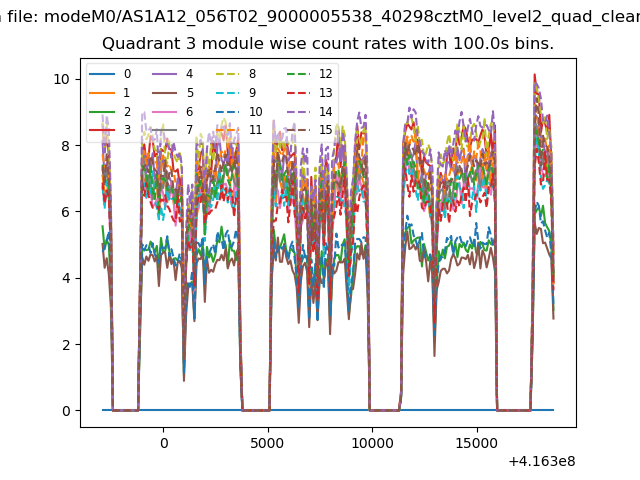
| Module-wise count rates for Quadrant A Data is divided into 100 sec bins |
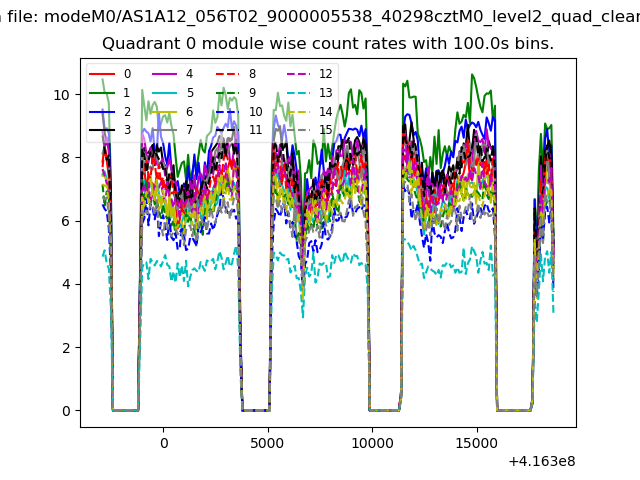 |
 |
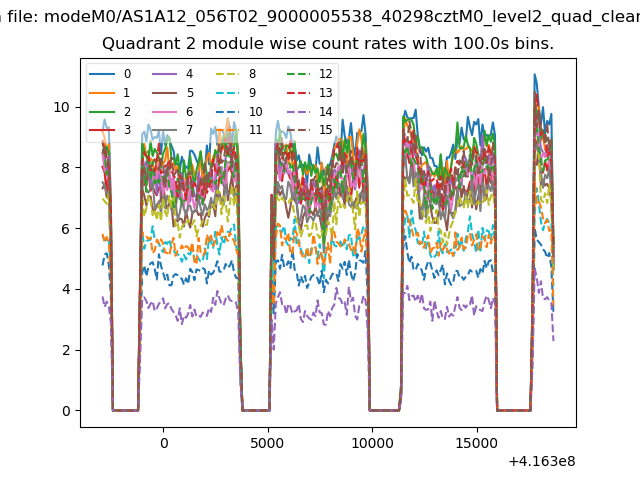
| Module-wise count rates for Quadrant B Data is divided into 100 sec bins |
 |
 |
| Module-wise count rates for Quadrant C Data is divided into 100 sec bins |
 |
 |
| Module-wise count rates for Quadrant D Data is divided into 100 sec bins |
 |
 |
| Parameter | Plot |
|---|---|
| CZT HV Monitor | 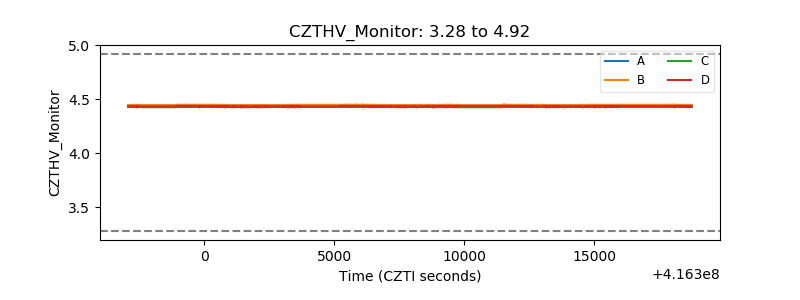 |
| D_VDD | 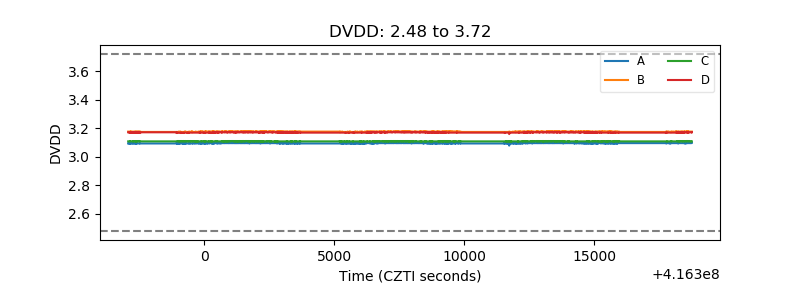 |
| Temperature 1 | 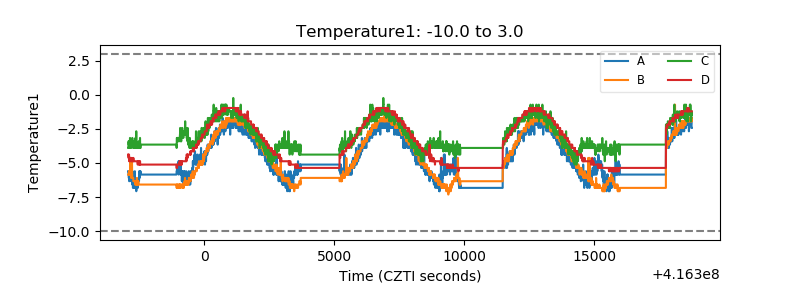 |
| Veto HV Monitor | 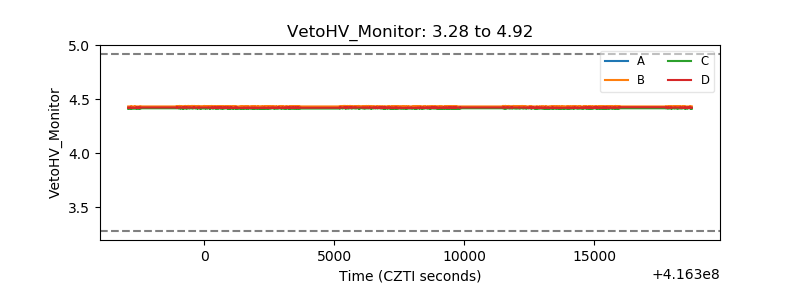 |
| Veto LLD | 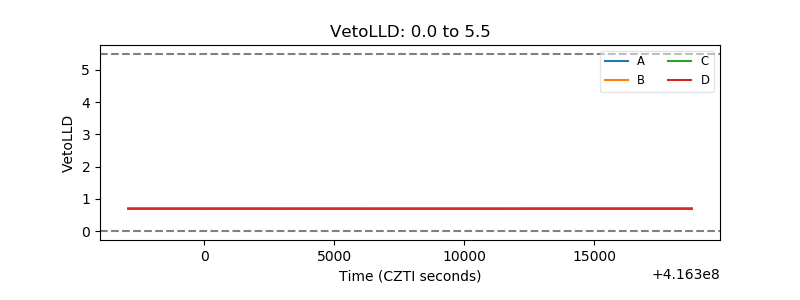 |
| Alpha Counter | 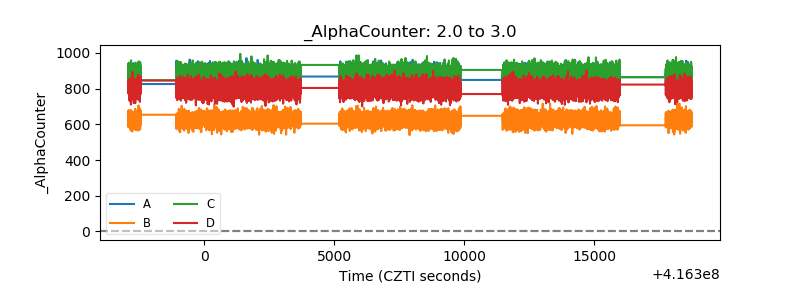 |
| _CPM_Rate | 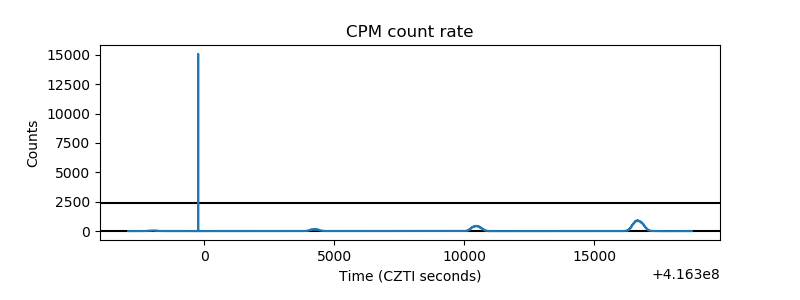 |
| CZT Counter | 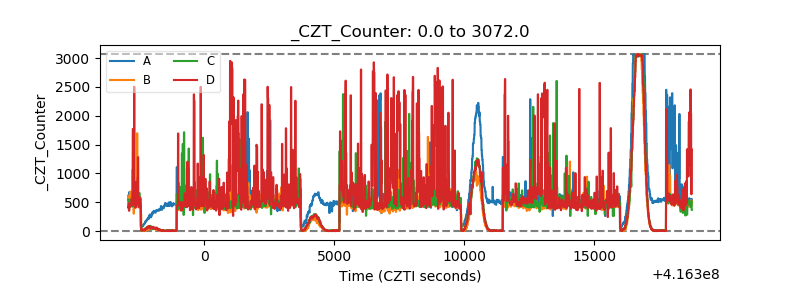 |
| +2.5 Volts monitor | 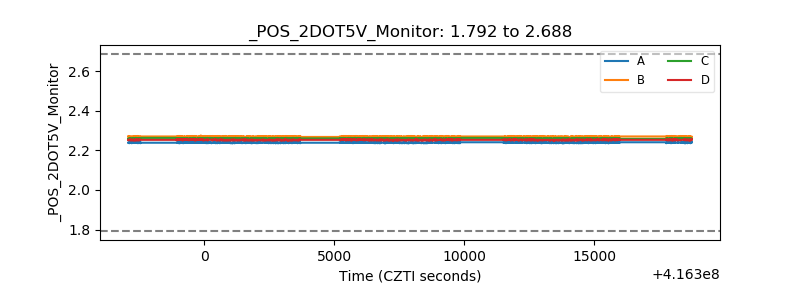 |
| +5 Volts monitor | 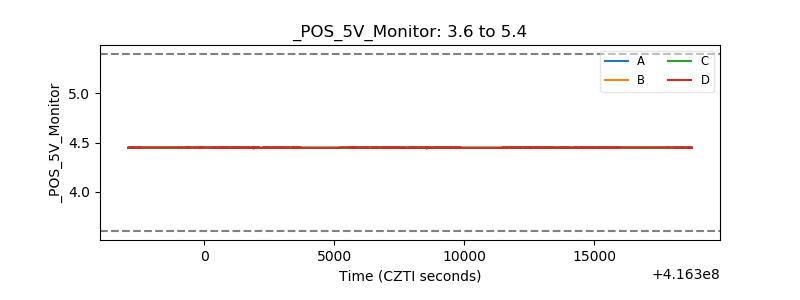 |
| _ROLL_ROT | 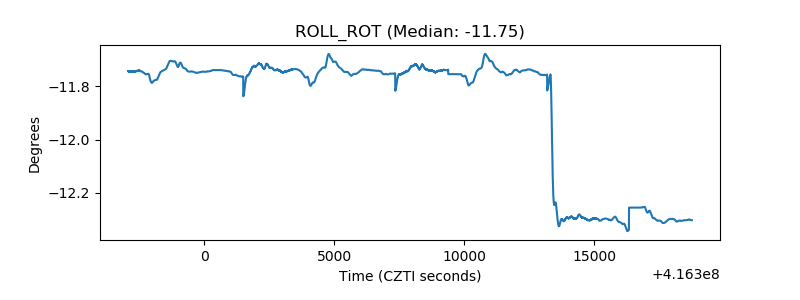 |
| _Roll_DEC | 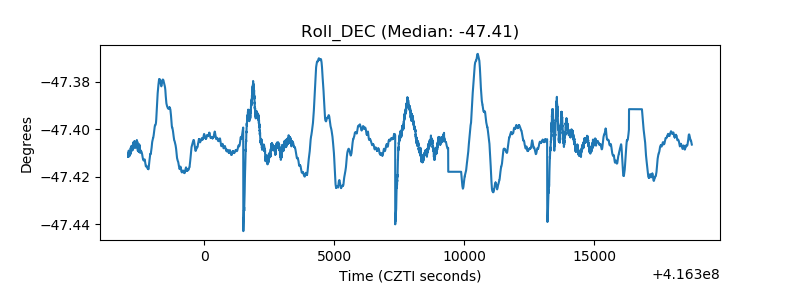 |
| _Roll_RA | 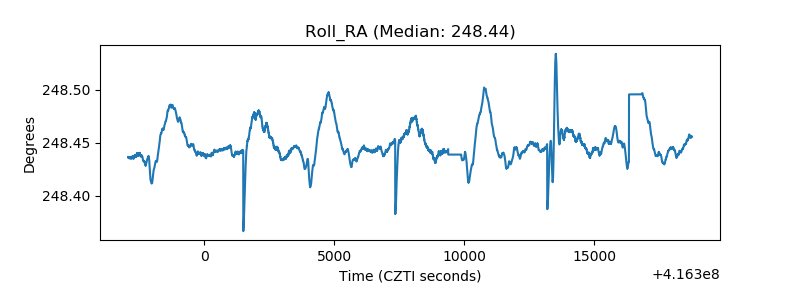 |
| Veto Counter | 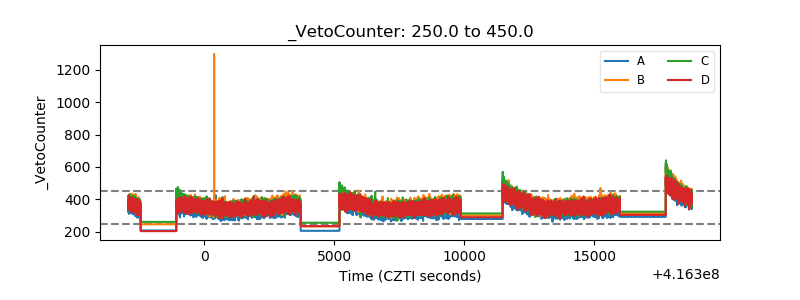 |