| Param | Original file | Final file |
|---|---|---|
| Filename | modeM0/AS1A12_056T02_9000005538_40299cztM0_level2.fits | modeM0/AS1A12_056T02_9000005538_40299cztM0_level2_quad_clean.evt |
| Size (bytes) | 381,432,960 | 97,968,960 |
| Size | 363.8 MB | 93.4 MB |
| Events in quadrant A | 4,173,312 | 635,004 |
| Events in quadrant B | 2,746,354 | 696,667 |
| Events in quadrant C | 2,706,328 | 663,247 |
| Events in quadrant D | 4,070,094 | 590,606 |
| Mode M0 | |||
|---|---|---|---|
| Quadrant | BADHDUFLAG | Total packets | Discarded packets |
| A | 0 | 15706 | 3 |
| B | 0 | 11496 | 2 |
| C | 0 | 11237 | 2 |
| D | 0 | 15712 | 2 |
| Mode M9 | |||
|---|---|---|---|
| Quadrant | BADHDUFLAG | Total packets | Discarded packets |
| A | 0 | 26 | 0 |
| B | 0 | 26 | 0 |
| C | 0 | 26 | 0 |
| D | 0 | 27 | 0 |
| Mode SS | |||
|---|---|---|---|
| Quadrant | BADHDUFLAG | Total packets | Discarded packets |
| A | 0 | 112 | 0 |
| B | 0 | 112 | 0 |
| C | 0 | 112 | 0 |
| D | 0 | 112 | 0 |
| Quadrant | Total seconds | Saturated seconds | Saturation percentage |
|---|---|---|---|
| A | 5439 | 428 | 7.869094% |
| B | 5439 | 22 | 0.404486% |
| C | 5439 | 10 | 0.183857% |
| D | 5439 | 282 | 5.184777% |
Noise dominated data is calculated using 1-second bins in cleaned event files. If a bin has >2000 counts, and if more than 50% of those come from <1% of pixels, then it is considered to be noise-dominated and hence unusable.
| Quadrant | # 1 sec bins | Bins with >0 counts | Bins with >2000 counts | High rate bins dominated by noise | Noise dominated (total time) | Noise dominated (detector-on time) | Marked lightcurve |
|---|---|---|---|---|---|---|---|
| A | 7292 | 5440 | 303 | 303 | 4.16% | 5.57% | 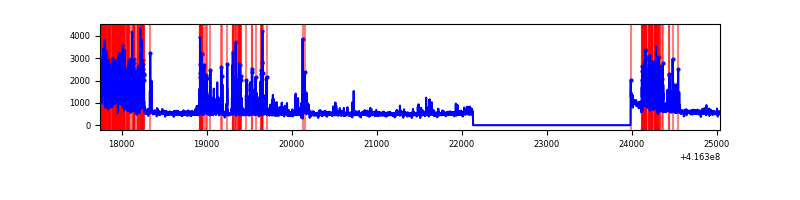 |
| B | 7292 | 5440 | 9 | 9 | 0.12% | 0.17% | 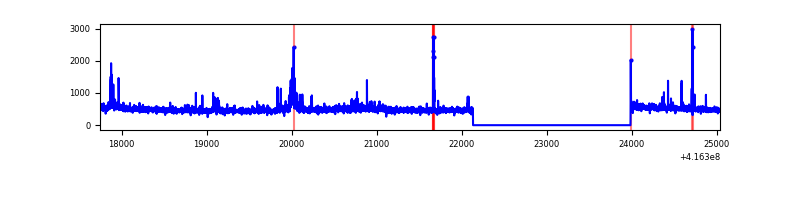 |
| C | 7292 | 5440 | 5 | 5 | 0.07% | 0.09% | 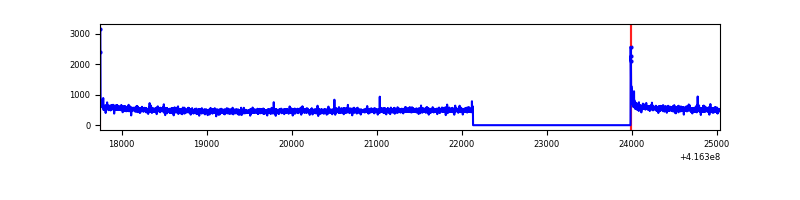 |
| D | 7292 | 5440 | 283 | 283 | 3.88% | 5.20% | 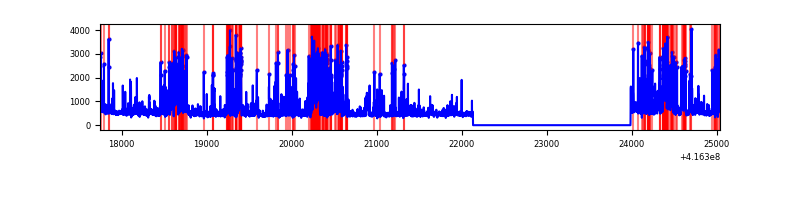 |
Top three noisy pixels from each quadrant. If the there are fewer than three noisy pixels in the level2.evt file, extra rows are filled as -1
| Pixel properties | Quadrant properties | ||||||
|---|---|---|---|---|---|---|---|
| Quadrant | DetID | PixID | Counts | Sigma | Mean | Median | Sigma |
| A | 13 | 248 | 1122020 | 8801.84 | 626 | 614 | 127.4 |
| A | 10 | 83 | 477749 | 3745.0 | 626 | 614 | 127.4 |
| A | 12 | 189 | 58697 | 455.89 | 626 | 614 | 127.4 |
| B | 4 | 170 | 64414 | 526.07 | 638 | 622 | 121.3 |
| B | 5 | 255 | 46454 | 377.96 | 638 | 622 | 121.3 |
| B | 0 | 245 | 44233 | 359.64 | 638 | 622 | 121.3 |
| C | 15 | 214 | 231639 | 1600.82 | 622 | 629 | 144.3 |
| C | 0 | 10 | 29420 | 199.51 | 622 | 629 | 144.3 |
| C | 14 | 254 | 9804 | 63.58 | 622 | 629 | 144.3 |
| D | 1 | 47 | 996265 | 6617.66 | 612 | 596 | 150.5 |
| D | 12 | 227 | 336364 | 2231.67 | 612 | 596 | 150.5 |
| D | 12 | 233 | 204134 | 1352.81 | 612 | 596 | 150.5 |
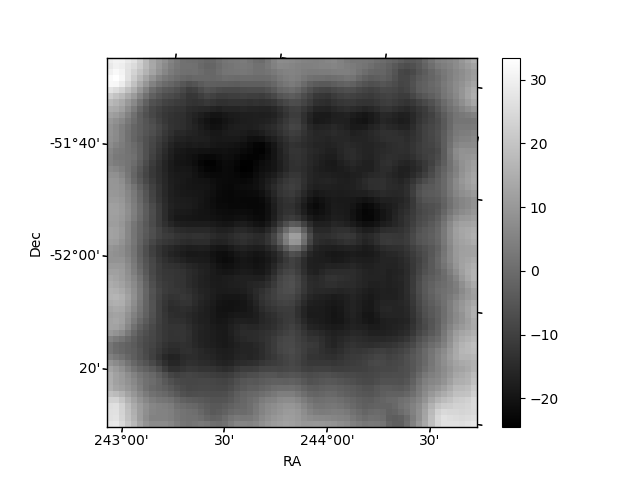
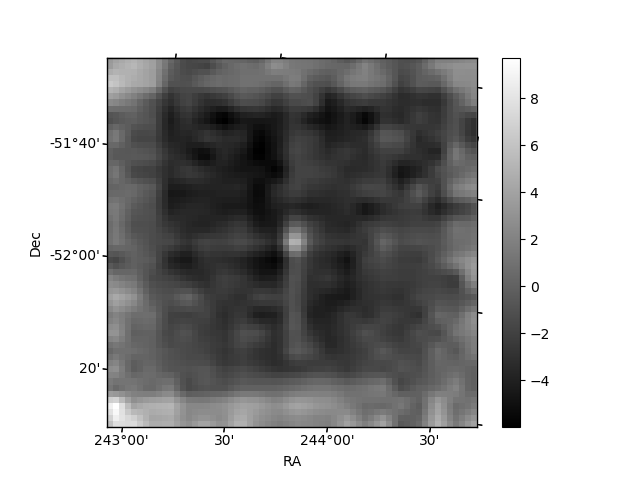
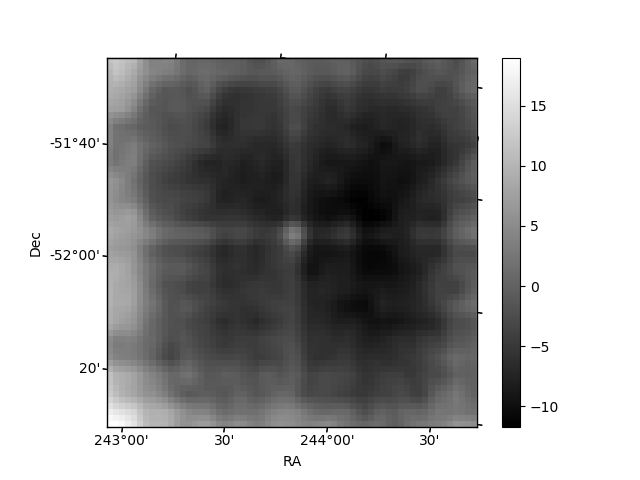
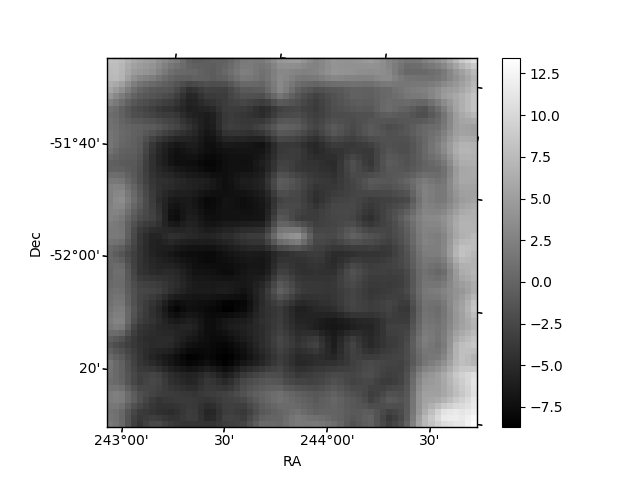
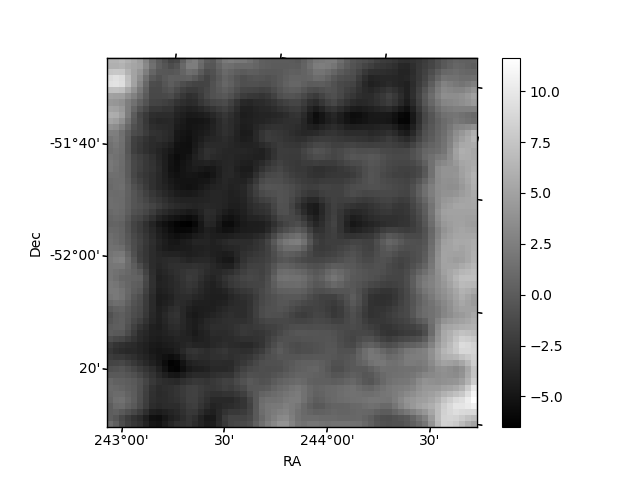
Histogram calculated using DETX and DETY for each event in the final _common_clean file
| Quadrant A | 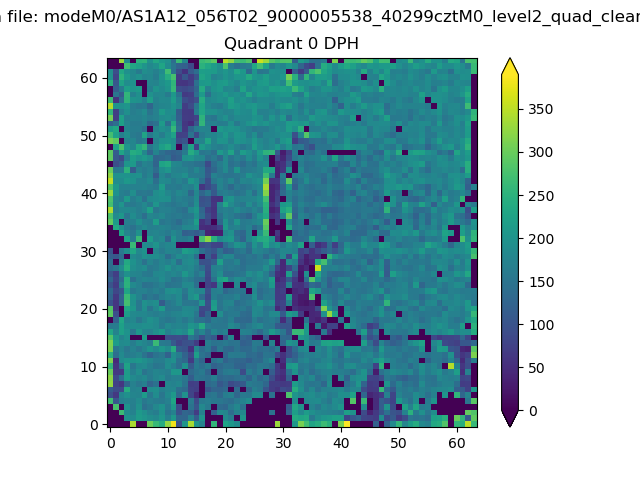 |
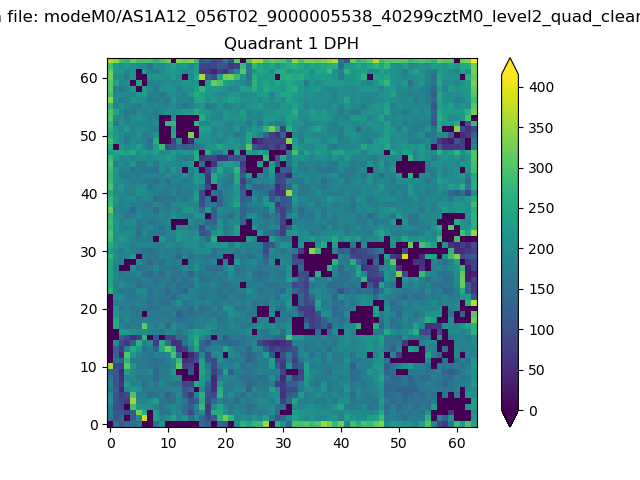 |
Quadrant B |
|---|---|---|---|
| Quadrant D | 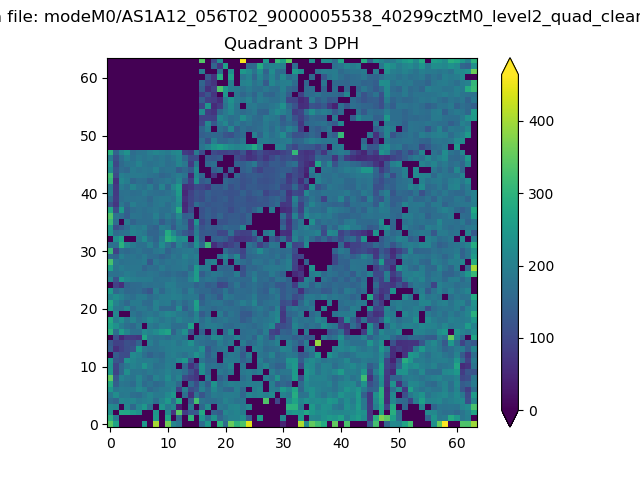 |
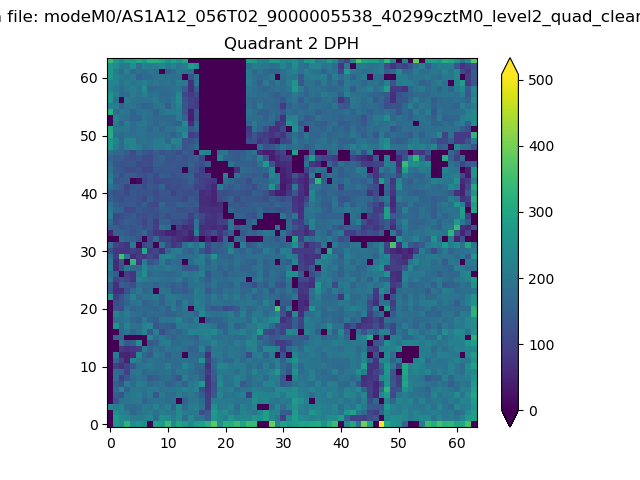 |
Quadrant C |
| Plot type | Count rate plots | Images |
|---|---|---|
| Comparison with Poisson distribution Blue bars denote a histogram of data divided into 1 sec bins. Red curve is a Poisson curve with rate = median count rate of data. |
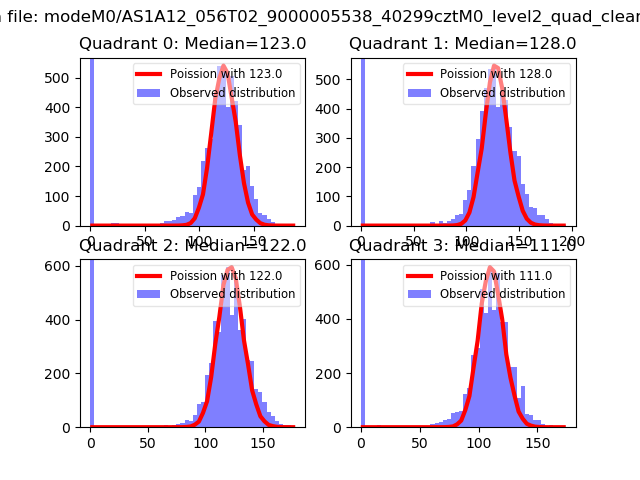 |
 |
| Quadrant-wise count rates Data is divided into 100 sec bins |
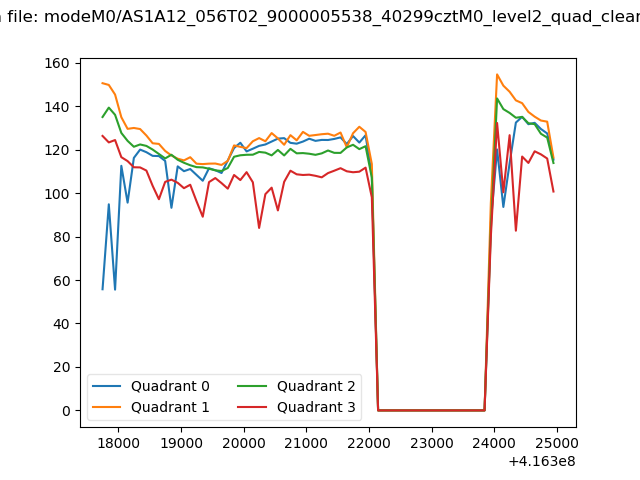 |
|
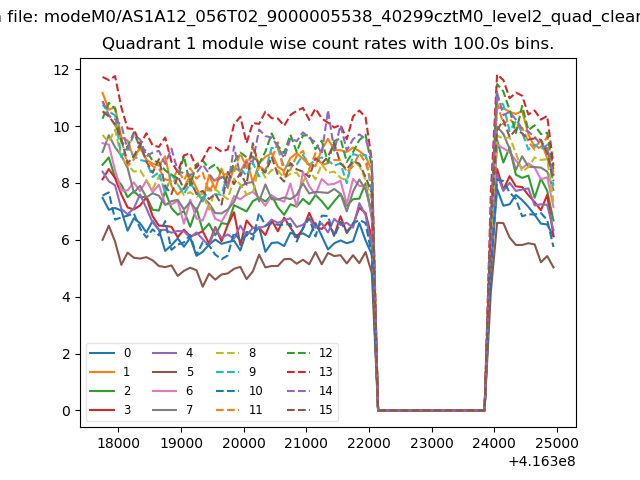
| Module-wise count rates for Quadrant A Data is divided into 100 sec bins |
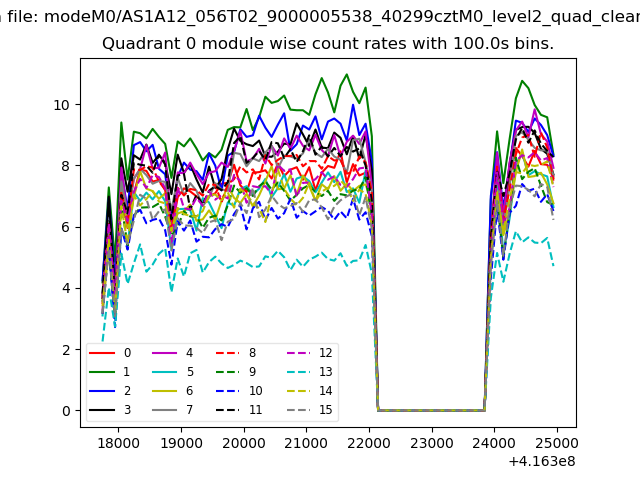 |
 |
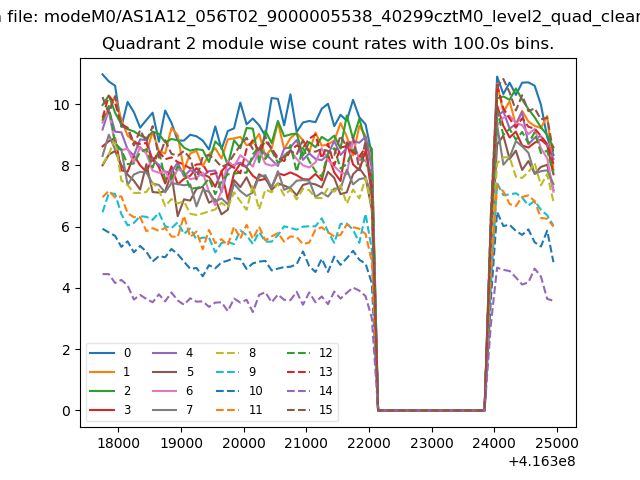
| Module-wise count rates for Quadrant B Data is divided into 100 sec bins |
 |
 |
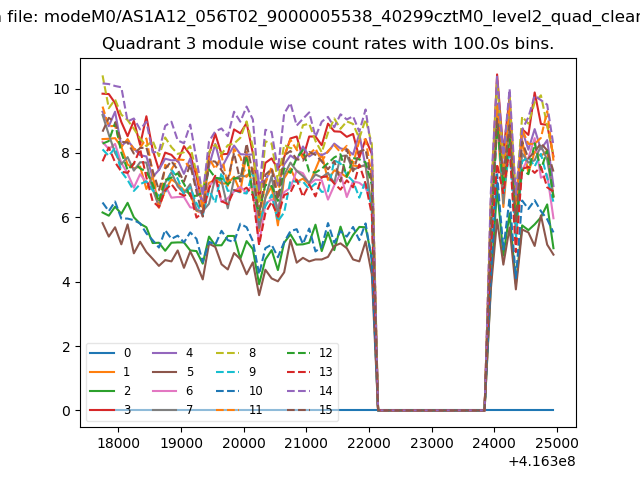
| Module-wise count rates for Quadrant C Data is divided into 100 sec bins |
 |
 |
| Module-wise count rates for Quadrant D Data is divided into 100 sec bins |
 |
 |
| Parameter | Plot |
|---|---|
| CZT HV Monitor | 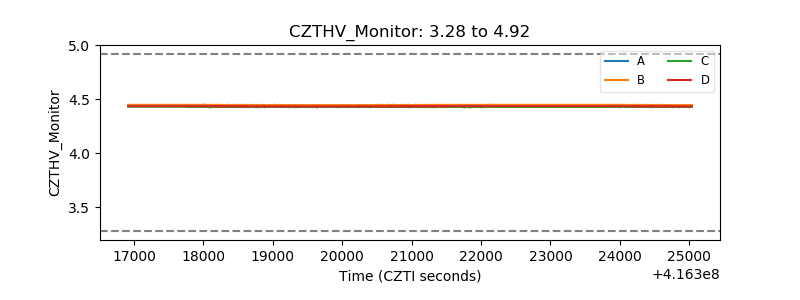 |
| D_VDD | 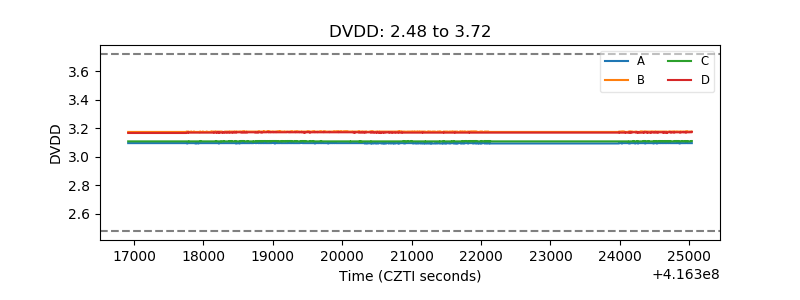 |
| Temperature 1 | 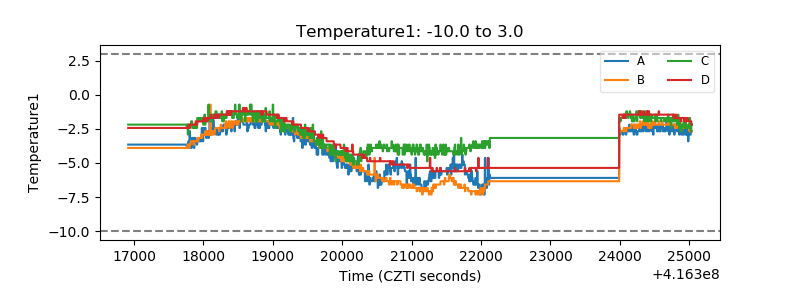 |
| Veto HV Monitor | 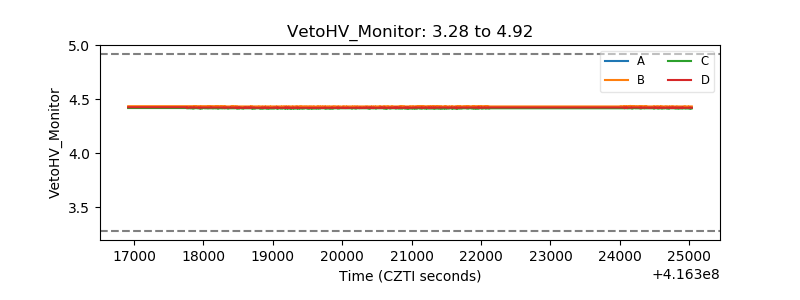 |
| Veto LLD | 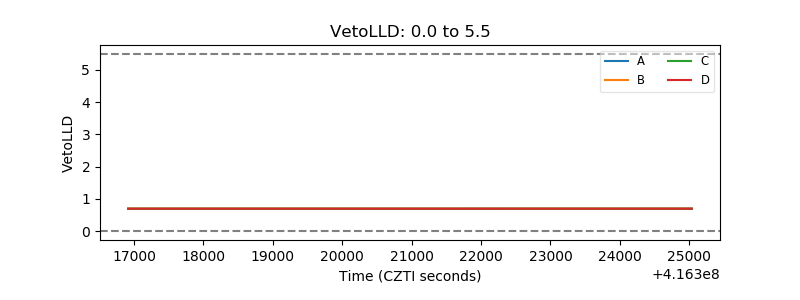 |
| Alpha Counter |  |
| _CPM_Rate | 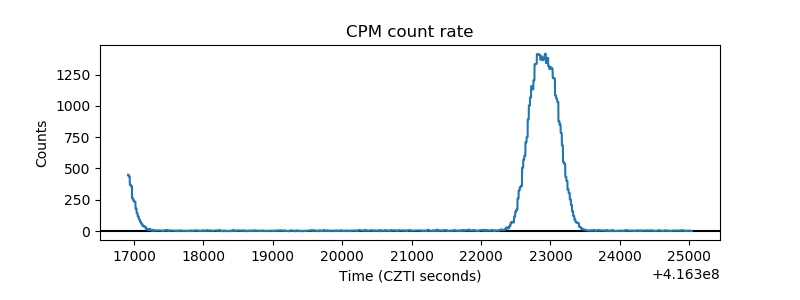 |
| CZT Counter | 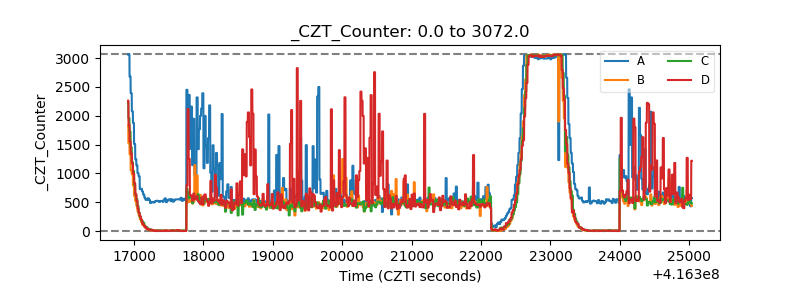 |
| +2.5 Volts monitor | 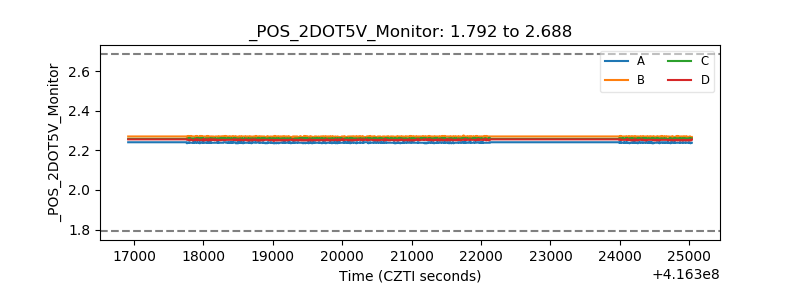 |
| +5 Volts monitor | 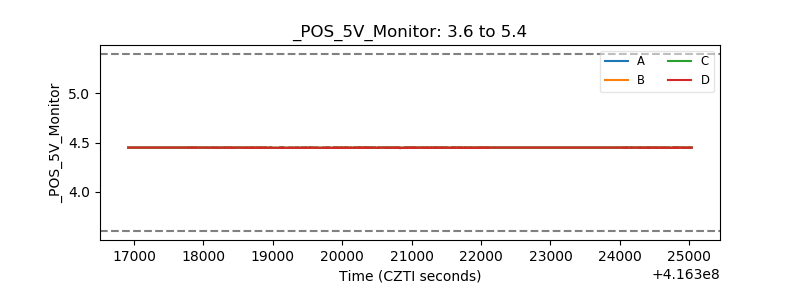 |
| _ROLL_ROT | 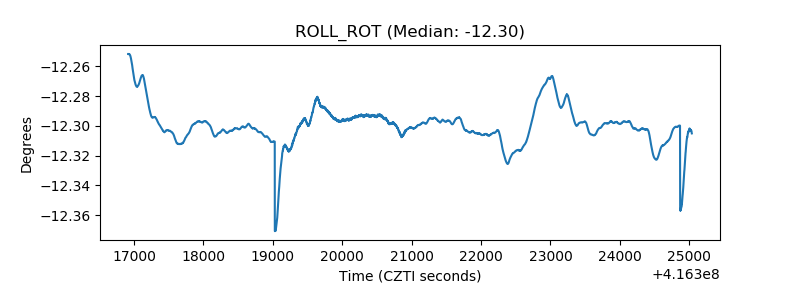 |
| _Roll_DEC | 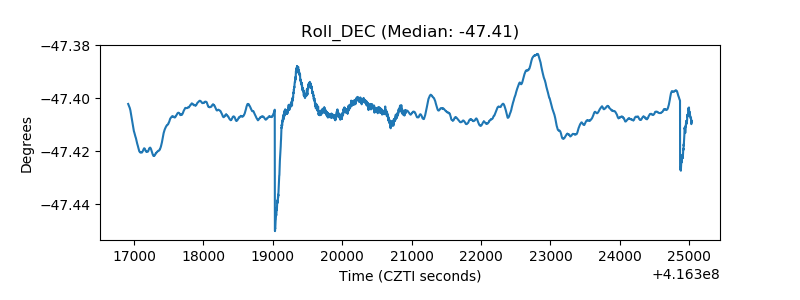 |
| _Roll_RA | 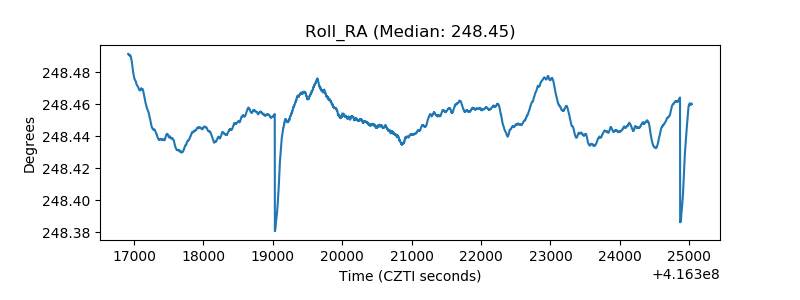 |
| Veto Counter | 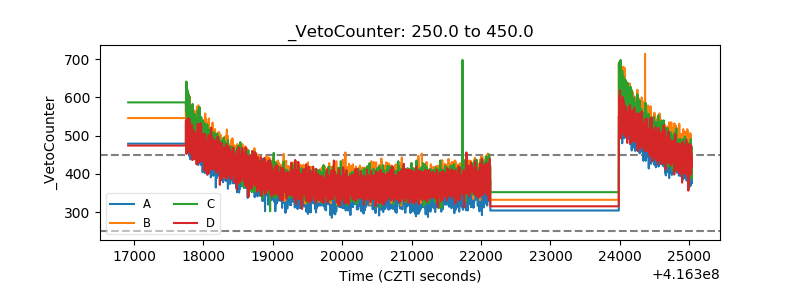 |