| Param | Original file | Final file |
|---|---|---|
| Filename | modeM0/AS1A12_056T02_9000005538_40300cztM0_level2.fits | modeM0/AS1A12_056T02_9000005538_40300cztM0_level2_quad_clean.evt |
| Size (bytes) | 367,320,960 | 99,331,200 |
| Size | 350.3 MB | 94.7 MB |
| Events in quadrant A | 3,363,683 | 683,846 |
| Events in quadrant B | 2,700,345 | 711,718 |
| Events in quadrant C | 3,205,749 | 664,168 |
| Events in quadrant D | 3,919,568 | 581,084 |
| Mode M0 | |||
|---|---|---|---|
| Quadrant | BADHDUFLAG | Total packets | Discarded packets |
| A | 0 | 13124 | 3 |
| B | 0 | 11123 | 2 |
| C | 0 | 12566 | 2 |
| D | 0 | 15096 | 2 |
| Mode M9 | |||
|---|---|---|---|
| Quadrant | BADHDUFLAG | Total packets | Discarded packets |
| A | 0 | 28 | 0 |
| B | 0 | 28 | 0 |
| C | 0 | 28 | 0 |
| D | 0 | 29 | 0 |
| Mode SS | |||
|---|---|---|---|
| Quadrant | BADHDUFLAG | Total packets | Discarded packets |
| A | 0 | 108 | 0 |
| B | 0 | 108 | 0 |
| C | 0 | 108 | 0 |
| D | 0 | 108 | 0 |
| Quadrant | Total seconds | Saturated seconds | Saturation percentage |
|---|---|---|---|
| A | 5239 | 127 | 2.424127% |
| B | 5239 | 14 | 0.267227% |
| C | 5239 | 90 | 1.717885% |
| D | 5239 | 364 | 6.947891% |
Noise dominated data is calculated using 1-second bins in cleaned event files. If a bin has >2000 counts, and if more than 50% of those come from <1% of pixels, then it is considered to be noise-dominated and hence unusable.
| Quadrant | # 1 sec bins | Bins with >0 counts | Bins with >2000 counts | High rate bins dominated by noise | Noise dominated (total time) | Noise dominated (detector-on time) | Marked lightcurve |
|---|---|---|---|---|---|---|---|
| A | 7242 | 5240 | 78 | 78 | 1.08% | 1.49% | 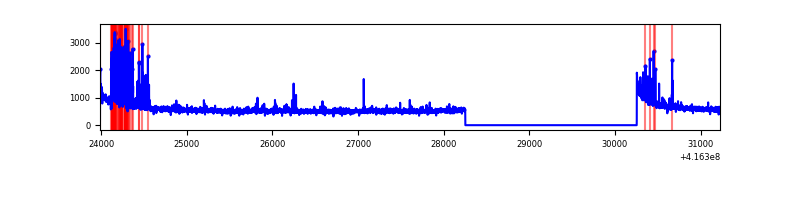 |
| B | 7242 | 5240 | 5 | 5 | 0.07% | 0.10% | 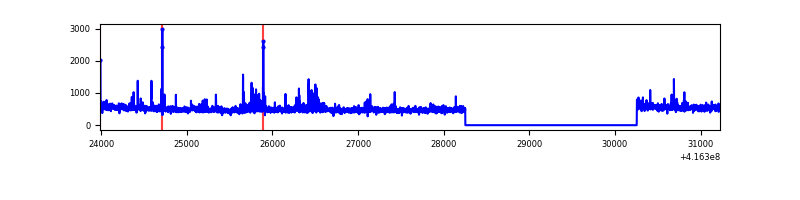 |
| C | 7242 | 5240 | 75 | 75 | 1.04% | 1.43% | 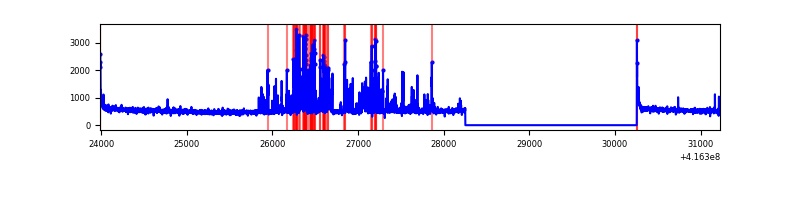 |
| D | 7242 | 5240 | 351 | 351 | 4.85% | 6.70% | 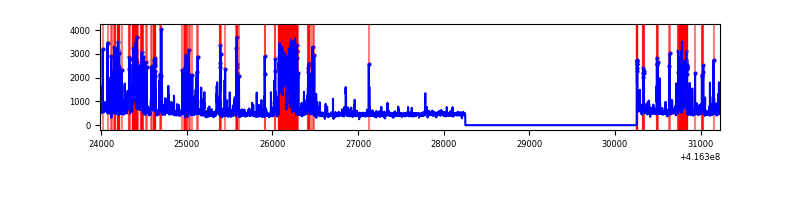 |
Top three noisy pixels from each quadrant. If the there are fewer than three noisy pixels in the level2.evt file, extra rows are filled as -1
| Pixel properties | Quadrant properties | ||||||
|---|---|---|---|---|---|---|---|
| Quadrant | DetID | PixID | Counts | Sigma | Mean | Median | Sigma |
| A | 10 | 83 | 480150 | 3721.11 | 636 | 625 | 128.9 |
| A | 13 | 248 | 315650 | 2444.59 | 636 | 625 | 128.9 |
| A | 12 | 189 | 45549 | 348.61 | 636 | 625 | 128.9 |
| B | 4 | 170 | 66390 | 550.52 | 636 | 623 | 119.5 |
| B | 4 | 171 | 45062 | 371.99 | 636 | 623 | 119.5 |
| B | 0 | 230 | 32974 | 270.8 | 636 | 623 | 119.5 |
| C | 14 | 254 | 550127 | 3902.79 | 613 | 619 | 140.8 |
| C | 15 | 214 | 220837 | 1564.06 | 613 | 619 | 140.8 |
| C | 0 | 10 | 34932 | 243.7 | 613 | 619 | 140.8 |
| D | 1 | 47 | 865578 | 5934.75 | 598 | 582 | 145.8 |
| D | 2 | 250 | 251757 | 1723.32 | 598 | 582 | 145.8 |
| D | 12 | 233 | 225643 | 1544.15 | 598 | 582 | 145.8 |
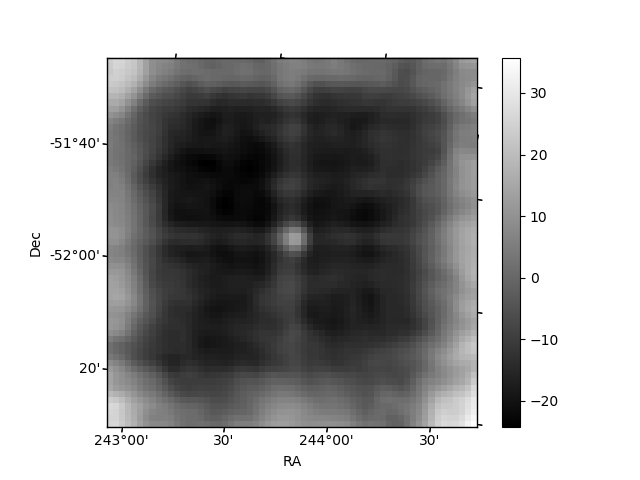
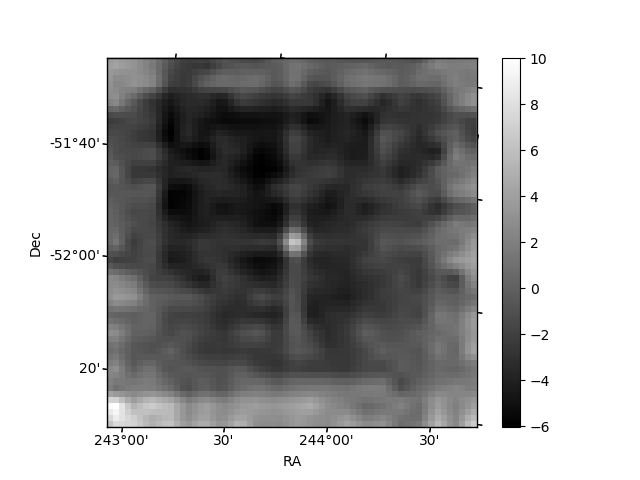
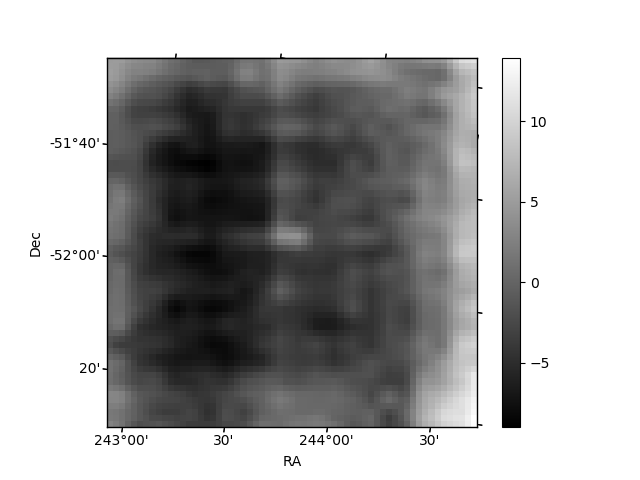
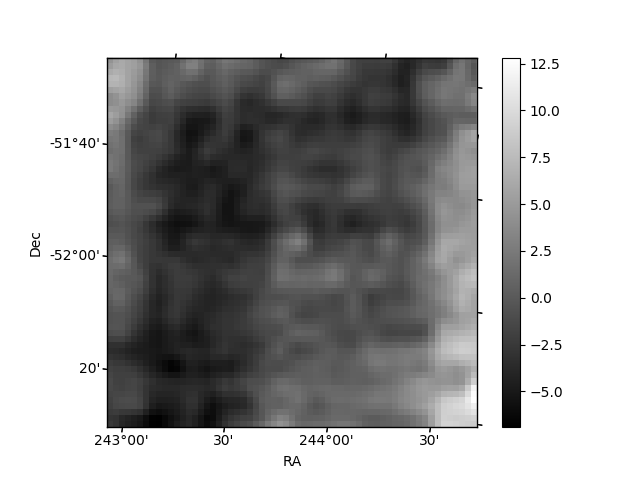
Histogram calculated using DETX and DETY for each event in the final _common_clean file
| Quadrant A | 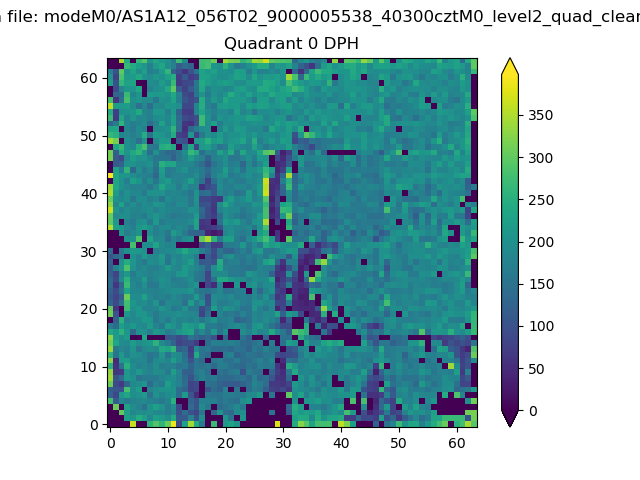 |
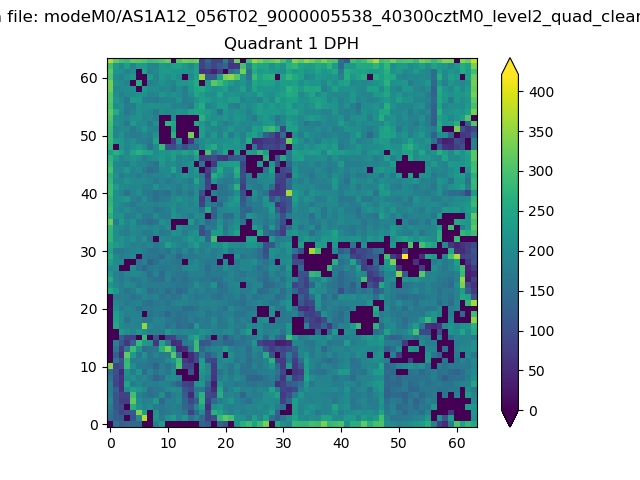 |
Quadrant B |
|---|---|---|---|
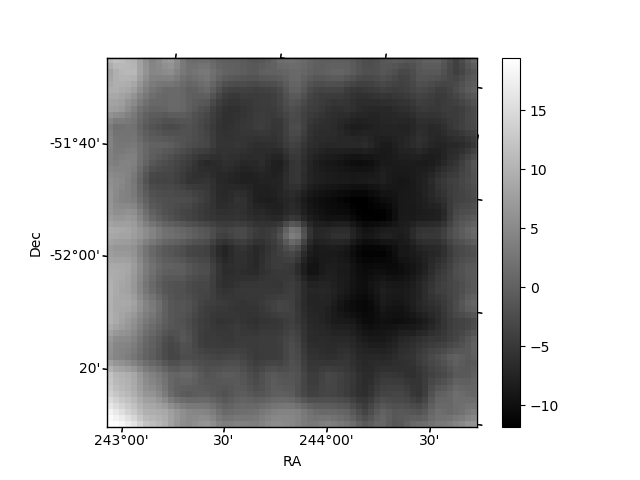
| Quadrant D | 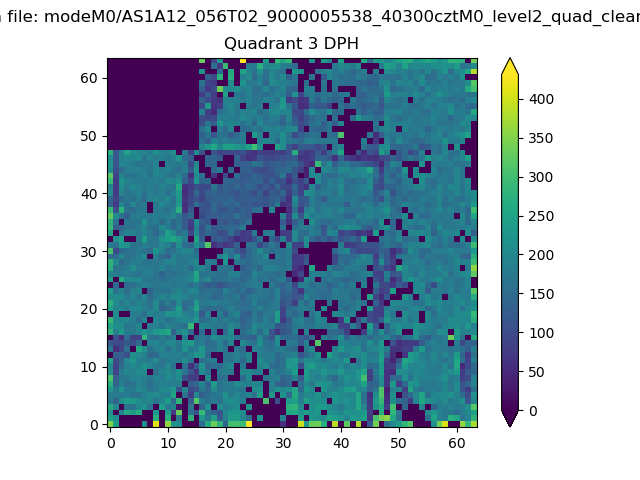 |
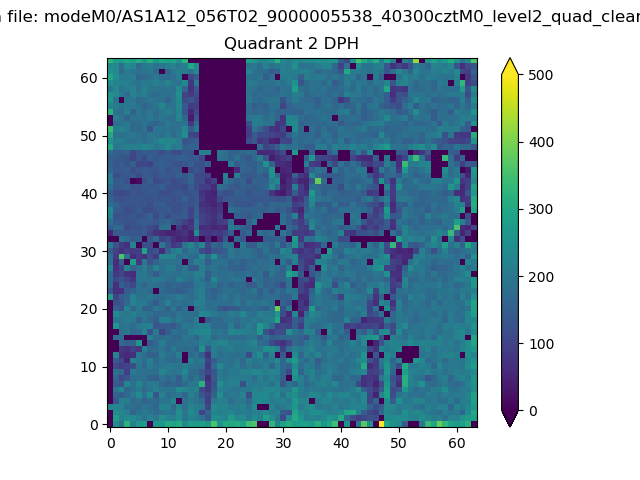 |
Quadrant C |
| Plot type | Count rate plots | Images |
|---|---|---|
| Comparison with Poisson distribution Blue bars denote a histogram of data divided into 1 sec bins. Red curve is a Poisson curve with rate = median count rate of data. |
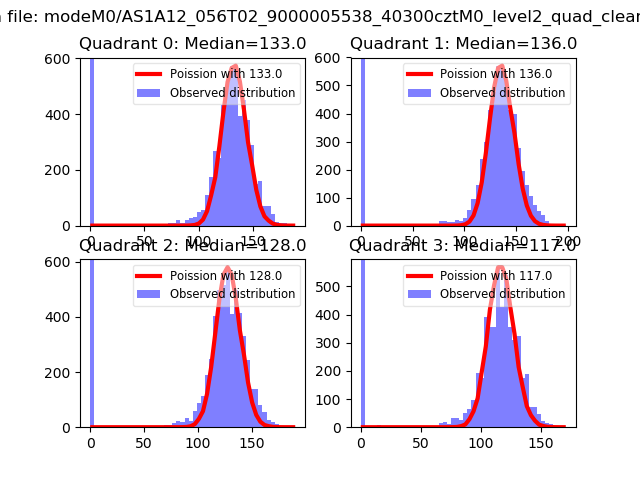 |
 |
| Quadrant-wise count rates Data is divided into 100 sec bins |
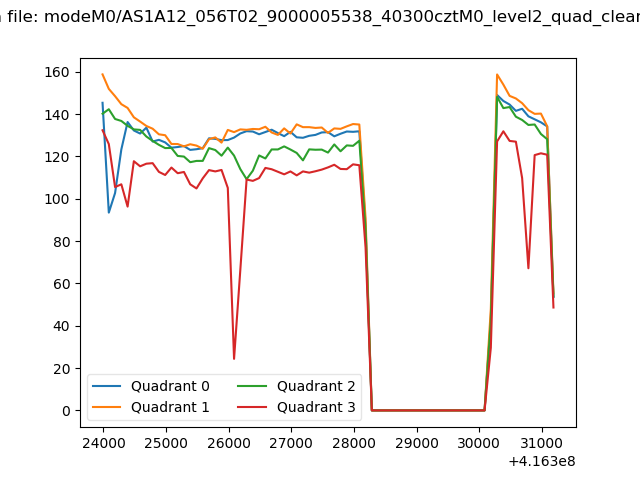 |
|
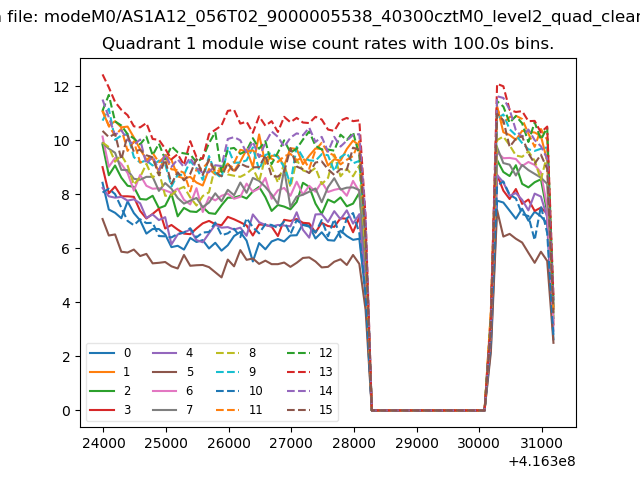
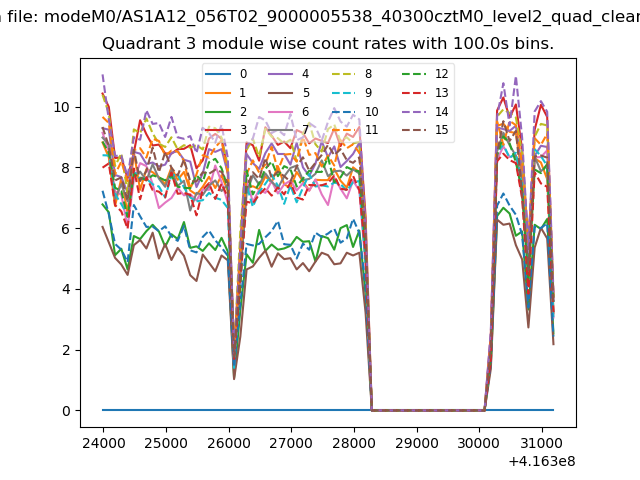
| Module-wise count rates for Quadrant A Data is divided into 100 sec bins |
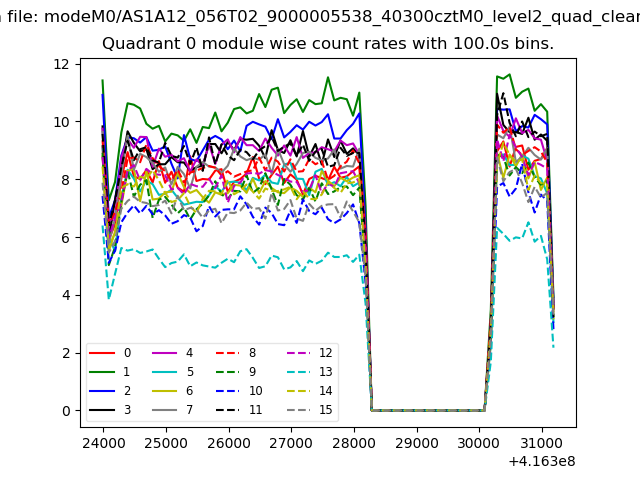 |
 |
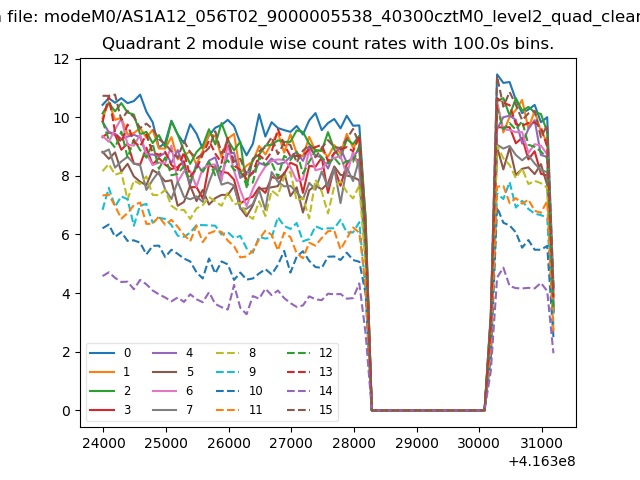
| Module-wise count rates for Quadrant B Data is divided into 100 sec bins |
 |
 |
| Module-wise count rates for Quadrant C Data is divided into 100 sec bins |
 |
 |
| Module-wise count rates for Quadrant D Data is divided into 100 sec bins |
 |
 |
| Parameter | Plot |
|---|---|
| CZT HV Monitor | 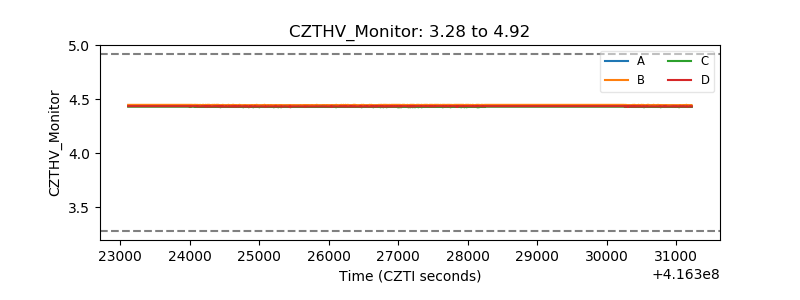 |
| D_VDD | 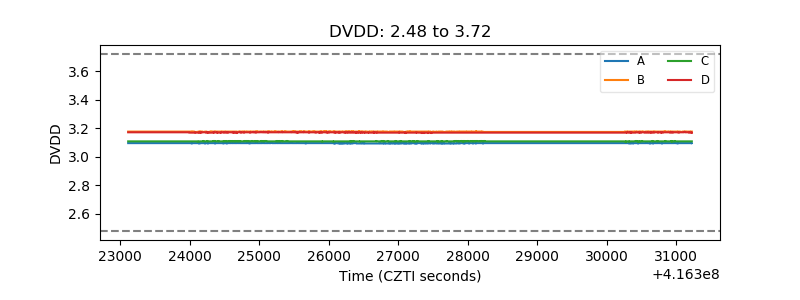 |
| Temperature 1 | 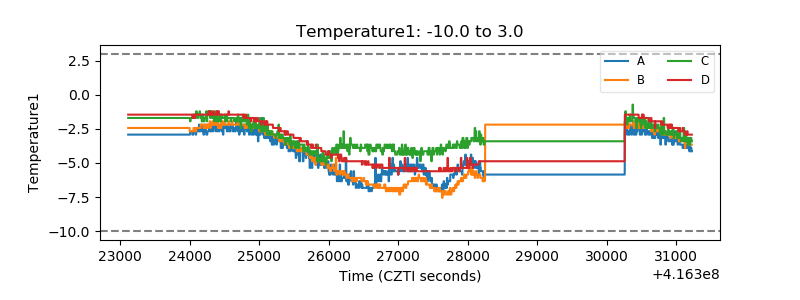 |
| Veto HV Monitor | 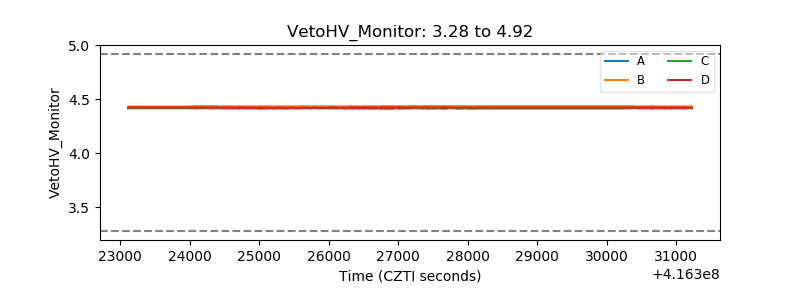 |
| Veto LLD | 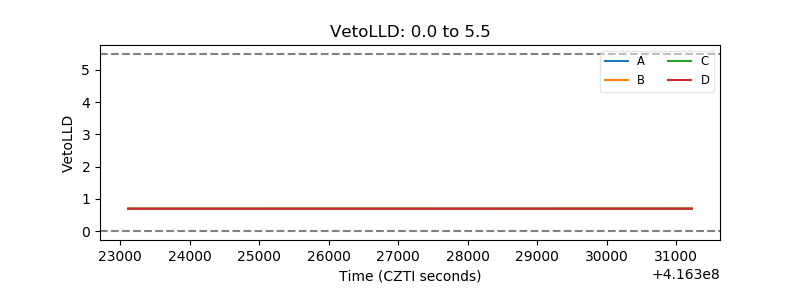 |
| Alpha Counter | 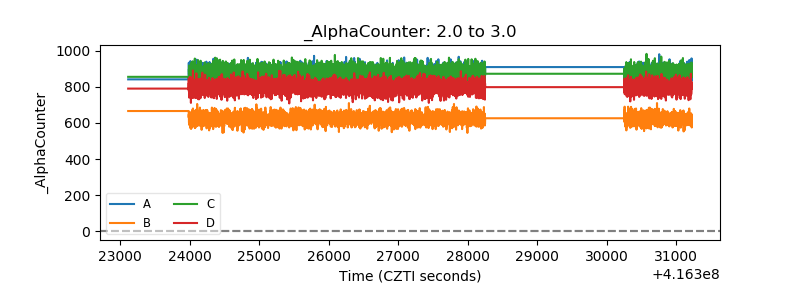 |
| _CPM_Rate | 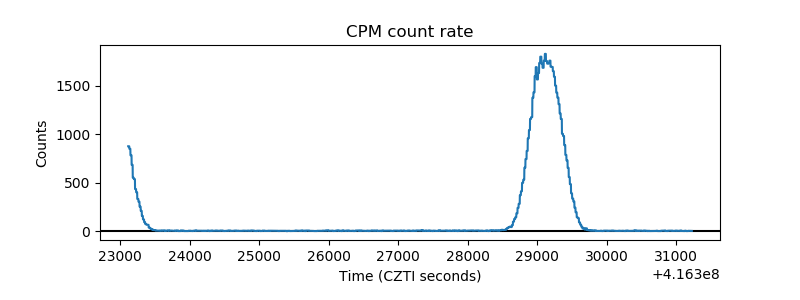 |
| CZT Counter | 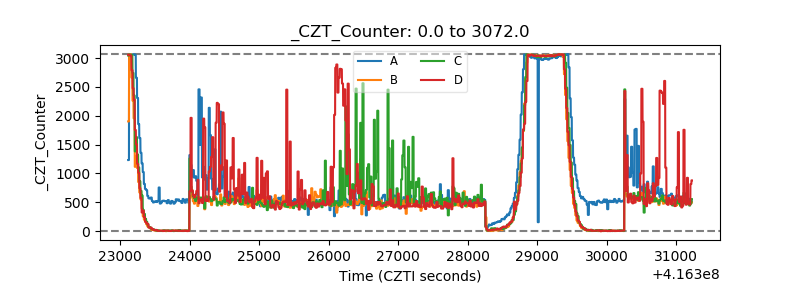 |
| +2.5 Volts monitor | 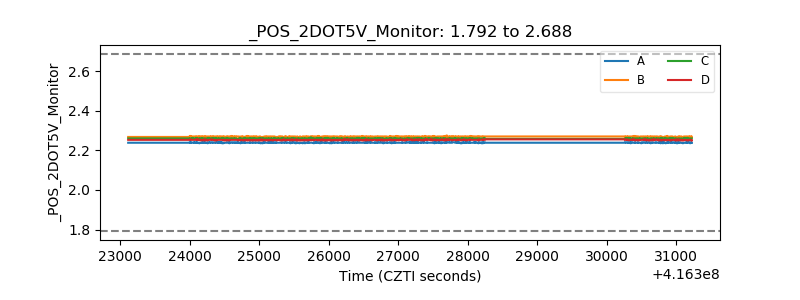 |
| +5 Volts monitor | 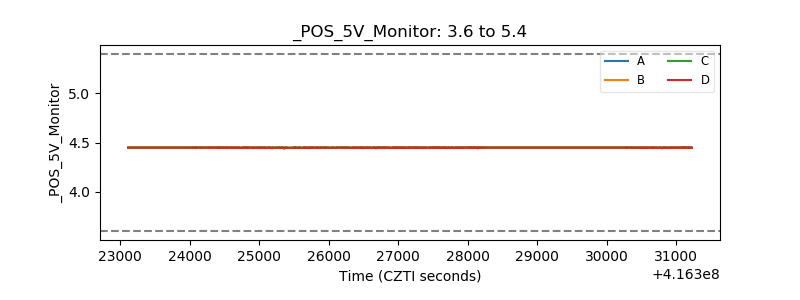 |
| _ROLL_ROT | 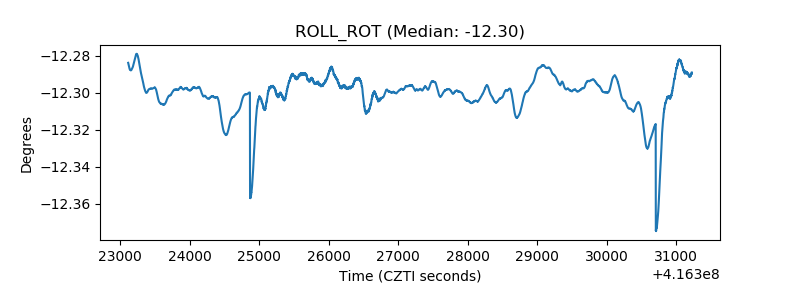 |
| _Roll_DEC | 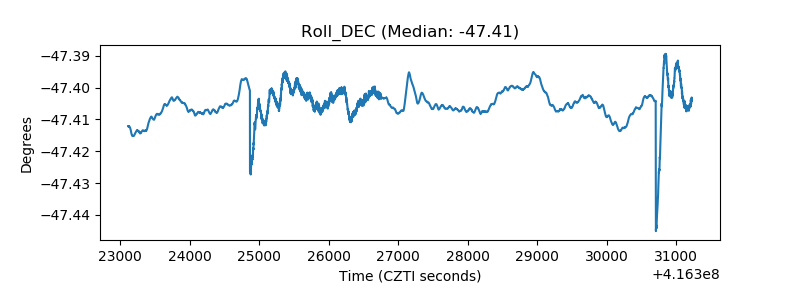 |
| _Roll_RA | 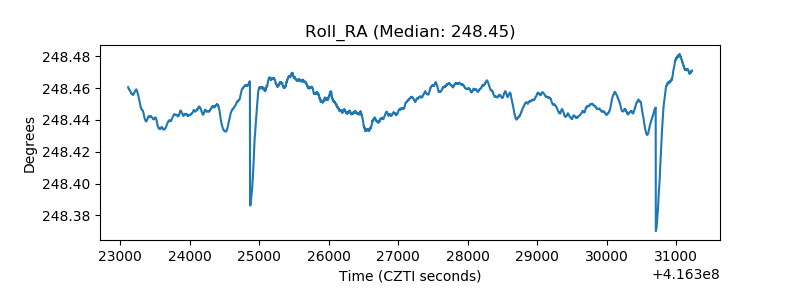 |
| Veto Counter | 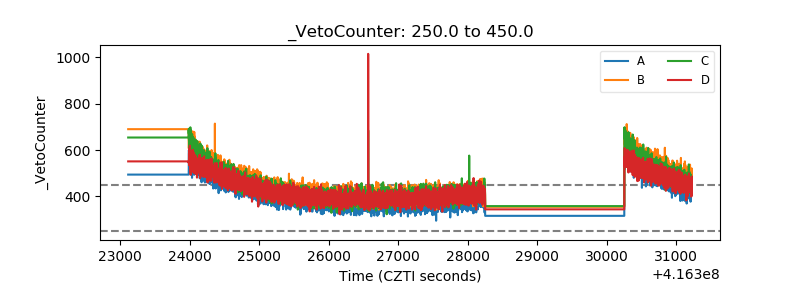 |