| Param | Original file | Final file |
|---|---|---|
| Filename | modeM0/AS1A12_056T02_9000005538_40301cztM0_level2.fits | modeM0/AS1A12_056T02_9000005538_40301cztM0_level2_quad_clean.evt |
| Size (bytes) | 352,065,600 | 98,118,720 |
| Size | 335.8 MB | 93.6 MB |
| Events in quadrant A | 3,107,342 | 682,469 |
| Events in quadrant B | 2,742,005 | 701,955 |
| Events in quadrant C | 3,182,893 | 653,743 |
| Events in quadrant D | 3,605,299 | 577,615 |
| Mode M0 | |||
|---|---|---|---|
| Quadrant | BADHDUFLAG | Total packets | Discarded packets |
| A | 0 | 12358 | 3 |
| B | 0 | 11170 | 2 |
| C | 0 | 12488 | 2 |
| D | 0 | 14054 | 2 |
| Mode M9 | |||
|---|---|---|---|
| Quadrant | BADHDUFLAG | Total packets | Discarded packets |
| A | 0 | 30 | 0 |
| B | 0 | 30 | 0 |
| C | 0 | 30 | 0 |
| D | 0 | 31 | 0 |
| Mode SS | |||
|---|---|---|---|
| Quadrant | BADHDUFLAG | Total packets | Discarded packets |
| A | 0 | 104 | 0 |
| B | 0 | 104 | 0 |
| C | 0 | 104 | 0 |
| D | 0 | 104 | 0 |
| Quadrant | Total seconds | Saturated seconds | Saturation percentage |
|---|---|---|---|
| A | 5073 | 39 | 0.768776% |
| B | 5073 | 31 | 0.611078% |
| C | 5073 | 48 | 0.946186% |
| D | 5073 | 297 | 5.854524% |
Noise dominated data is calculated using 1-second bins in cleaned event files. If a bin has >2000 counts, and if more than 50% of those come from <1% of pixels, then it is considered to be noise-dominated and hence unusable.
| Quadrant | # 1 sec bins | Bins with >0 counts | Bins with >2000 counts | High rate bins dominated by noise | Noise dominated (total time) | Noise dominated (detector-on time) | Marked lightcurve |
|---|---|---|---|---|---|---|---|
| A | 7166 | 5074 | 24 | 24 | 0.33% | 0.47% | 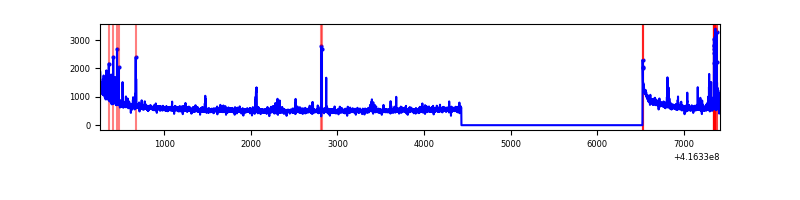 |
| B | 7166 | 5074 | 10 | 10 | 0.14% | 0.20% | 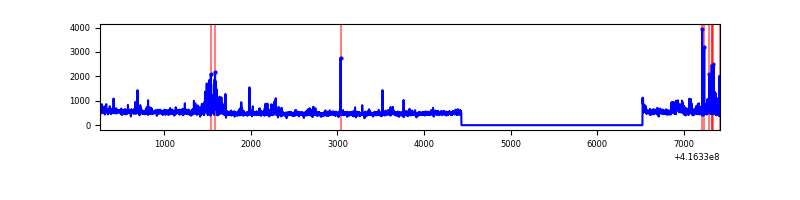 |
| C | 7166 | 5074 | 35 | 35 | 0.49% | 0.69% | 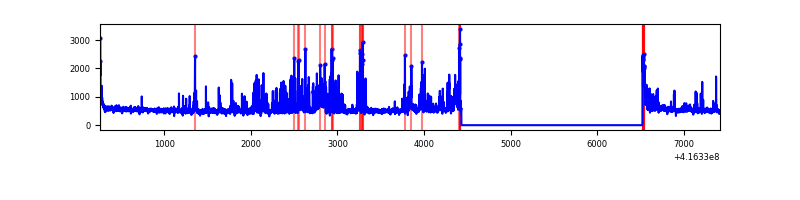 |
| D | 7166 | 5074 | 271 | 271 | 3.78% | 5.34% | 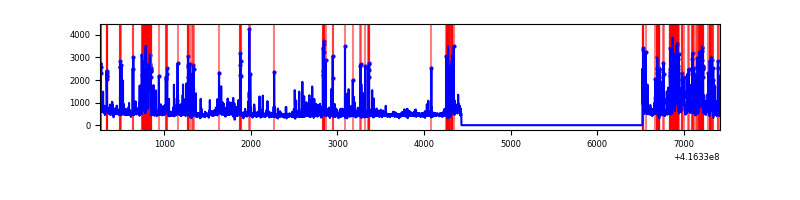 |
Top three noisy pixels from each quadrant. If the there are fewer than three noisy pixels in the level2.evt file, extra rows are filled as -1
| Pixel properties | Quadrant properties | ||||||
|---|---|---|---|---|---|---|---|
| Quadrant | DetID | PixID | Counts | Sigma | Mean | Median | Sigma |
| A | 10 | 83 | 469766 | 3742.95 | 622 | 614 | 125.3 |
| A | 13 | 248 | 122818 | 974.96 | 622 | 614 | 125.3 |
| A | 12 | 189 | 44335 | 348.81 | 622 | 614 | 125.3 |
| B | 4 | 170 | 171708 | 1465.3 | 620 | 605 | 116.8 |
| B | 0 | 230 | 40655 | 342.98 | 620 | 605 | 116.8 |
| B | 4 | 171 | 37708 | 317.74 | 620 | 605 | 116.8 |
| C | 14 | 254 | 580729 | 4234.29 | 599 | 604 | 137.0 |
| C | 15 | 214 | 214953 | 1564.52 | 599 | 604 | 137.0 |
| C | 0 | 10 | 46394 | 334.22 | 599 | 604 | 137.0 |
| D | 12 | 227 | 827905 | 5801.64 | 581 | 565 | 142.6 |
| D | 2 | 250 | 257931 | 1804.75 | 581 | 565 | 142.6 |
| D | 12 | 233 | 157705 | 1101.93 | 581 | 565 | 142.6 |
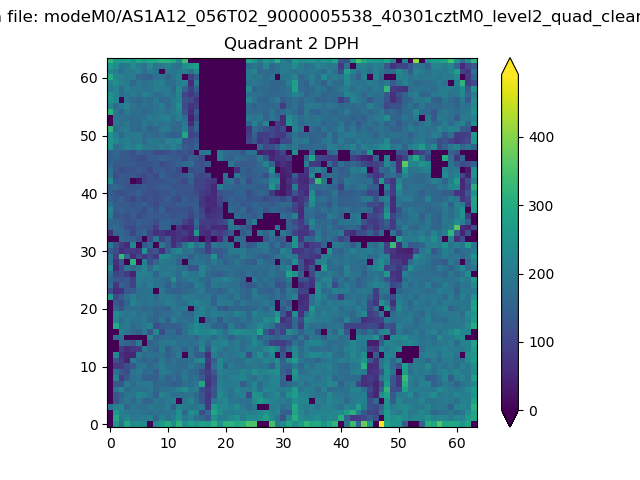
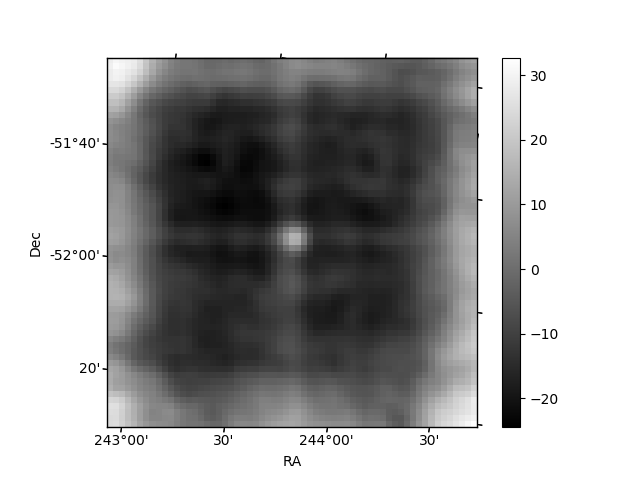
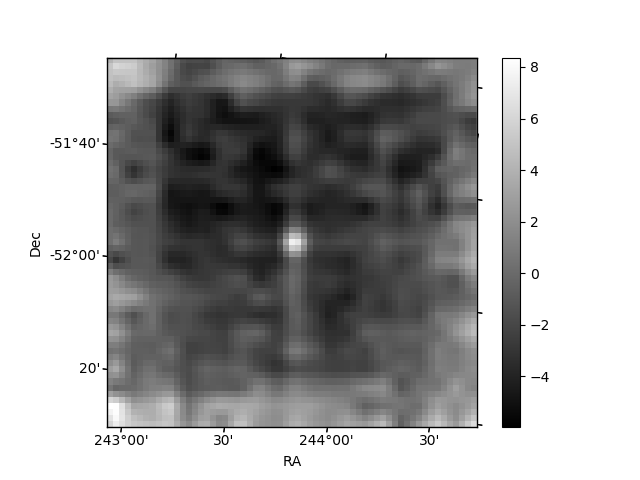
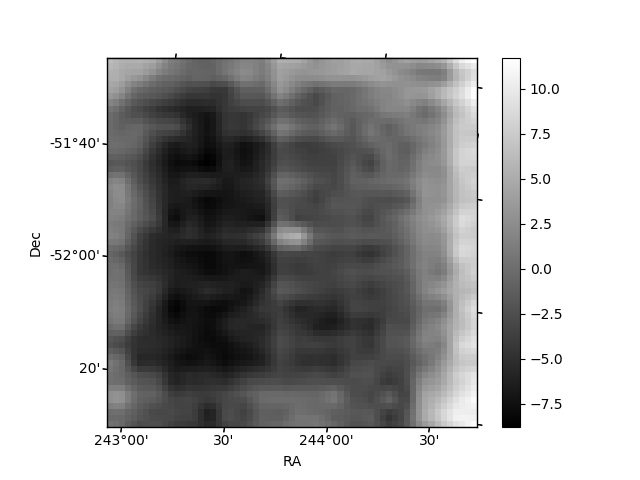
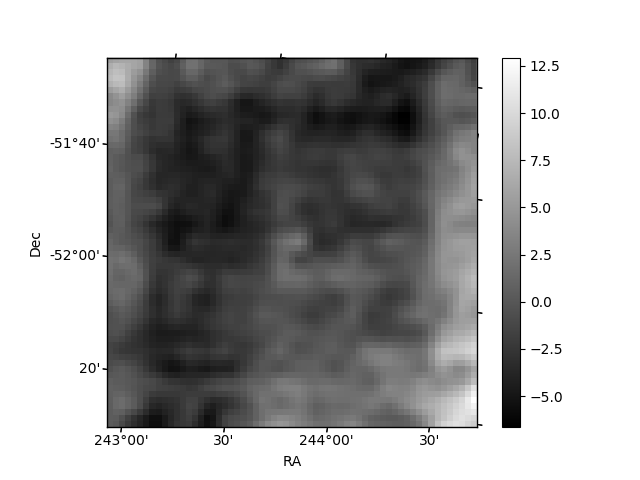
Histogram calculated using DETX and DETY for each event in the final _common_clean file
| Quadrant A | 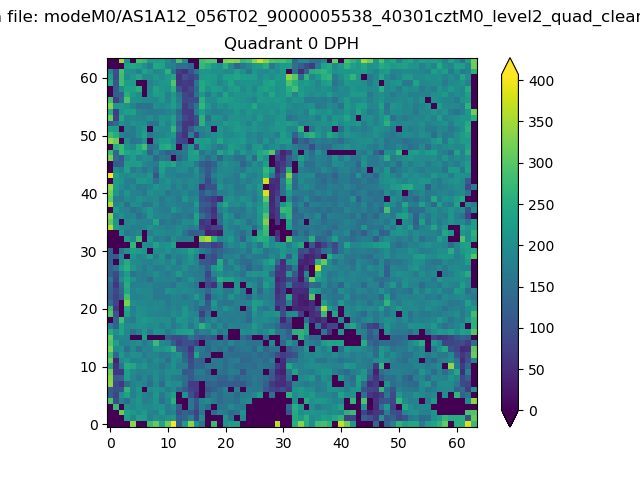 |
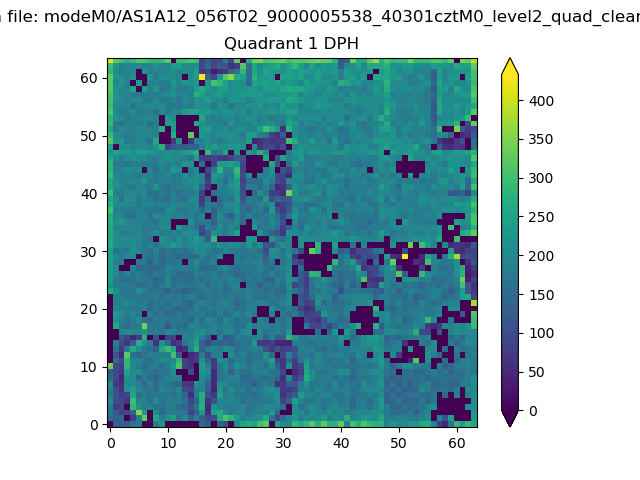 |
Quadrant B |
|---|---|---|---|
| Quadrant D | 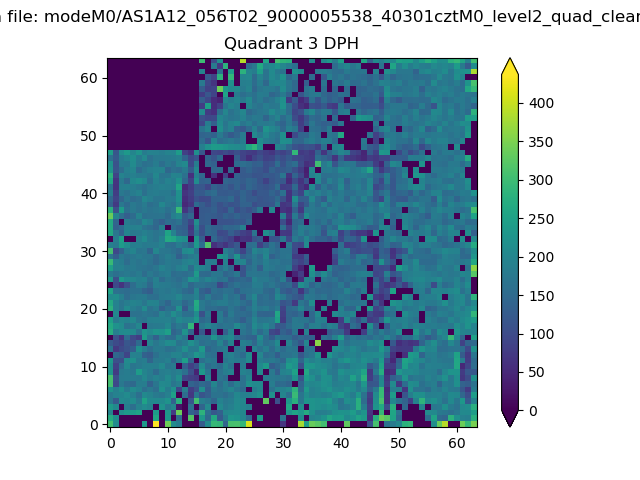 |
 |
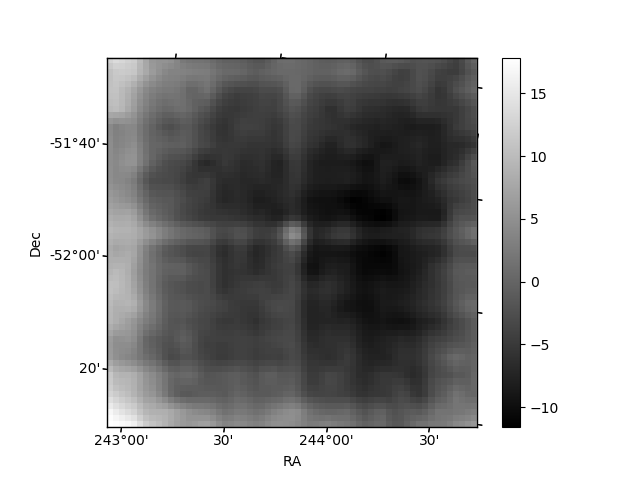
Quadrant C |
| Plot type | Count rate plots | Images |
|---|---|---|
| Comparison with Poisson distribution Blue bars denote a histogram of data divided into 1 sec bins. Red curve is a Poisson curve with rate = median count rate of data. |
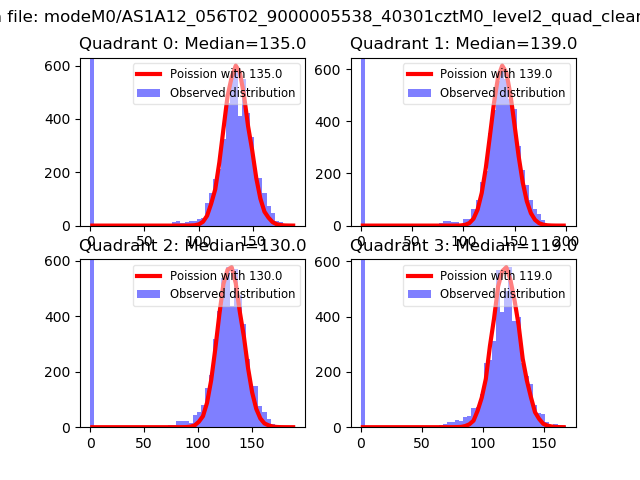 |
 |
| Quadrant-wise count rates Data is divided into 100 sec bins |
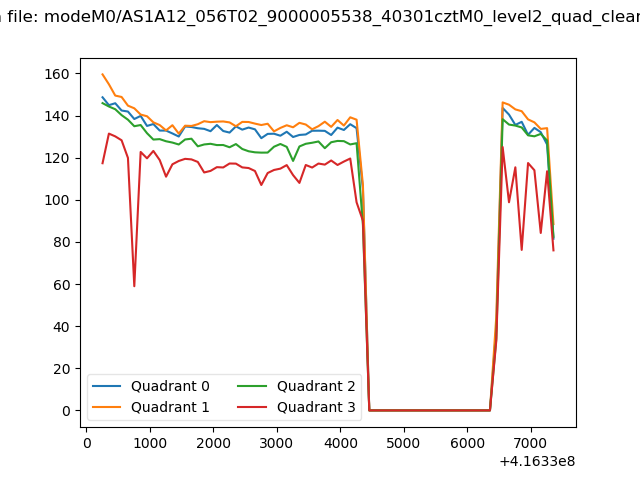 |
|
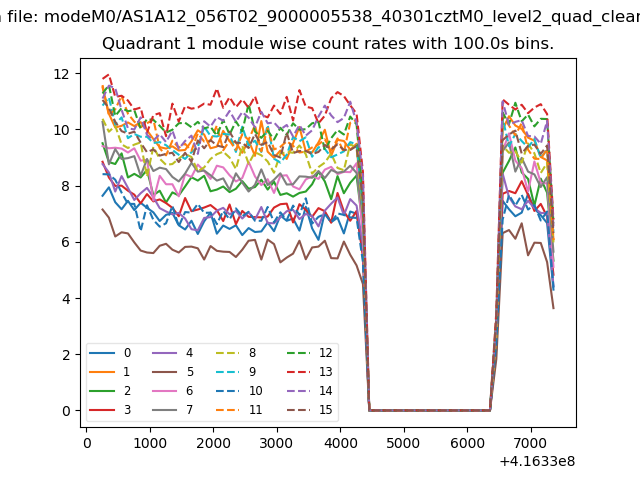
| Module-wise count rates for Quadrant A Data is divided into 100 sec bins |
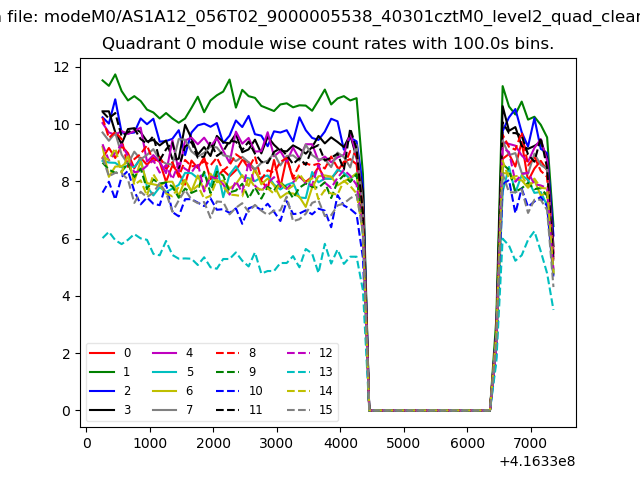 |
 |
| Module-wise count rates for Quadrant B Data is divided into 100 sec bins |
 |
 |
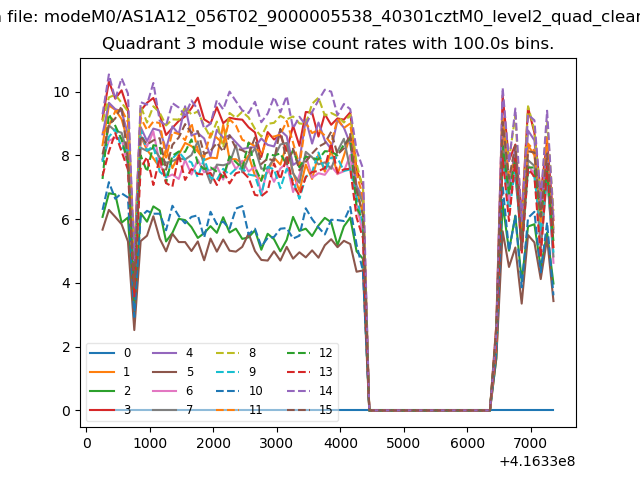
| Module-wise count rates for Quadrant C Data is divided into 100 sec bins |
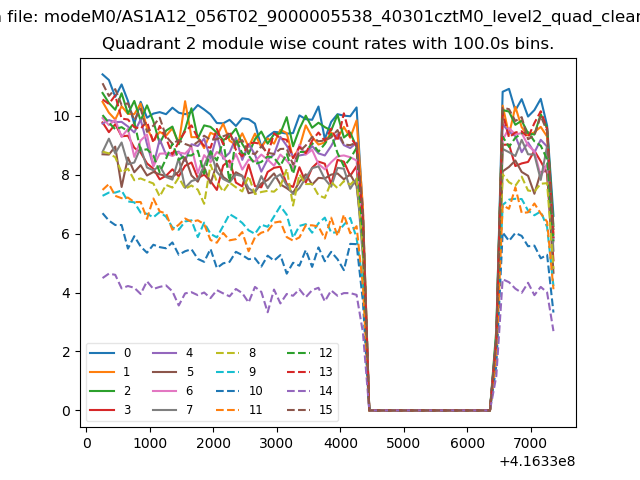 |
 |
| Module-wise count rates for Quadrant D Data is divided into 100 sec bins |
 |
 |
| Parameter | Plot |
|---|---|
| CZT HV Monitor | 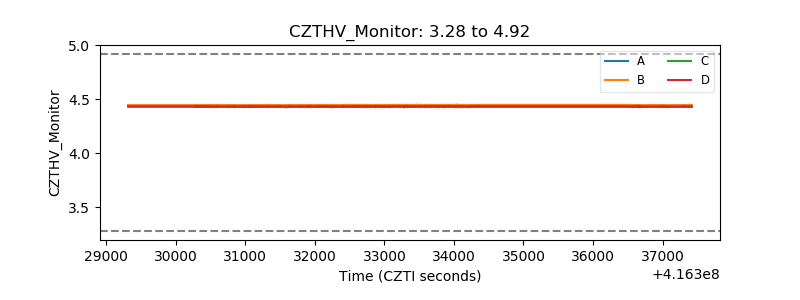 |
| D_VDD | 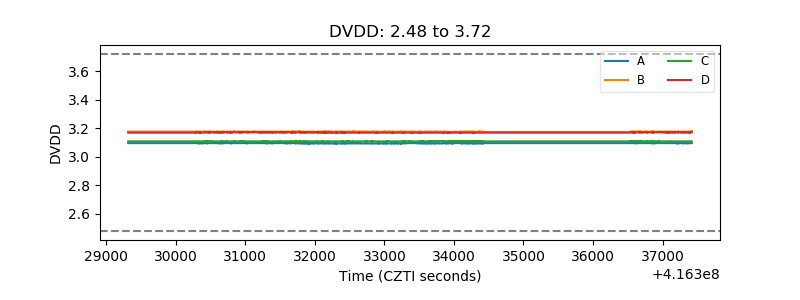 |
| Temperature 1 | 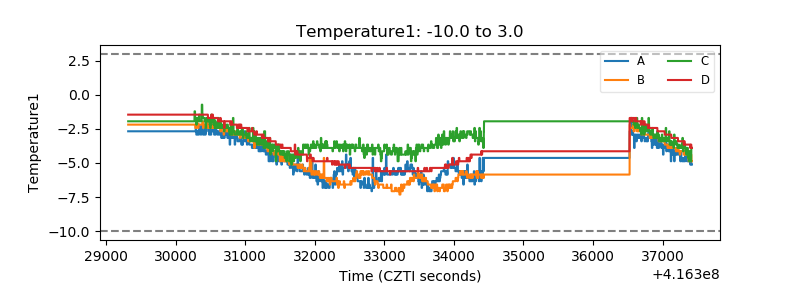 |
| Veto HV Monitor | 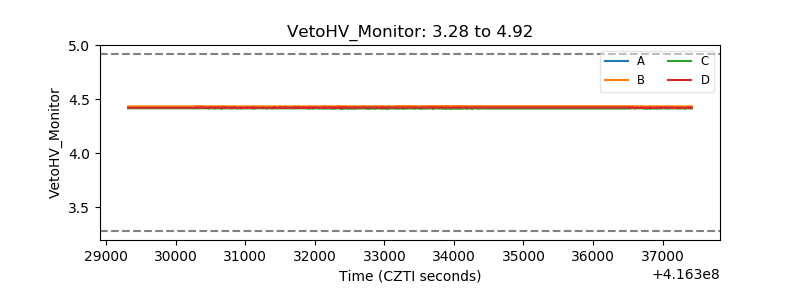 |
| Veto LLD | 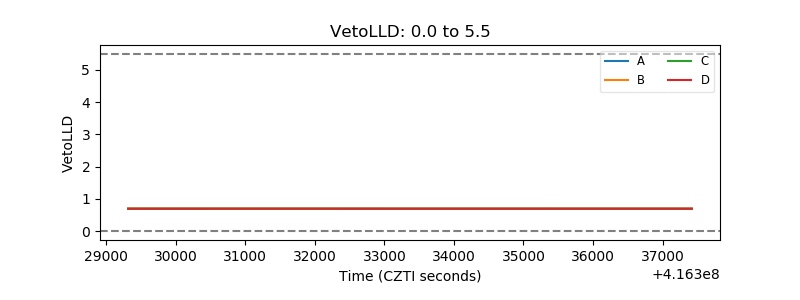 |
| Alpha Counter | 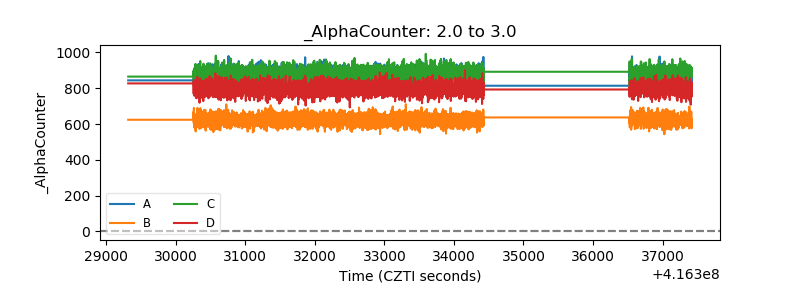 |
| _CPM_Rate | 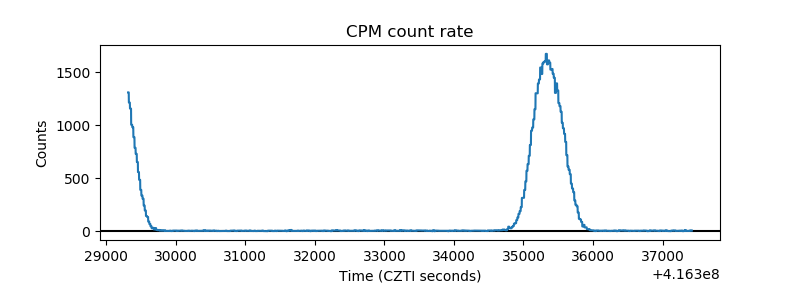 |
| CZT Counter | 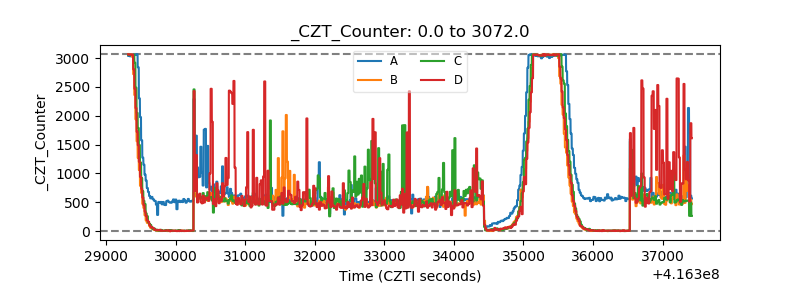 |
| +2.5 Volts monitor |  |
| +5 Volts monitor | 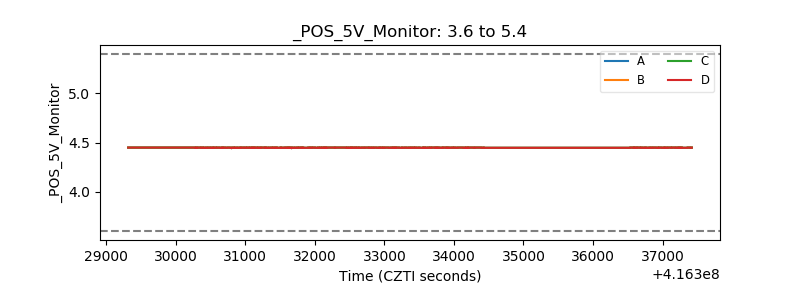 |
| _ROLL_ROT | 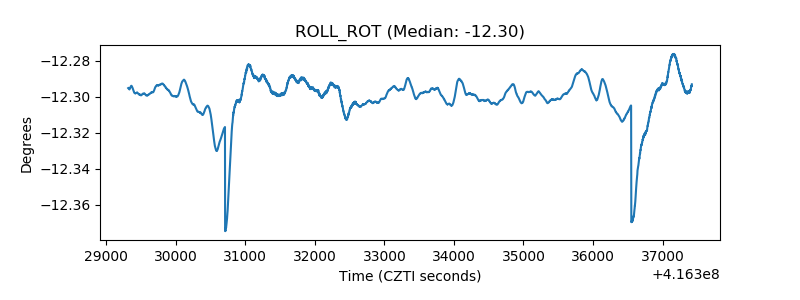 |
| _Roll_DEC | 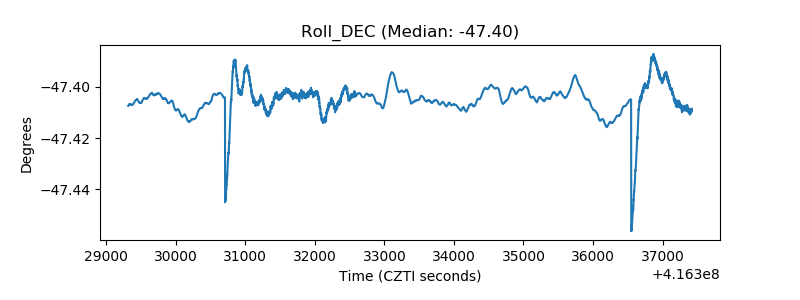 |
| _Roll_RA | 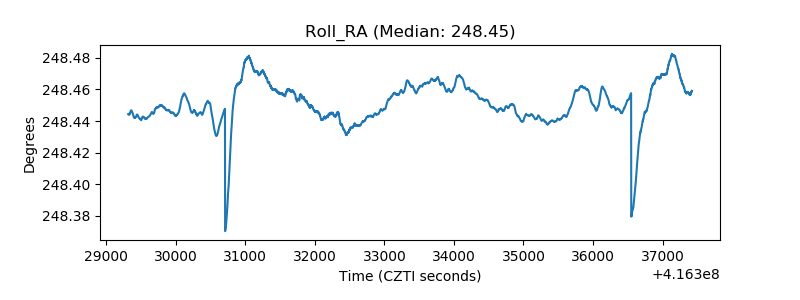 |
| Veto Counter | 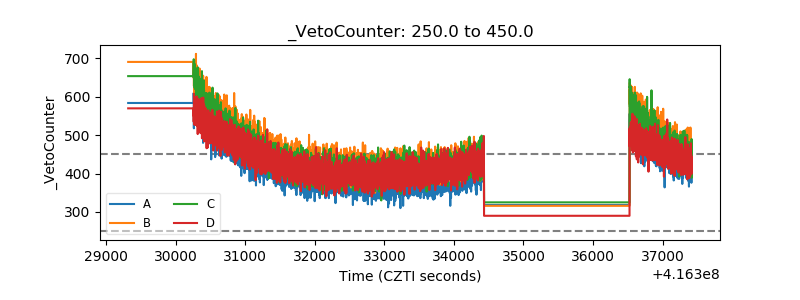 |