| Param | Original file | Final file |
|---|---|---|
| Filename | modeM0/AS1A12_056T02_9000005538_40302cztM0_level2.fits | modeM0/AS1A12_056T02_9000005538_40302cztM0_level2_quad_clean.evt |
| Size (bytes) | 382,458,240 | 89,769,600 |
| Size | 364.7 MB | 85.6 MB |
| Events in quadrant A | 3,151,814 | 624,282 |
| Events in quadrant B | 2,554,111 | 652,907 |
| Events in quadrant C | 2,859,939 | 608,475 |
| Events in quadrant D | 5,213,691 | 492,246 |
| Mode M0 | |||
|---|---|---|---|
| Quadrant | BADHDUFLAG | Total packets | Discarded packets |
| A | 0 | 12320 | 3 |
| B | 0 | 10675 | 2 |
| C | 0 | 11381 | 2 |
| D | 0 | 18770 | 2 |
| Mode M9 | |||
|---|---|---|---|
| Quadrant | BADHDUFLAG | Total packets | Discarded packets |
| A | 0 | 30 | 0 |
| B | 0 | 30 | 0 |
| C | 0 | 30 | 0 |
| D | 0 | 31 | 0 |
| Mode SS | |||
|---|---|---|---|
| Quadrant | BADHDUFLAG | Total packets | Discarded packets |
| A | 0 | 98 | 0 |
| B | 0 | 98 | 0 |
| C | 0 | 98 | 0 |
| D | 0 | 98 | 0 |
| Quadrant | Total seconds | Saturated seconds | Saturation percentage |
|---|---|---|---|
| A | 4856 | 148 | 3.047776% |
| B | 4856 | 17 | 0.350082% |
| C | 4856 | 48 | 0.988468% |
| D | 4856 | 776 | 15.980231% |
Noise dominated data is calculated using 1-second bins in cleaned event files. If a bin has >2000 counts, and if more than 50% of those come from <1% of pixels, then it is considered to be noise-dominated and hence unusable.
| Quadrant | # 1 sec bins | Bins with >0 counts | Bins with >2000 counts | High rate bins dominated by noise | Noise dominated (total time) | Noise dominated (detector-on time) | Marked lightcurve |
|---|---|---|---|---|---|---|---|
| A | 6979 | 4857 | 116 | 116 | 1.66% | 2.39% | 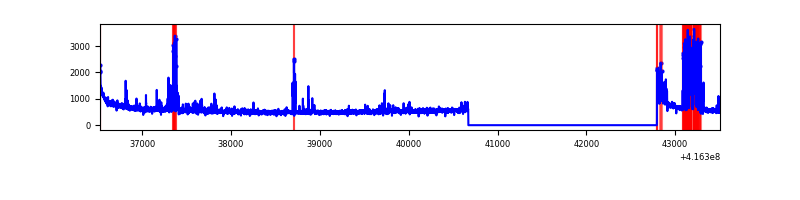 |
| B | 6979 | 4857 | 8 | 8 | 0.11% | 0.16% | 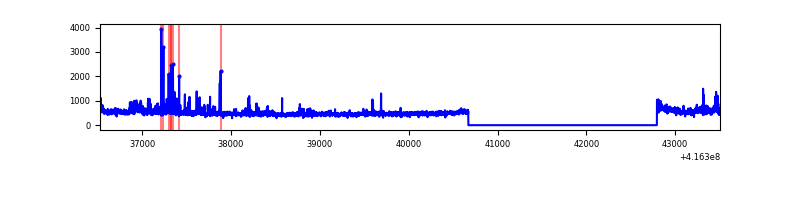 |
| C | 6979 | 4857 | 38 | 38 | 0.54% | 0.78% | 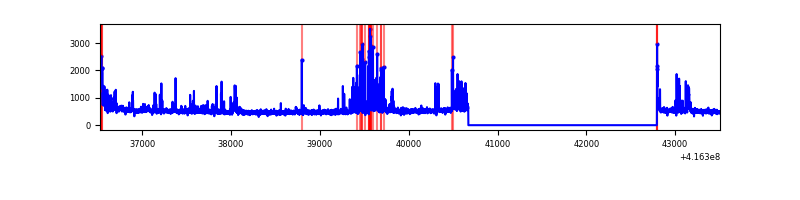 |
| D | 6979 | 4857 | 749 | 749 | 10.73% | 15.42% | 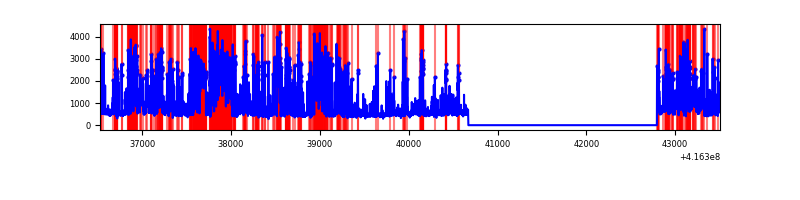 |
Top three noisy pixels from each quadrant. If the there are fewer than three noisy pixels in the level2.evt file, extra rows are filled as -1
| Pixel properties | Quadrant properties | ||||||
|---|---|---|---|---|---|---|---|
| Quadrant | DetID | PixID | Counts | Sigma | Mean | Median | Sigma |
| A | 10 | 83 | 451485 | 3846.8 | 574 | 565 | 117.2 |
| A | 13 | 248 | 355812 | 3030.62 | 574 | 565 | 117.2 |
| A | 2 | 79 | 59241 | 500.57 | 574 | 565 | 117.2 |
| B | 4 | 170 | 65141 | 584.95 | 580 | 567 | 110.4 |
| B | 7 | 202 | 59104 | 530.27 | 580 | 567 | 110.4 |
| B | 6 | 203 | 55264 | 495.48 | 580 | 567 | 110.4 |
| C | 14 | 254 | 416678 | 3208.37 | 561 | 565 | 129.7 |
| C | 15 | 214 | 209718 | 1612.64 | 561 | 565 | 129.7 |
| C | 0 | 10 | 42417 | 322.69 | 561 | 565 | 129.7 |
| D | 12 | 227 | 2082544 | 16455.7 | 519 | 505 | 126.5 |
| D | 1 | 47 | 522993 | 4129.56 | 519 | 505 | 126.5 |
| D | 2 | 250 | 440741 | 3479.47 | 519 | 505 | 126.5 |
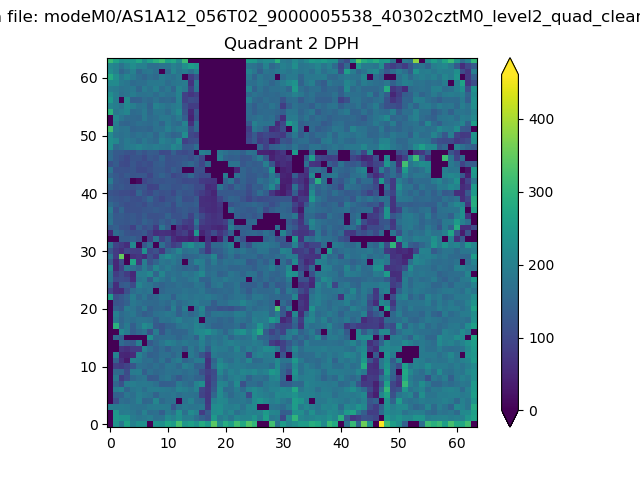
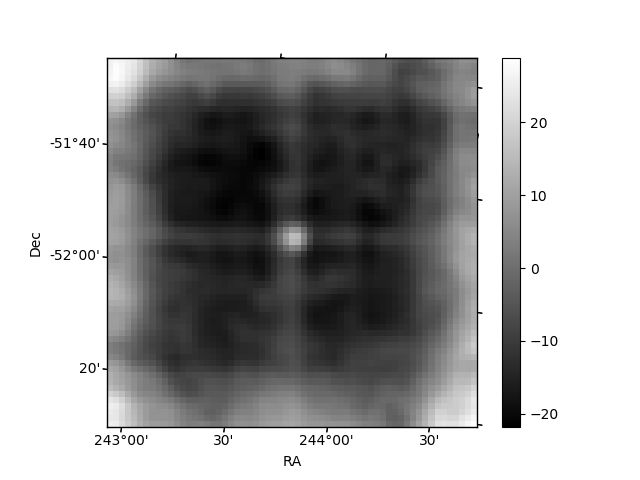
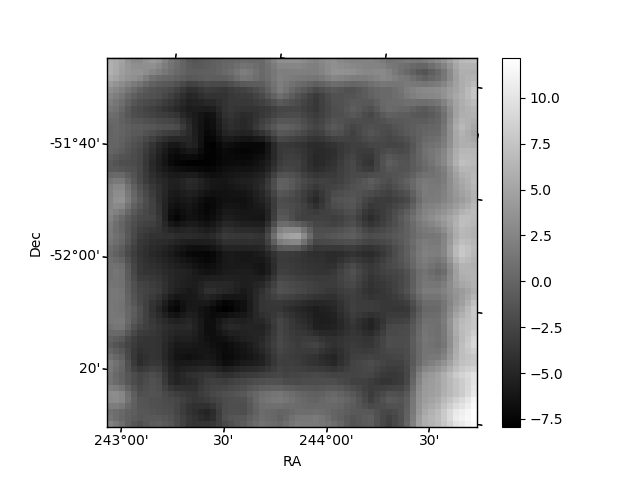
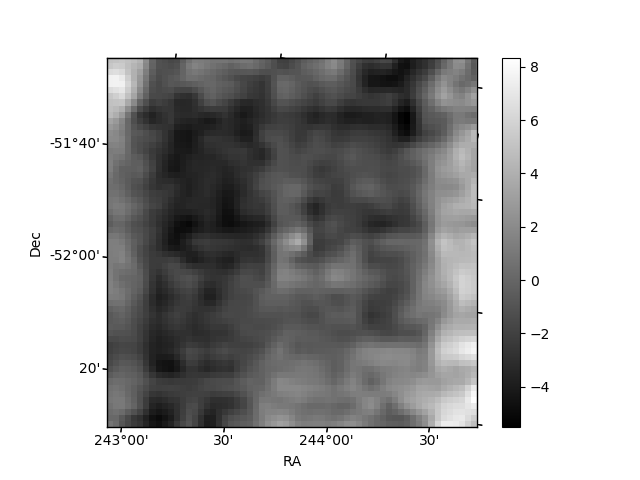
Histogram calculated using DETX and DETY for each event in the final _common_clean file
| Quadrant A | 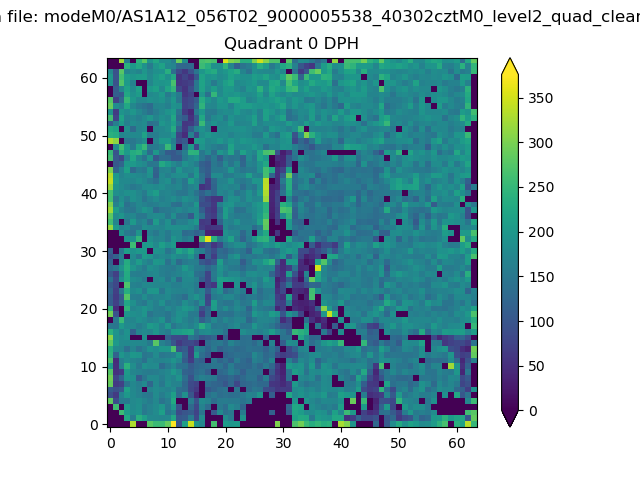 |
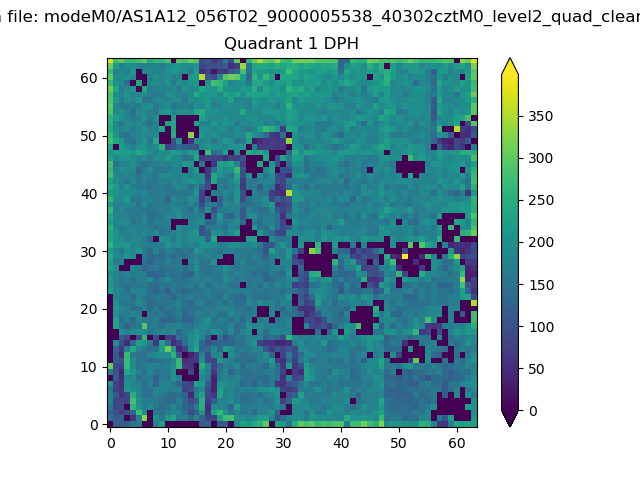 |
Quadrant B |
|---|---|---|---|
| Quadrant D | 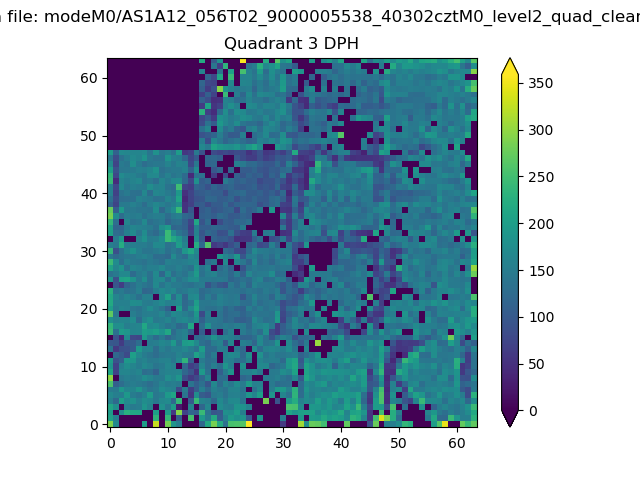 |
 |
Quadrant C |
| Plot type | Count rate plots | Images |
|---|---|---|
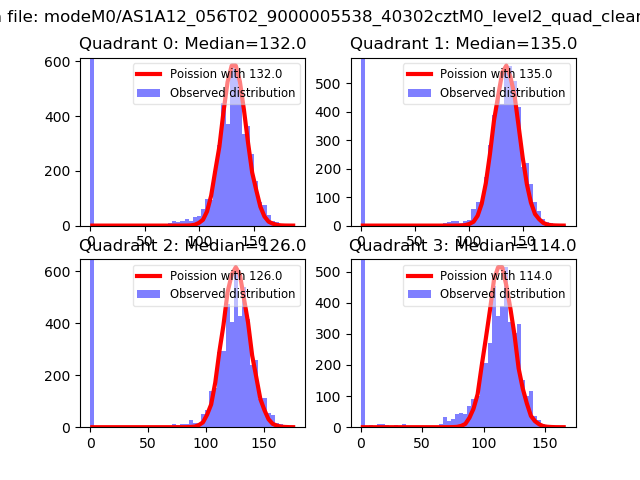
| Comparison with Poisson distribution Blue bars denote a histogram of data divided into 1 sec bins. Red curve is a Poisson curve with rate = median count rate of data. |
 |
 |
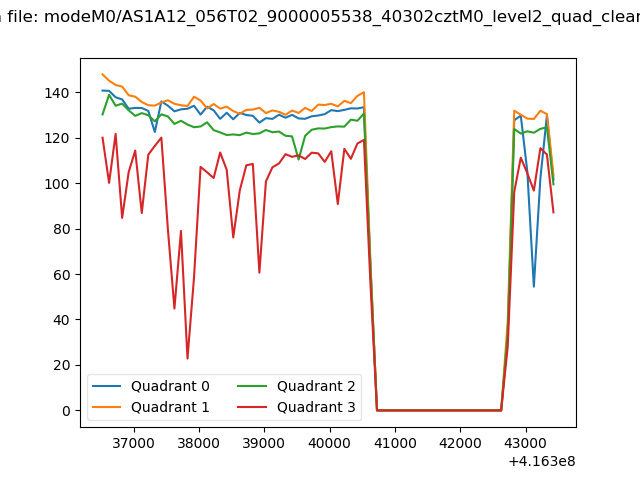
| Quadrant-wise count rates Data is divided into 100 sec bins |
 |
|
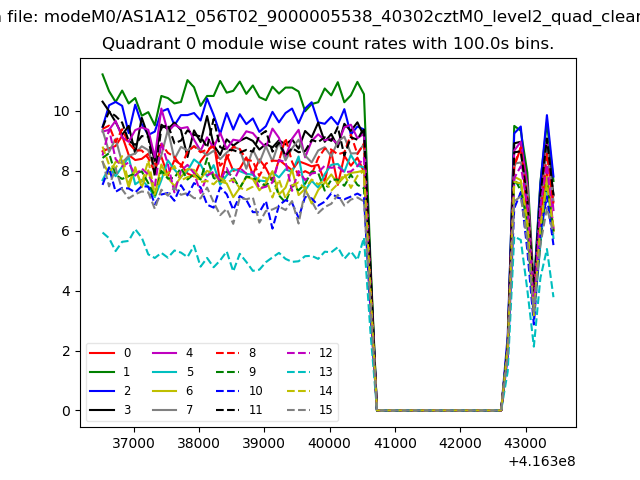
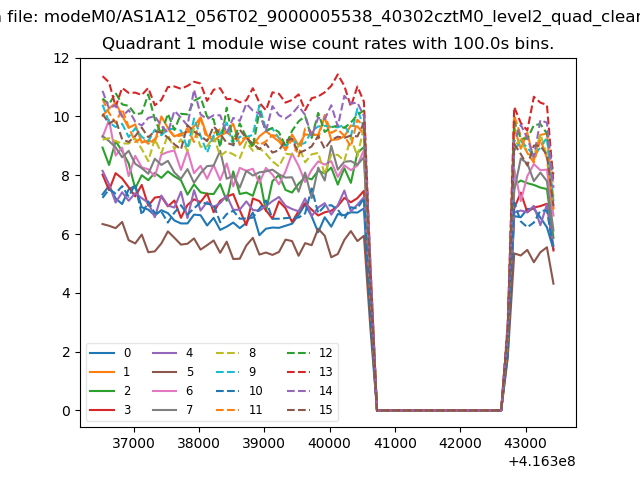
| Module-wise count rates for Quadrant A Data is divided into 100 sec bins |
 |
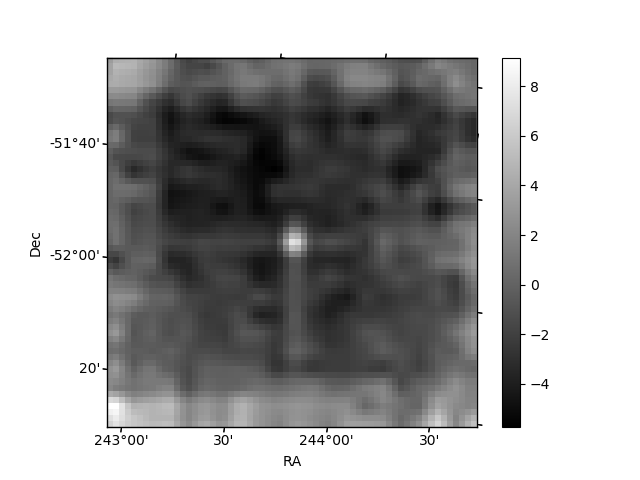 |
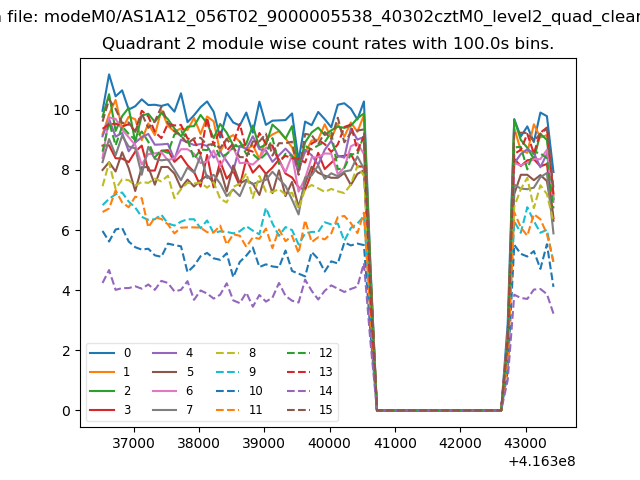
| Module-wise count rates for Quadrant B Data is divided into 100 sec bins |
 |
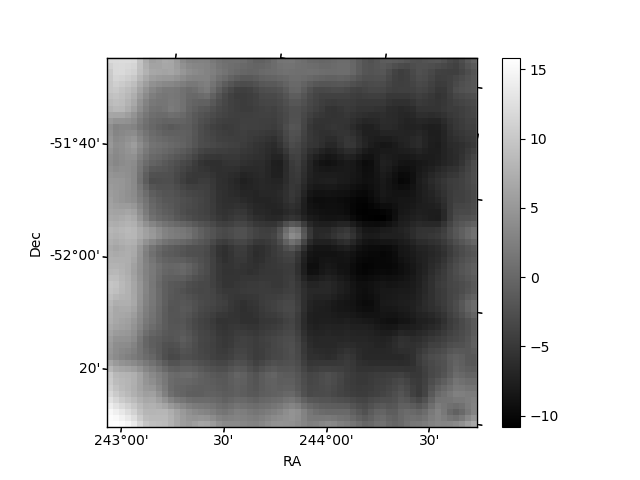 |
| Module-wise count rates for Quadrant C Data is divided into 100 sec bins |
 |
 |
| Module-wise count rates for Quadrant D Data is divided into 100 sec bins |
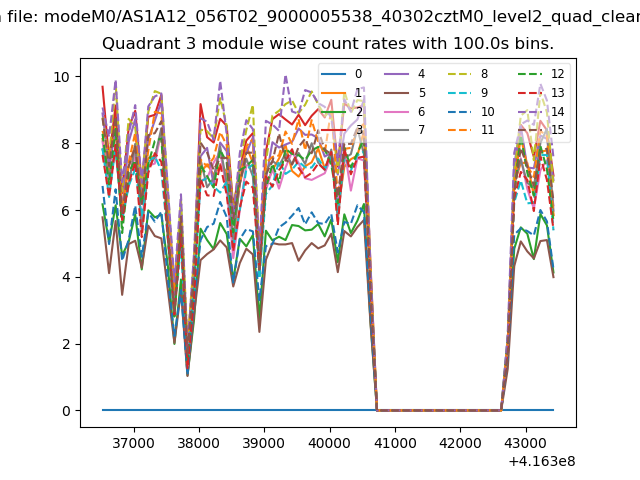 |
 |
| Parameter | Plot |
|---|---|
| CZT HV Monitor | 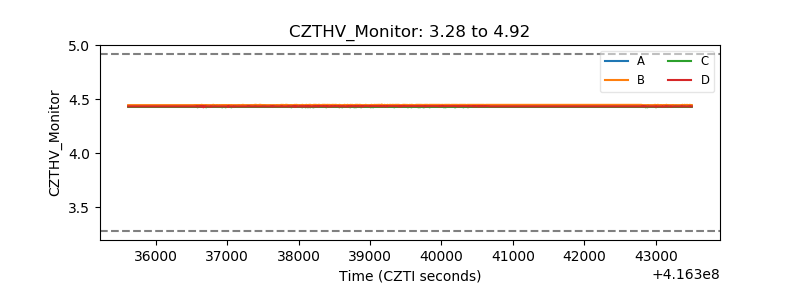 |
| D_VDD | 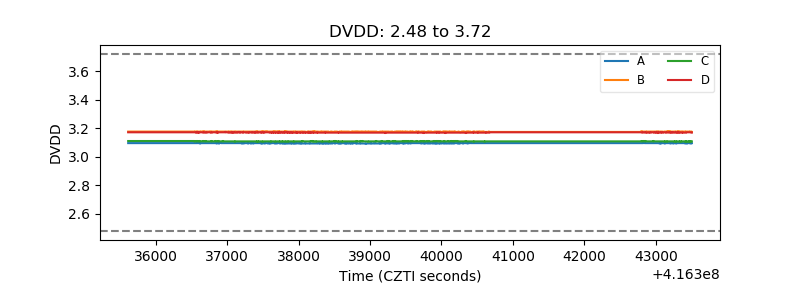 |
| Temperature 1 | 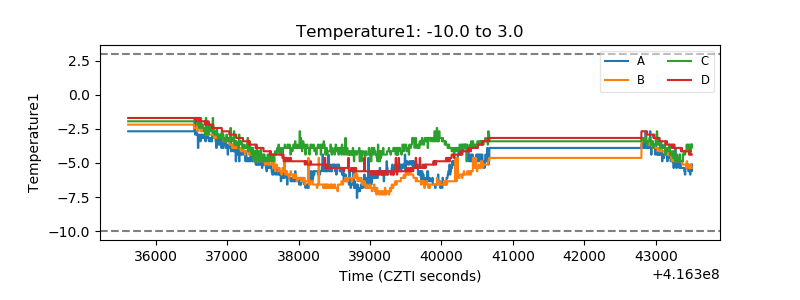 |
| Veto HV Monitor | 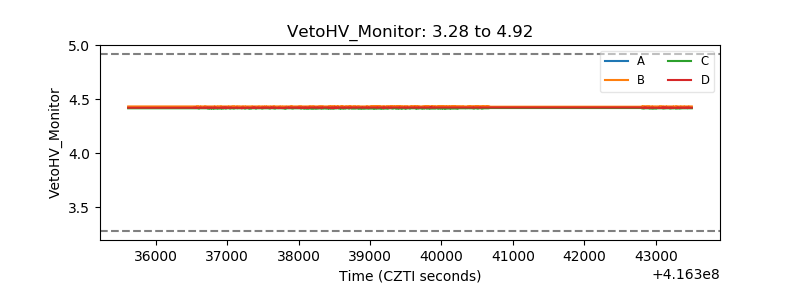 |
| Veto LLD | 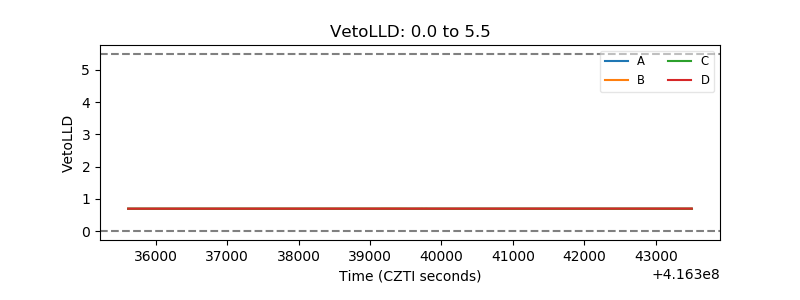 |
| Alpha Counter | 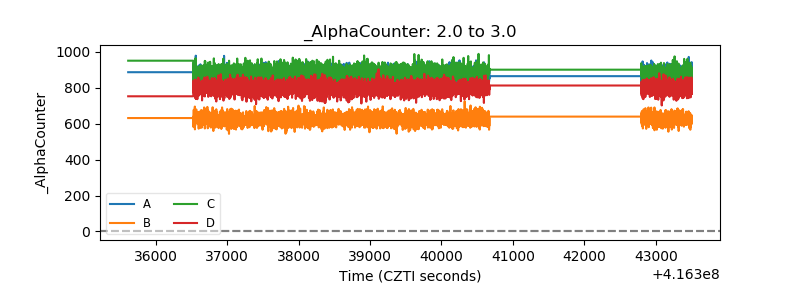 |
| _CPM_Rate | 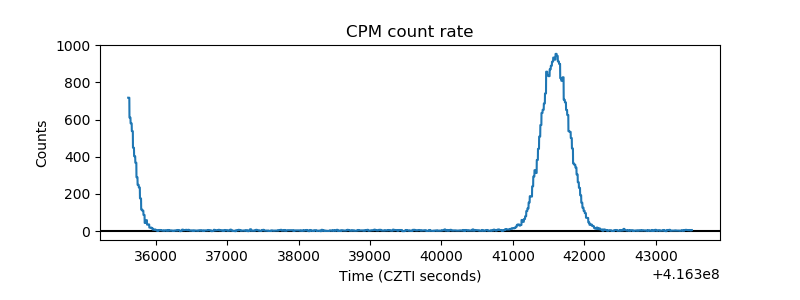 |
| CZT Counter | 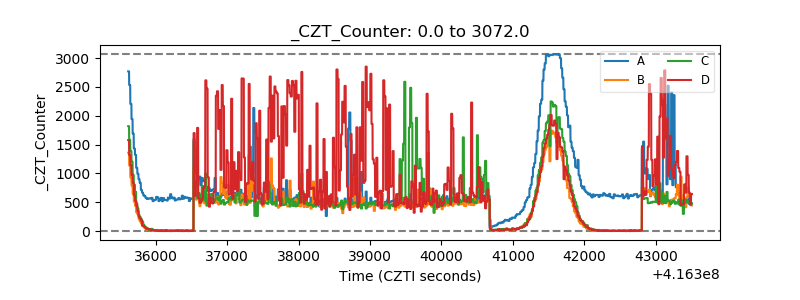 |
| +2.5 Volts monitor | 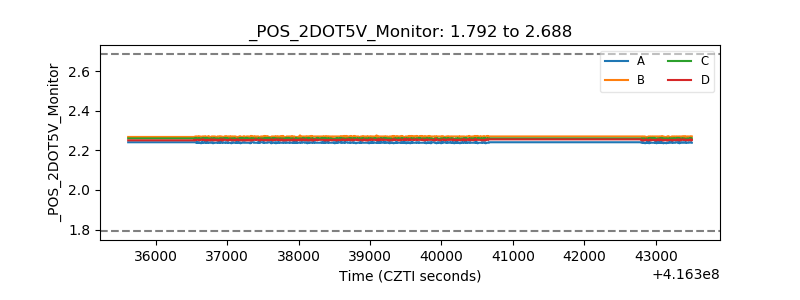 |
| +5 Volts monitor | 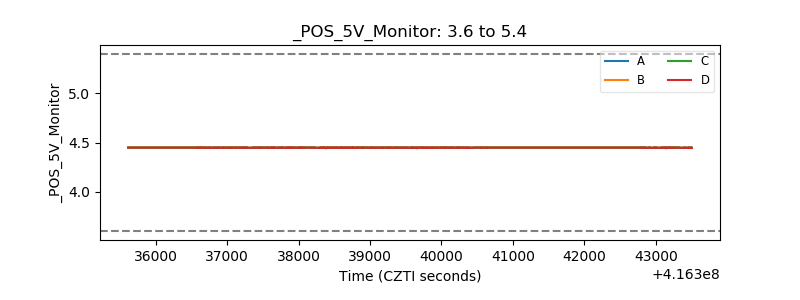 |
| _ROLL_ROT | 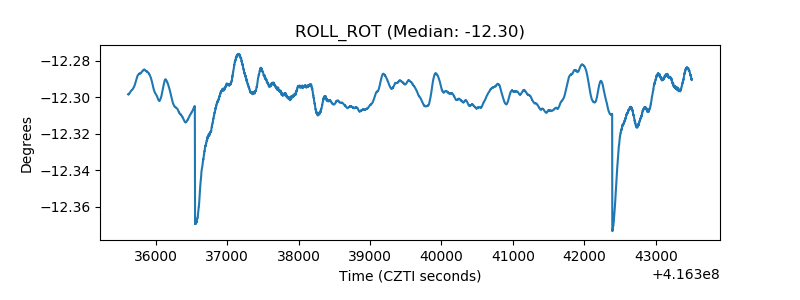 |
| _Roll_DEC | 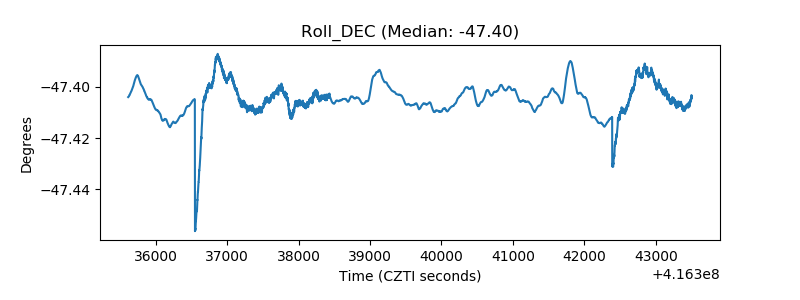 |
| _Roll_RA | 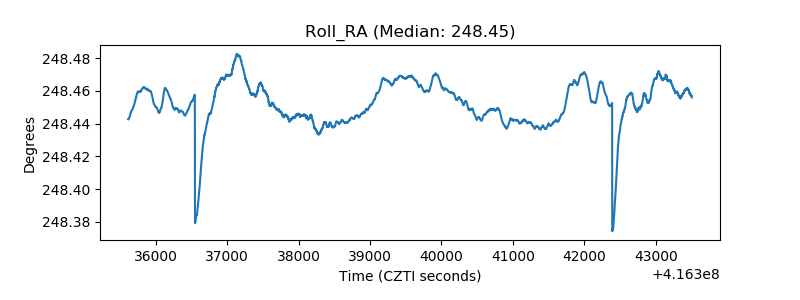 |
| Veto Counter | 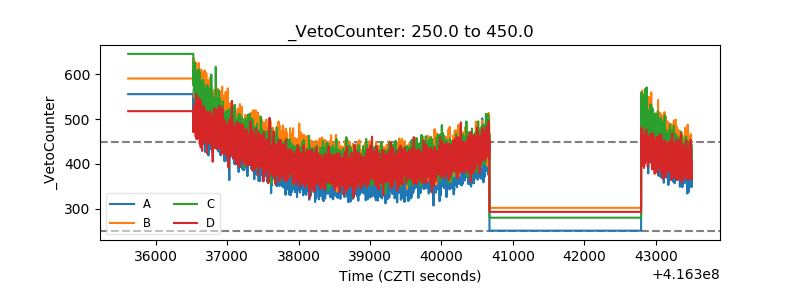 |