| Param | Original file | Final file |
|---|---|---|
| Filename | modeM0/AS1A12_056T02_9000005538_40303cztM0_level2.fits | modeM0/AS1A12_056T02_9000005538_40303cztM0_level2_quad_clean.evt |
| Size (bytes) | 360,224,640 | 88,447,680 |
| Size | 343.5 MB | 84.4 MB |
| Events in quadrant A | 2,998,519 | 609,784 |
| Events in quadrant B | 2,923,186 | 619,466 |
| Events in quadrant C | 2,566,298 | 594,240 |
| Events in quadrant D | 4,460,768 | 507,435 |
| Mode M0 | |||
|---|---|---|---|
| Quadrant | BADHDUFLAG | Total packets | Discarded packets |
| A | 0 | 11869 | 3 |
| B | 0 | 11838 | 2 |
| C | 0 | 10556 | 2 |
| D | 0 | 16670 | 2 |
| Mode M9 | |||
|---|---|---|---|
| Quadrant | BADHDUFLAG | Total packets | Discarded packets |
| A | 0 | 26 | 0 |
| B | 0 | 26 | 0 |
| C | 0 | 26 | 0 |
| D | 0 | 27 | 0 |
| Mode SS | |||
|---|---|---|---|
| Quadrant | BADHDUFLAG | Total packets | Discarded packets |
| A | 0 | 102 | 0 |
| B | 0 | 102 | 0 |
| C | 0 | 102 | 0 |
| D | 0 | 102 | 0 |
| Quadrant | Total seconds | Saturated seconds | Saturation percentage |
|---|---|---|---|
| A | 4951 | 132 | 2.666128% |
| B | 4951 | 147 | 2.969097% |
| C | 4951 | 30 | 0.605938% |
| D | 4951 | 485 | 9.796001% |
Noise dominated data is calculated using 1-second bins in cleaned event files. If a bin has >2000 counts, and if more than 50% of those come from <1% of pixels, then it is considered to be noise-dominated and hence unusable.
| Quadrant | # 1 sec bins | Bins with >0 counts | Bins with >2000 counts | High rate bins dominated by noise | Noise dominated (total time) | Noise dominated (detector-on time) | Marked lightcurve |
|---|---|---|---|---|---|---|---|
| A | 7043 | 4952 | 98 | 98 | 1.39% | 1.98% | 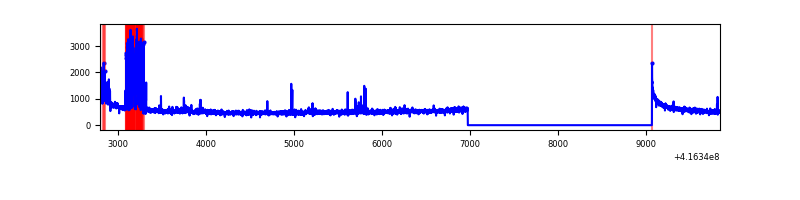 |
| B | 7043 | 4952 | 112 | 112 | 1.59% | 2.26% | 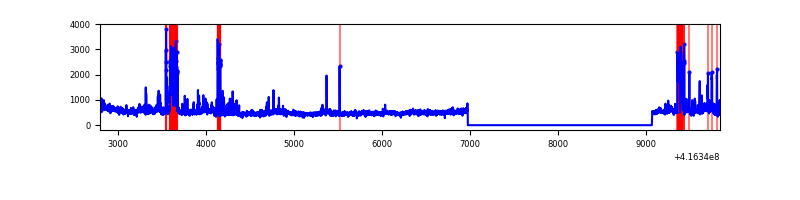 |
| C | 7043 | 4952 | 16 | 16 | 0.23% | 0.32% | 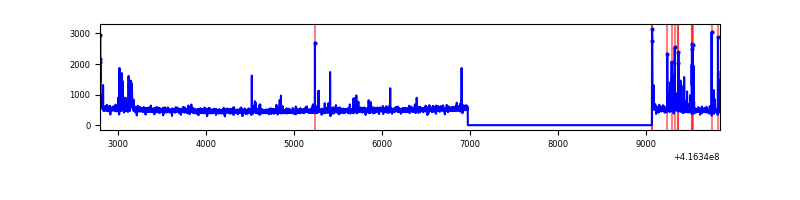 |
| D | 7043 | 4952 | 464 | 464 | 6.59% | 9.37% | 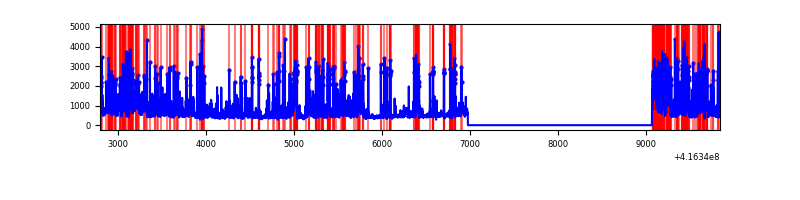 |
Top three noisy pixels from each quadrant. If the there are fewer than three noisy pixels in the level2.evt file, extra rows are filled as -1
| Pixel properties | Quadrant properties | ||||||
|---|---|---|---|---|---|---|---|
| Quadrant | DetID | PixID | Counts | Sigma | Mean | Median | Sigma |
| A | 10 | 83 | 445133 | 3823.99 | 564 | 553 | 116.3 |
| A | 13 | 248 | 293189 | 2517.06 | 564 | 553 | 116.3 |
| A | 12 | 189 | 42610 | 361.75 | 564 | 553 | 116.3 |
| B | 5 | 255 | 365440 | 3376.77 | 563 | 549 | 108.1 |
| B | 7 | 202 | 190420 | 1757.1 | 563 | 549 | 108.1 |
| B | 4 | 171 | 79235 | 728.17 | 563 | 549 | 108.1 |
| C | 15 | 214 | 215029 | 1647.52 | 554 | 560 | 130.2 |
| C | 14 | 254 | 147505 | 1128.81 | 554 | 560 | 130.2 |
| C | 0 | 10 | 30375 | 229.04 | 554 | 560 | 130.2 |
| D | 12 | 227 | 1380755 | 10760.75 | 527 | 513 | 128.3 |
| D | 1 | 47 | 609849 | 4750.55 | 527 | 513 | 128.3 |
| D | 2 | 250 | 282761 | 2200.48 | 527 | 513 | 128.3 |
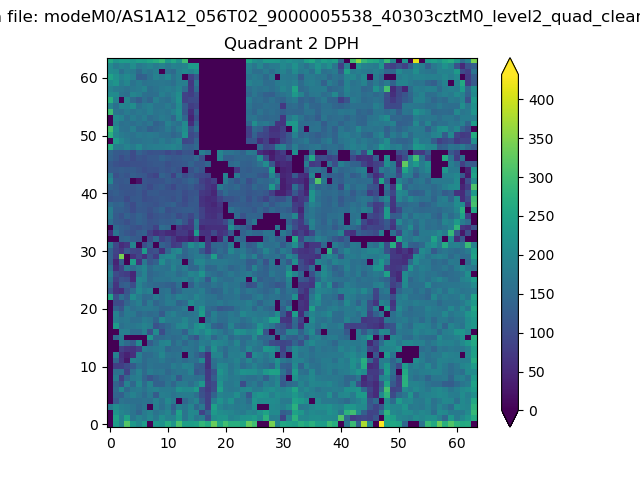
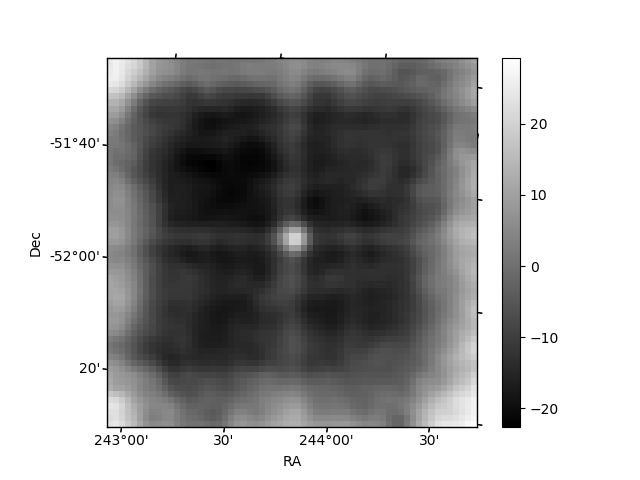
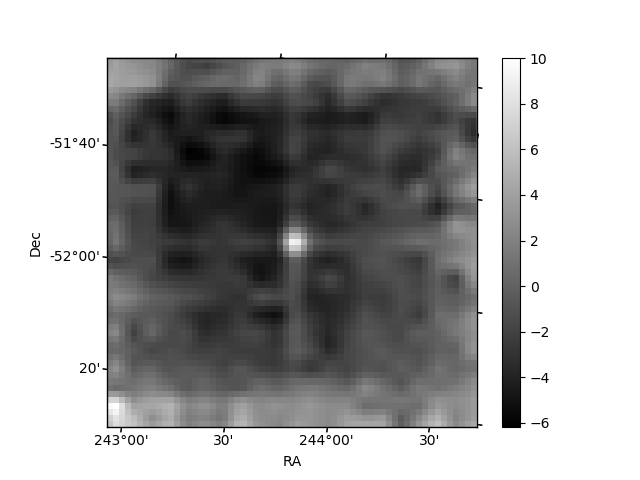
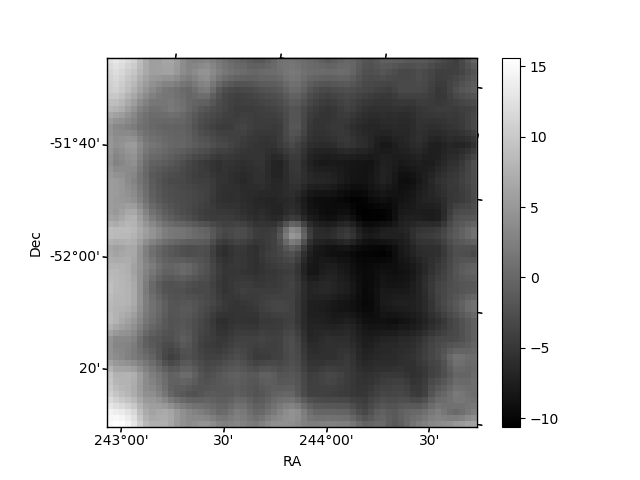
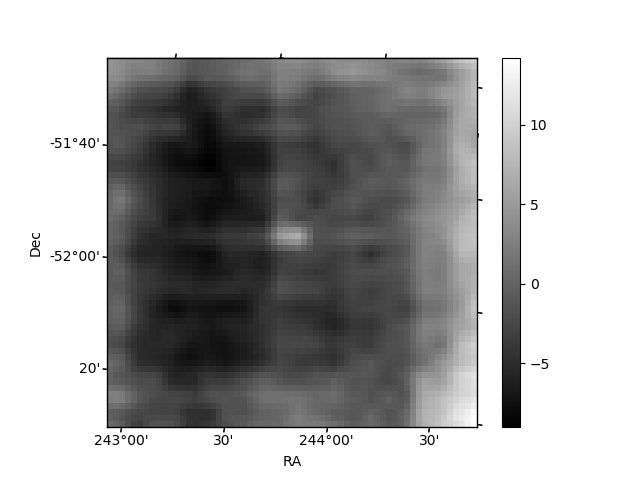
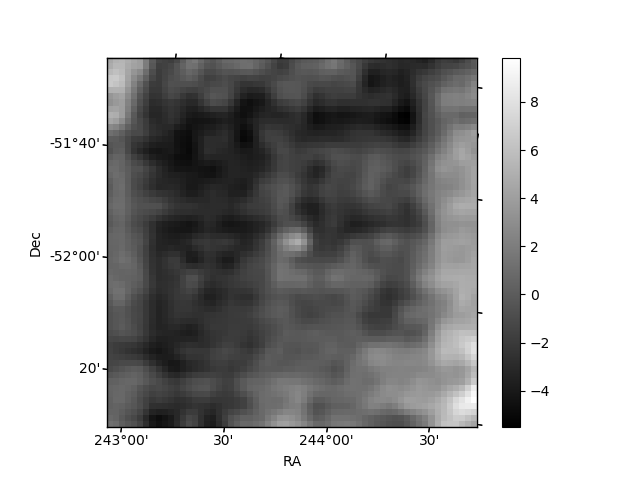
Histogram calculated using DETX and DETY for each event in the final _common_clean file
| Quadrant A | 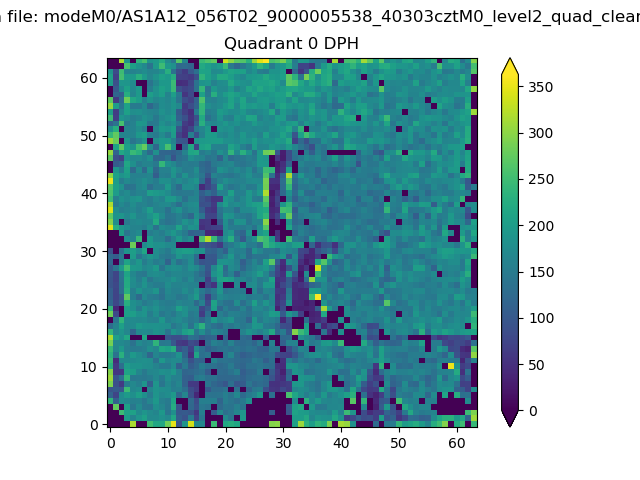 |
 |
Quadrant B |
|---|---|---|---|
| Quadrant D | 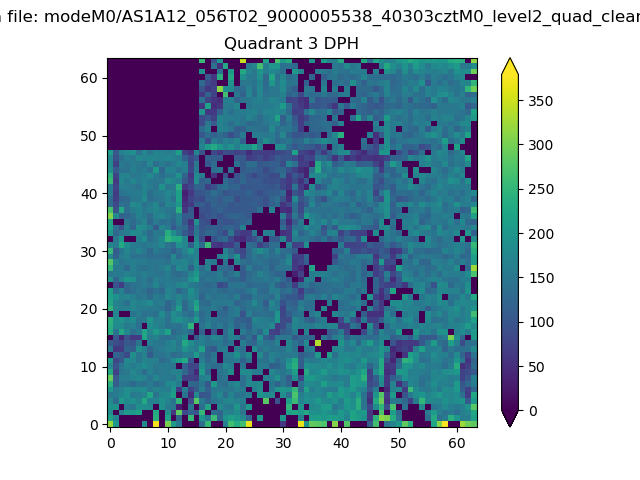 |
 |
Quadrant C |
| Plot type | Count rate plots | Images |
|---|---|---|
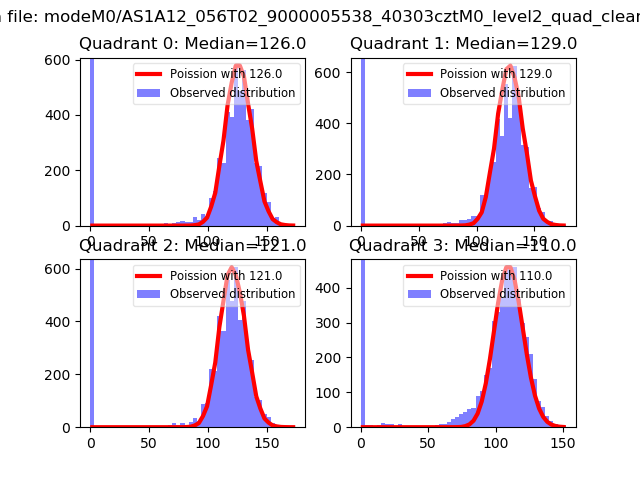
| Comparison with Poisson distribution Blue bars denote a histogram of data divided into 1 sec bins. Red curve is a Poisson curve with rate = median count rate of data. |
 |
 |
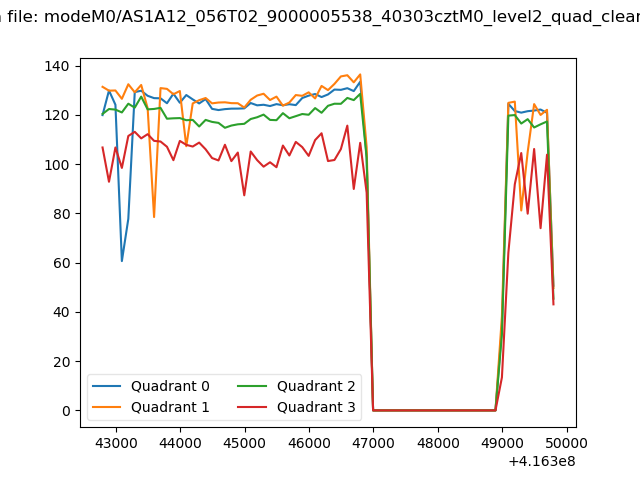
| Quadrant-wise count rates Data is divided into 100 sec bins |
 |
|
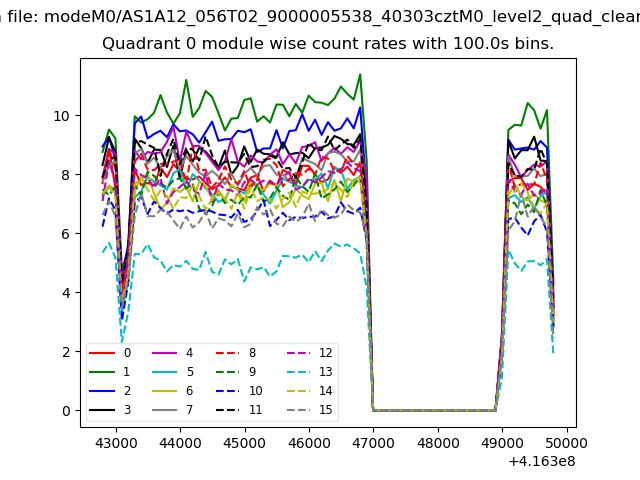
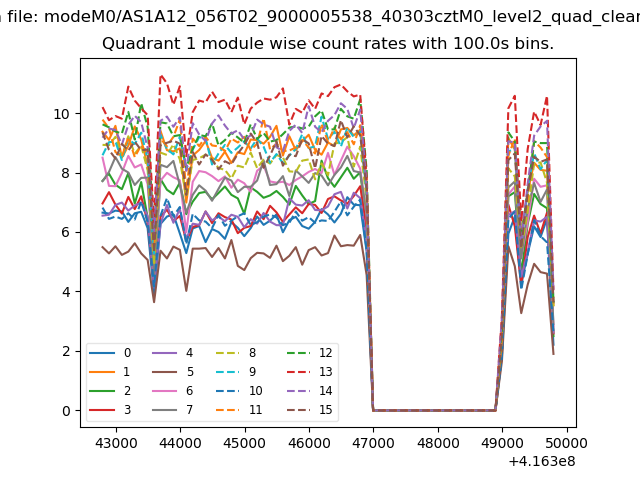
| Module-wise count rates for Quadrant A Data is divided into 100 sec bins |
 |
 |
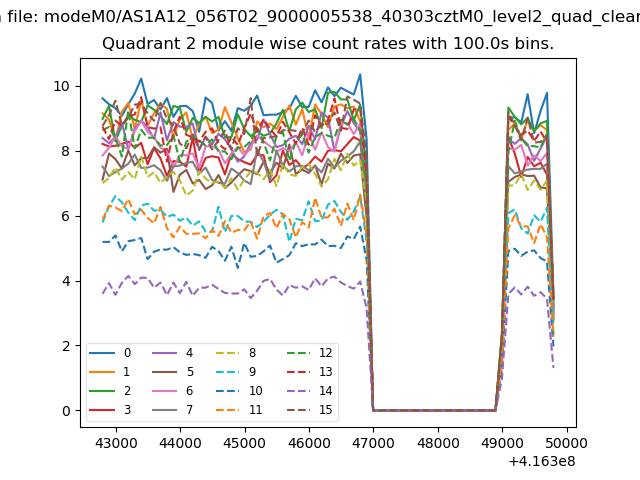
| Module-wise count rates for Quadrant B Data is divided into 100 sec bins |
 |
 |
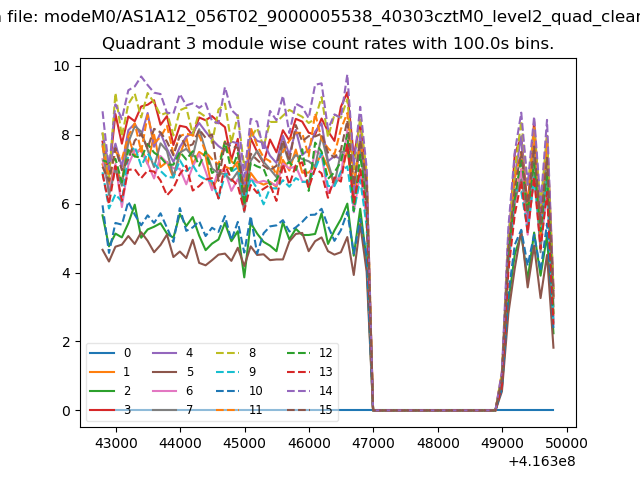
| Module-wise count rates for Quadrant C Data is divided into 100 sec bins |
 |
 |
| Module-wise count rates for Quadrant D Data is divided into 100 sec bins |
 |
 |
| Parameter | Plot |
|---|---|
| CZT HV Monitor | 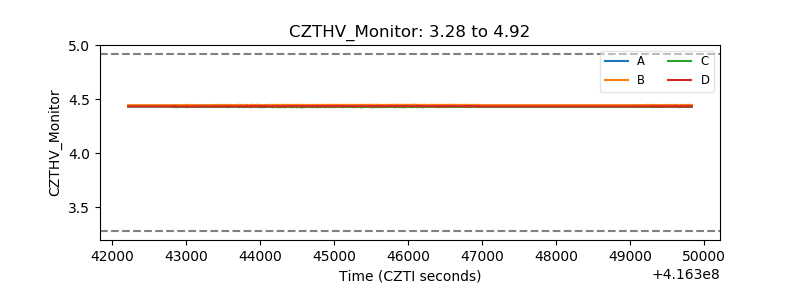 |
| D_VDD | 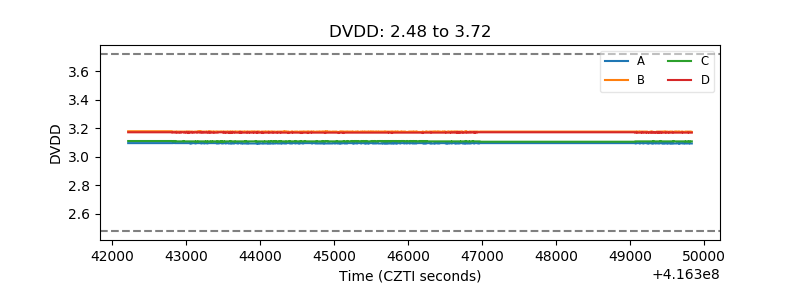 |
| Temperature 1 | 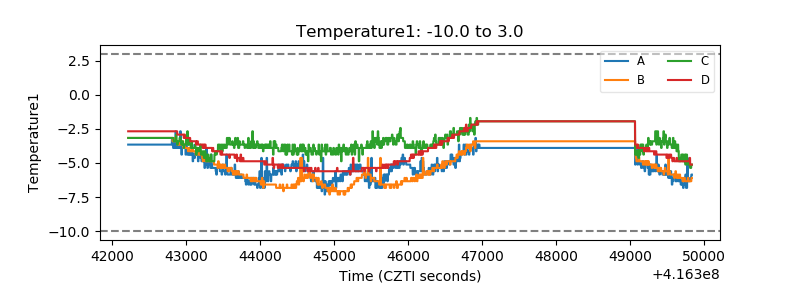 |
| Veto HV Monitor | 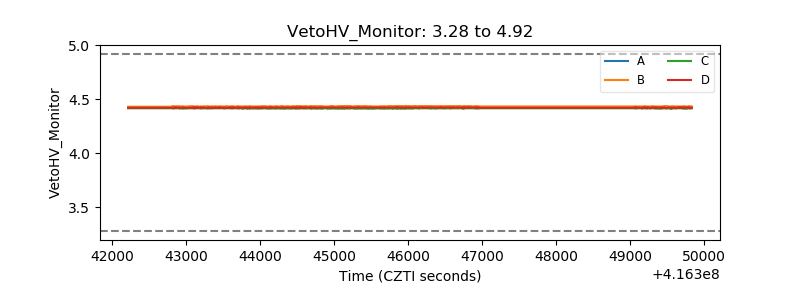 |
| Veto LLD | 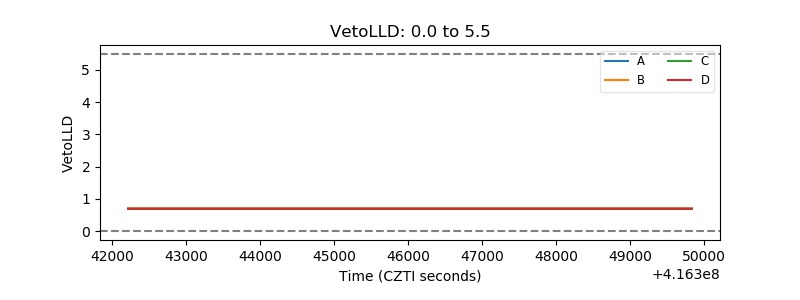 |
| Alpha Counter | 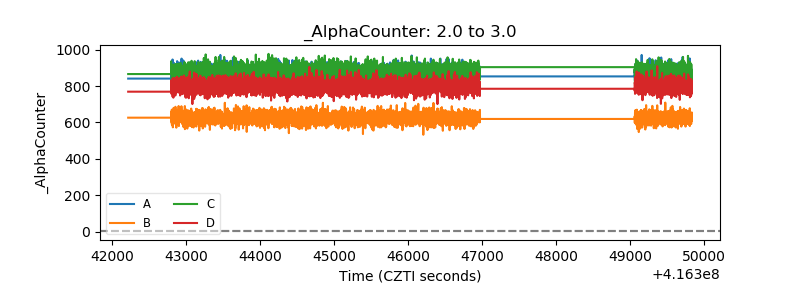 |
| _CPM_Rate | 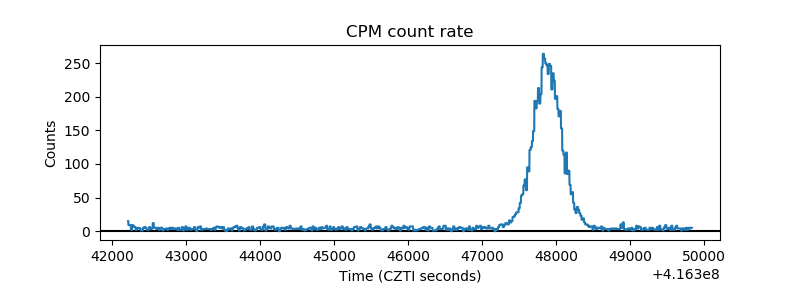 |
| CZT Counter | 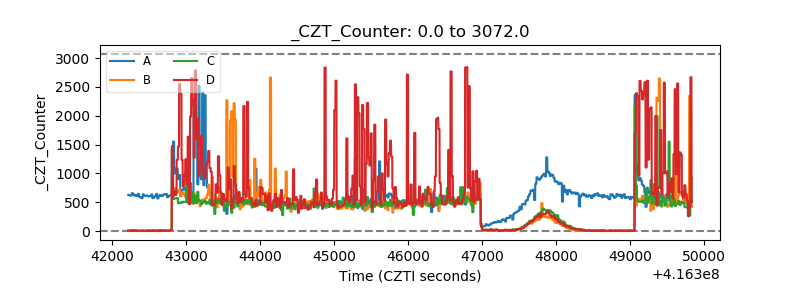 |
| +2.5 Volts monitor |  |
| +5 Volts monitor | 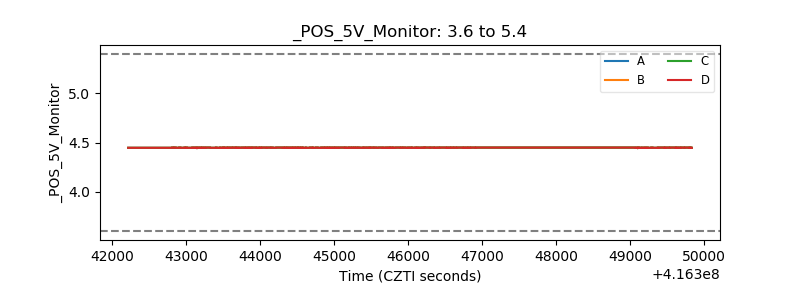 |
| _ROLL_ROT | 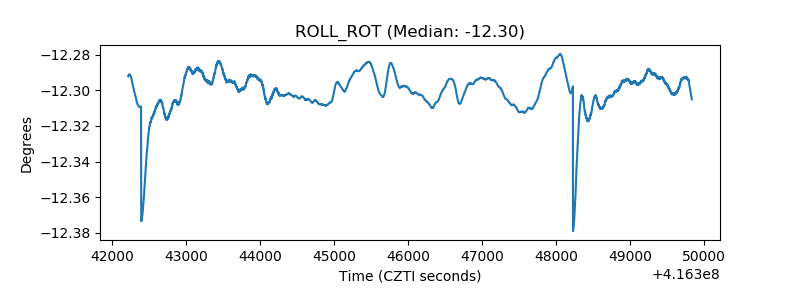 |
| _Roll_DEC | 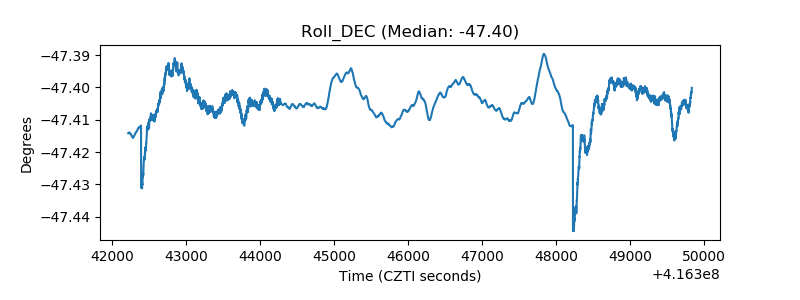 |
| _Roll_RA | 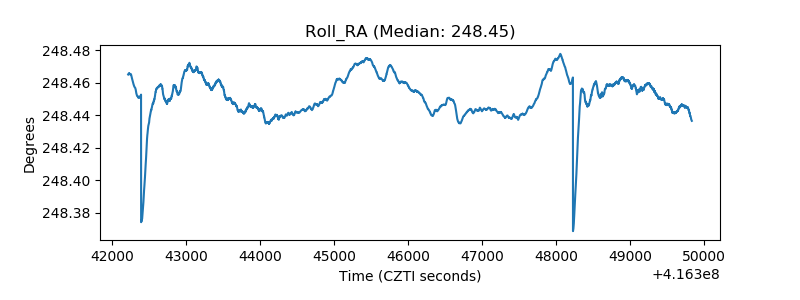 |
| Veto Counter | 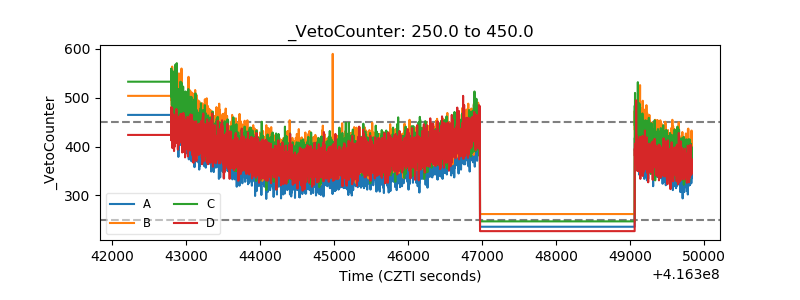 |