| Param | Original file | Final file |
|---|---|---|
| Filename | modeM0/AS1A12_056T02_9000005538_40304cztM0_level2.fits | modeM0/AS1A12_056T02_9000005538_40304cztM0_level2_quad_clean.evt |
| Size (bytes) | 350,170,560 | 89,864,640 |
| Size | 333.9 MB | 85.7 MB |
| Events in quadrant A | 2,979,705 | 616,368 |
| Events in quadrant B | 2,859,207 | 627,616 |
| Events in quadrant C | 2,831,089 | 594,252 |
| Events in quadrant D | 3,890,292 | 521,607 |
| Mode M0 | |||
|---|---|---|---|
| Quadrant | BADHDUFLAG | Total packets | Discarded packets |
| A | 0 | 11958 | 3 |
| B | 0 | 11823 | 2 |
| C | 0 | 11551 | 2 |
| D | 0 | 15091 | 2 |
| Mode M9 | |||
|---|---|---|---|
| Quadrant | BADHDUFLAG | Total packets | Discarded packets |
| A | 0 | 25 | 0 |
| B | 0 | 25 | 0 |
| C | 0 | 25 | 0 |
| D | 0 | 26 | 0 |
| Mode SS | |||
|---|---|---|---|
| Quadrant | BADHDUFLAG | Total packets | Discarded packets |
| A | 0 | 104 | 0 |
| B | 0 | 104 | 0 |
| C | 0 | 104 | 0 |
| D | 0 | 104 | 0 |
| Quadrant | Total seconds | Saturated seconds | Saturation percentage |
|---|---|---|---|
| A | 5161 | 83 | 1.608215% |
| B | 5161 | 95 | 1.840729% |
| C | 5161 | 70 | 1.356326% |
| D | 5161 | 327 | 6.335981% |
Noise dominated data is calculated using 1-second bins in cleaned event files. If a bin has >2000 counts, and if more than 50% of those come from <1% of pixels, then it is considered to be noise-dominated and hence unusable.
| Quadrant | # 1 sec bins | Bins with >0 counts | Bins with >2000 counts | High rate bins dominated by noise | Noise dominated (total time) | Noise dominated (detector-on time) | Marked lightcurve |
|---|---|---|---|---|---|---|---|
| A | 7042 | 5161 | 51 | 51 | 0.72% | 0.99% | 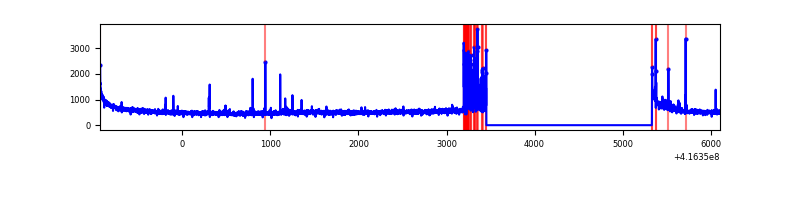 |
| B | 7042 | 5162 | 77 | 77 | 1.09% | 1.49% | 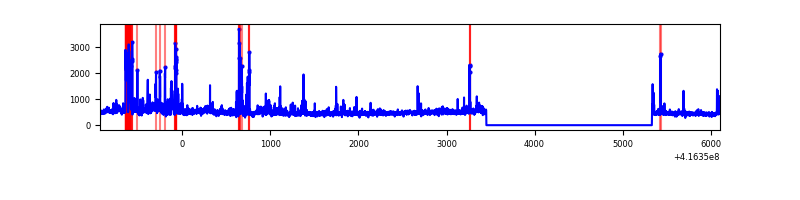 |
| C | 7042 | 5162 | 52 | 52 | 0.74% | 1.01% | 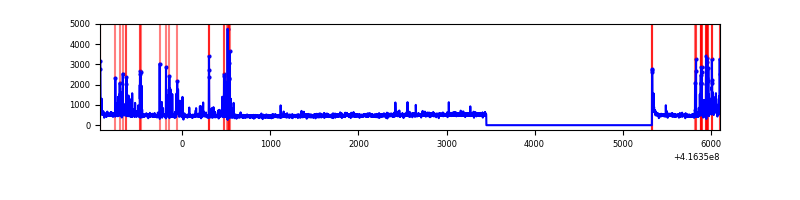 |
| D | 7042 | 5162 | 317 | 317 | 4.50% | 6.14% | 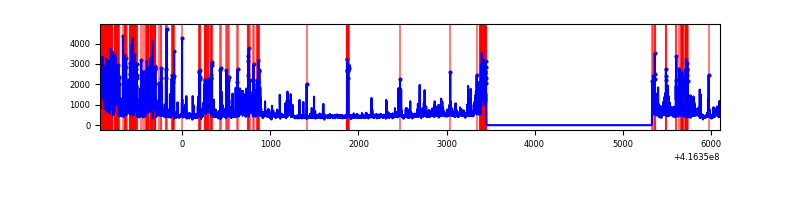 |
Top three noisy pixels from each quadrant. If the there are fewer than three noisy pixels in the level2.evt file, extra rows are filled as -1
| Pixel properties | Quadrant properties | ||||||
|---|---|---|---|---|---|---|---|
| Quadrant | DetID | PixID | Counts | Sigma | Mean | Median | Sigma |
| A | 10 | 83 | 457954 | 3884.4 | 575 | 566 | 117.7 |
| A | 13 | 248 | 202814 | 1717.61 | 575 | 566 | 117.7 |
| A | 12 | 189 | 45682 | 383.15 | 575 | 566 | 117.7 |
| B | 5 | 255 | 269176 | 2429.36 | 574 | 559 | 110.6 |
| B | 4 | 171 | 159866 | 1440.77 | 574 | 559 | 110.6 |
| B | 7 | 202 | 100221 | 901.34 | 574 | 559 | 110.6 |
| C | 14 | 254 | 356042 | 2667.65 | 565 | 571 | 133.3 |
| C | 15 | 214 | 222311 | 1664.06 | 565 | 571 | 133.3 |
| C | 0 | 10 | 37615 | 278.0 | 565 | 571 | 133.3 |
| D | 12 | 227 | 950587 | 7108.65 | 547 | 533 | 133.6 |
| D | 1 | 47 | 439924 | 3287.68 | 547 | 533 | 133.6 |
| D | 2 | 250 | 176611 | 1317.48 | 547 | 533 | 133.6 |
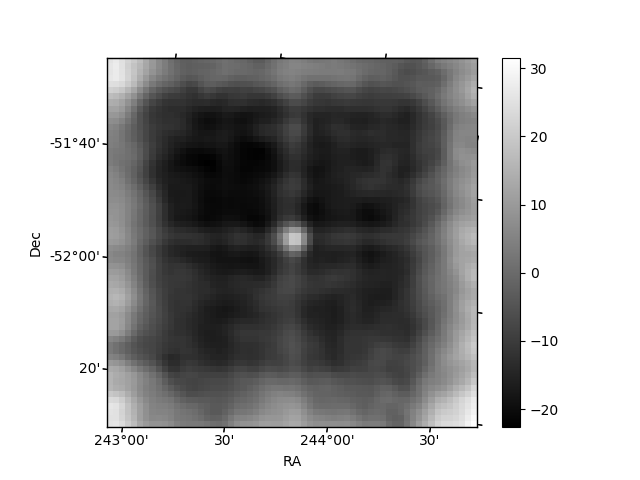
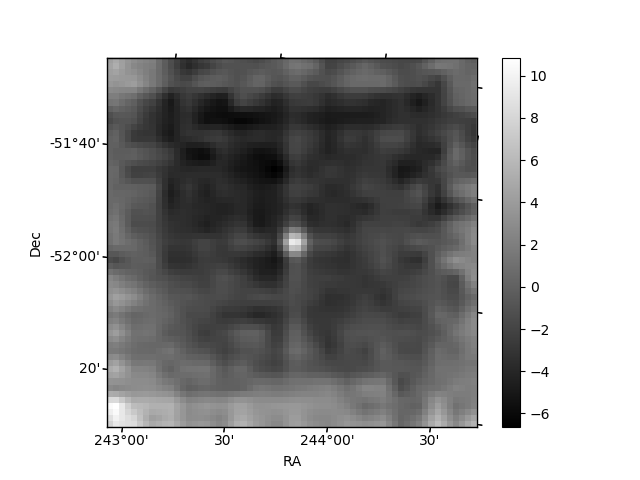
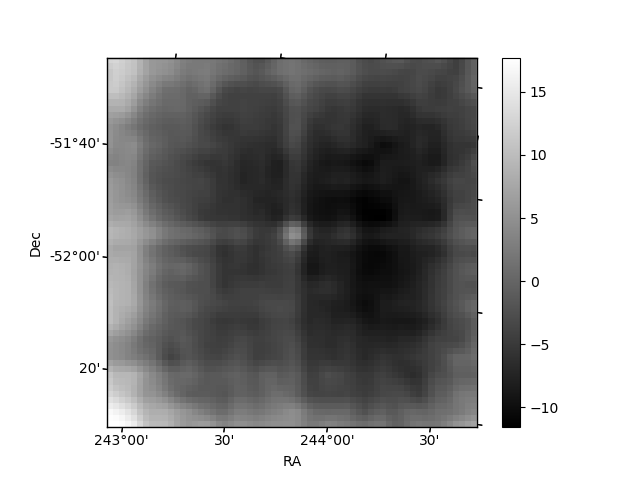
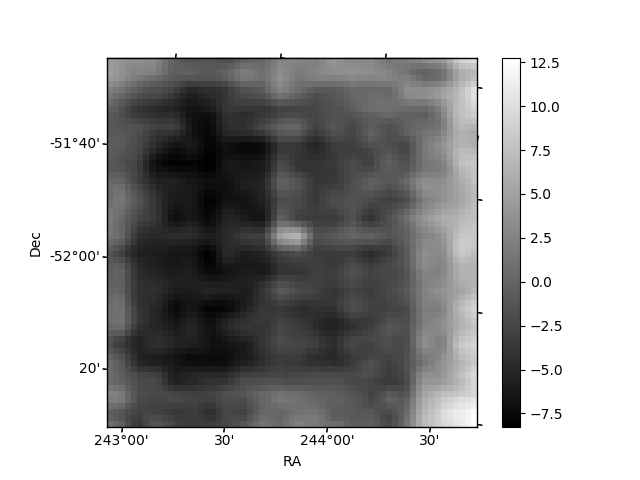
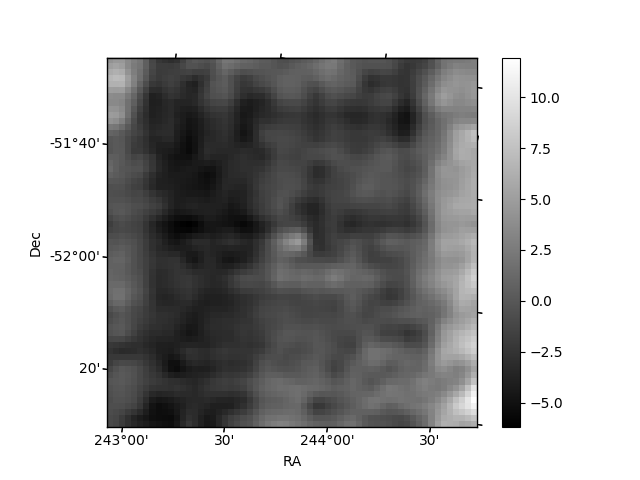
Histogram calculated using DETX and DETY for each event in the final _common_clean file
| Quadrant A | 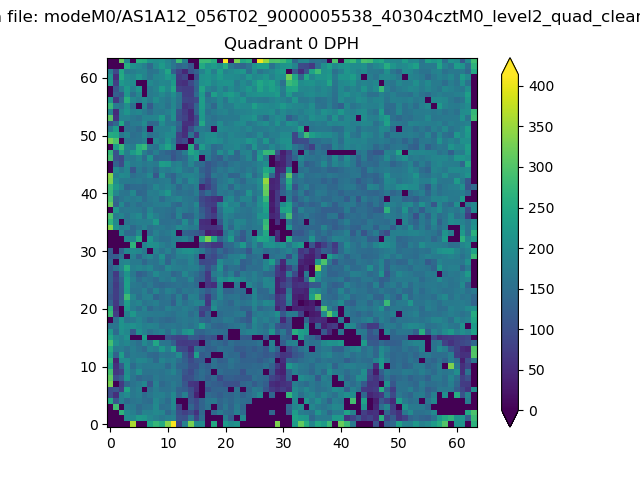 |
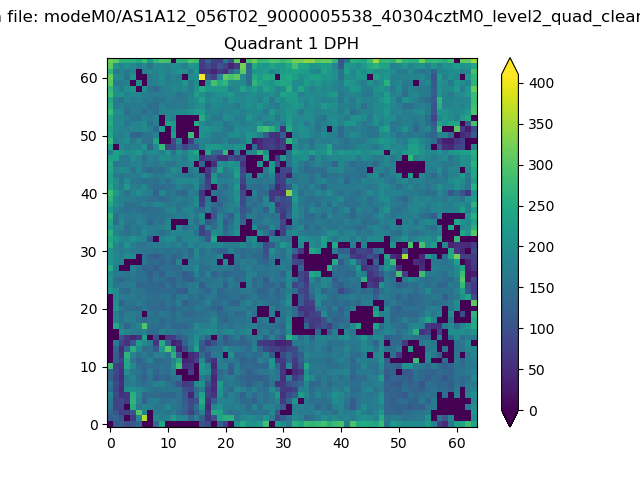 |
Quadrant B |
|---|---|---|---|
| Quadrant D | 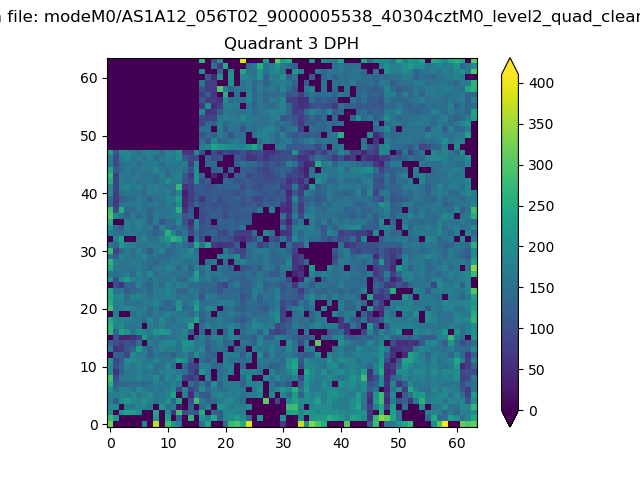 |
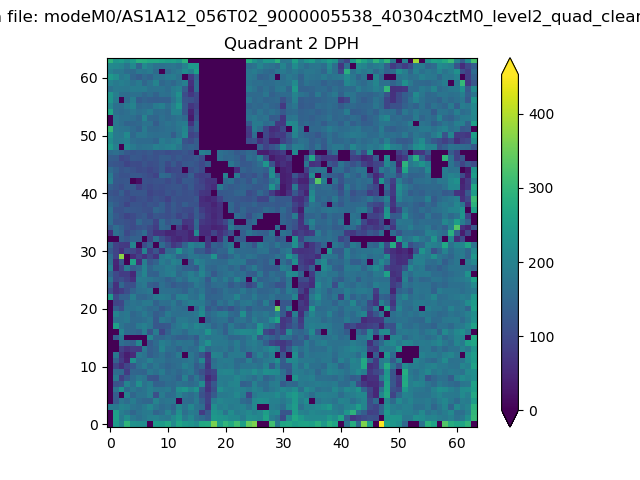 |
Quadrant C |
| Plot type | Count rate plots | Images |
|---|---|---|
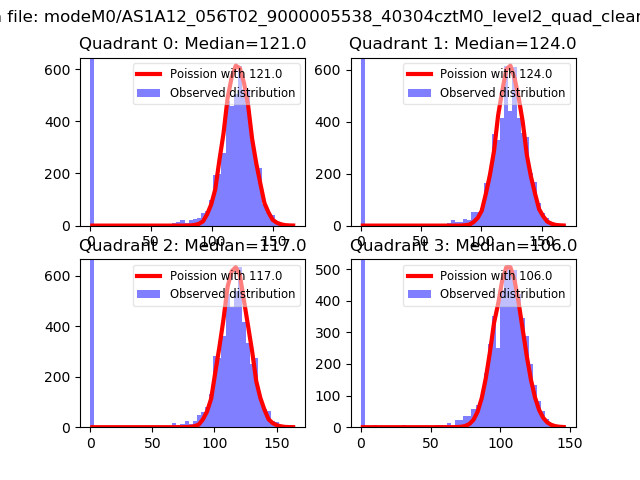
| Comparison with Poisson distribution Blue bars denote a histogram of data divided into 1 sec bins. Red curve is a Poisson curve with rate = median count rate of data. |
 |
 |
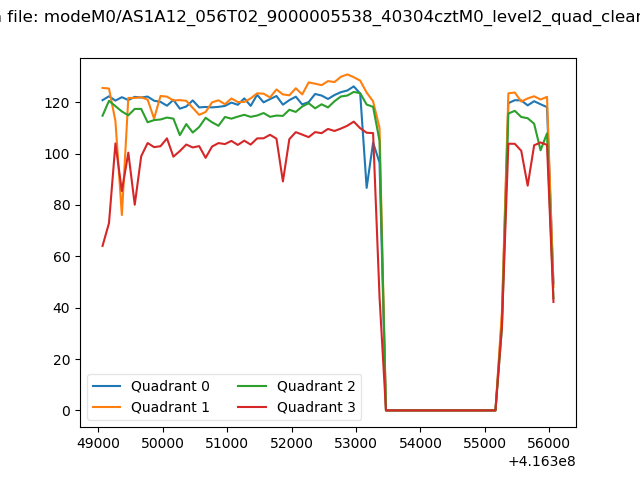
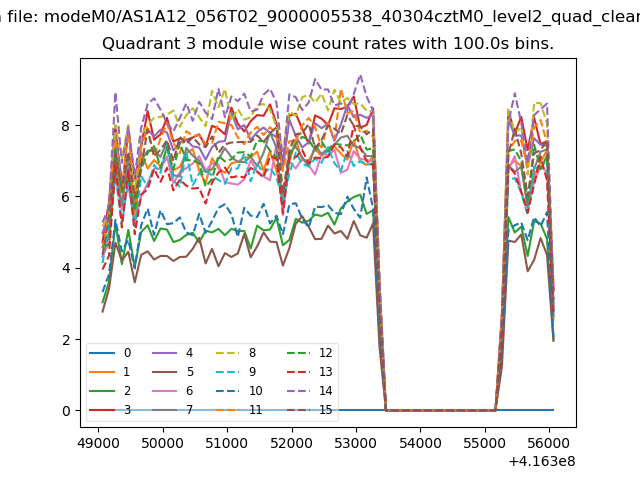
| Quadrant-wise count rates Data is divided into 100 sec bins |
 |
|
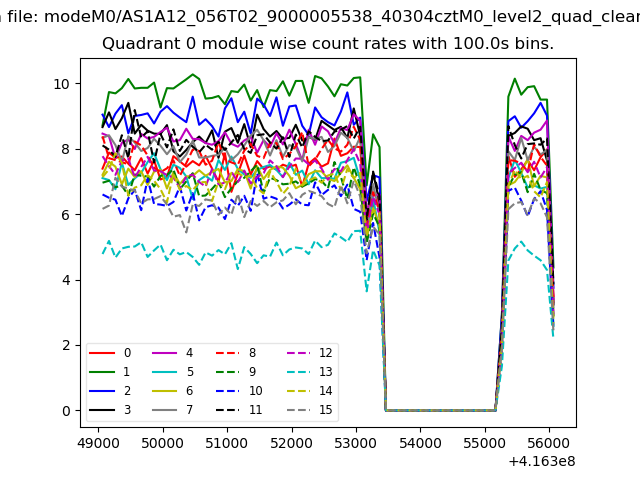
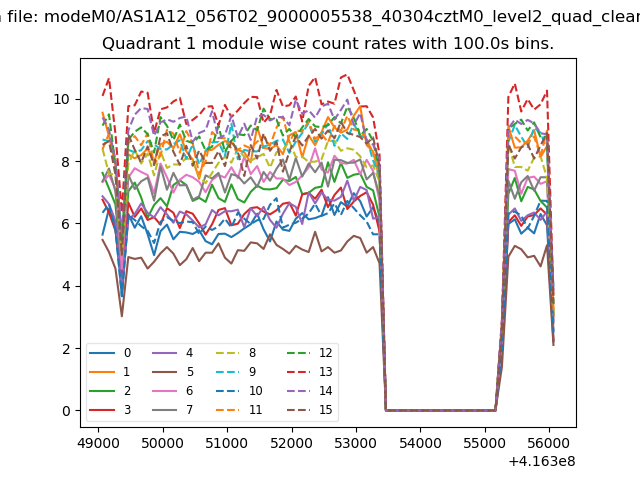
| Module-wise count rates for Quadrant A Data is divided into 100 sec bins |
 |
 |
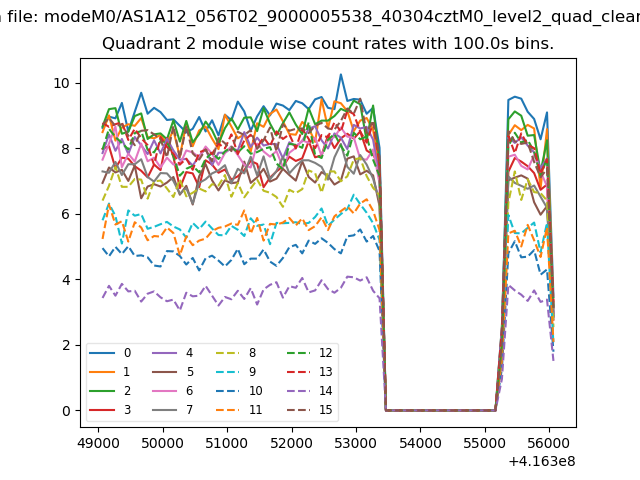
| Module-wise count rates for Quadrant B Data is divided into 100 sec bins |
 |
 |
| Module-wise count rates for Quadrant C Data is divided into 100 sec bins |
 |
 |
| Module-wise count rates for Quadrant D Data is divided into 100 sec bins |
 |
 |
| Parameter | Plot |
|---|---|
| CZT HV Monitor | 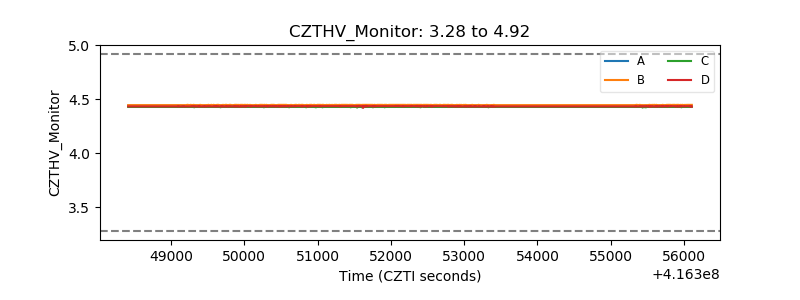 |
| D_VDD | 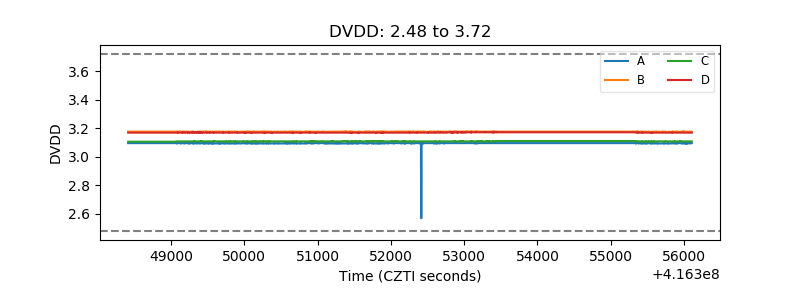 |
| Temperature 1 | 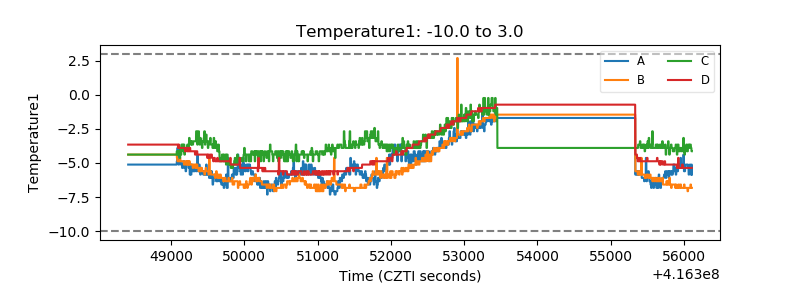 |
| Veto HV Monitor | 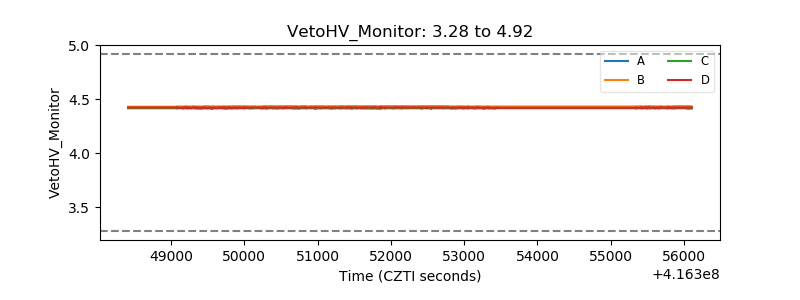 |
| Veto LLD | 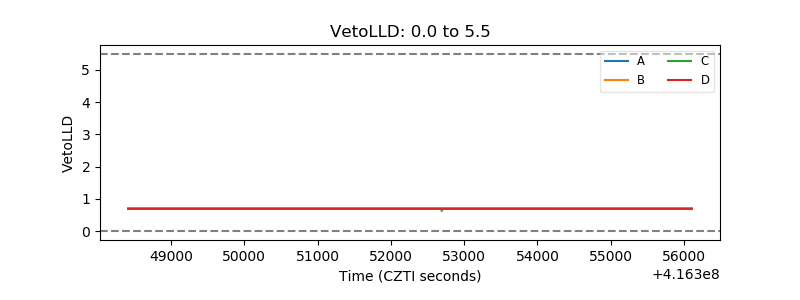 |
| Alpha Counter | 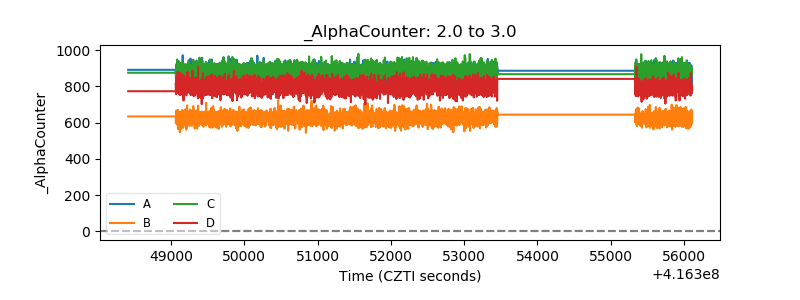 |
| _CPM_Rate | 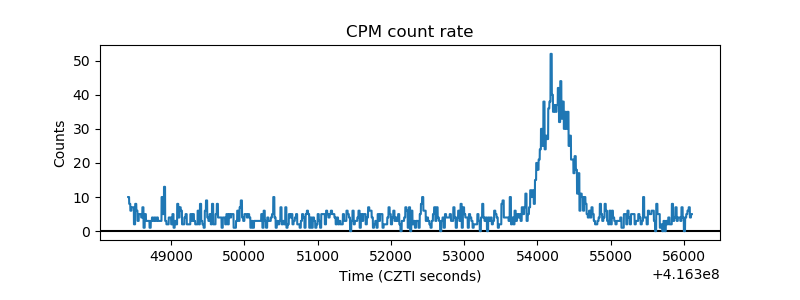 |
| CZT Counter | 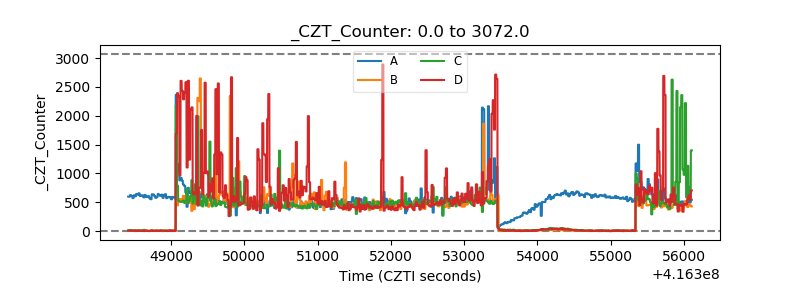 |
| +2.5 Volts monitor |  |
| +5 Volts monitor | 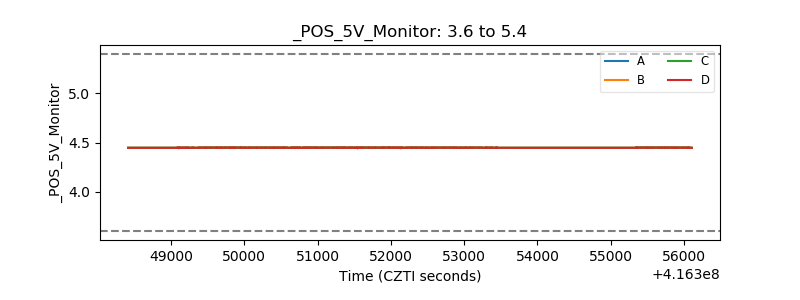 |
| _ROLL_ROT | 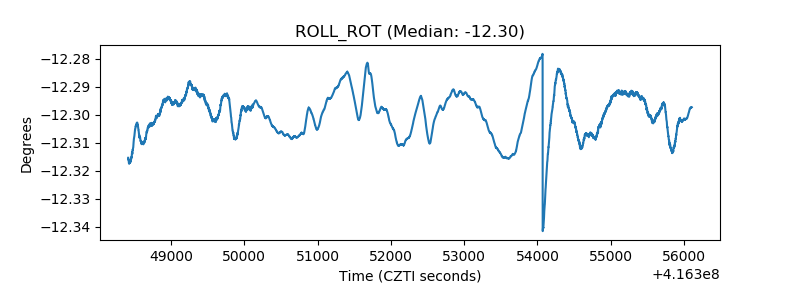 |
| _Roll_DEC | 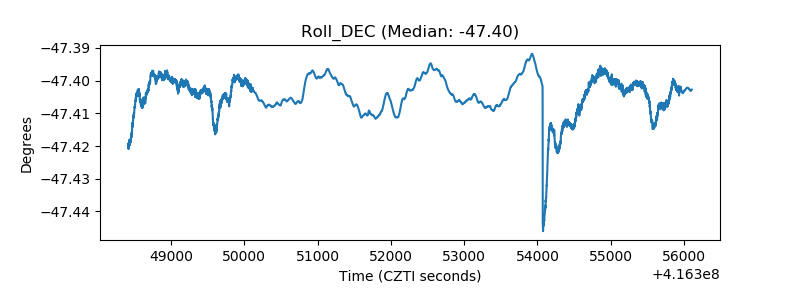 |
| _Roll_RA | 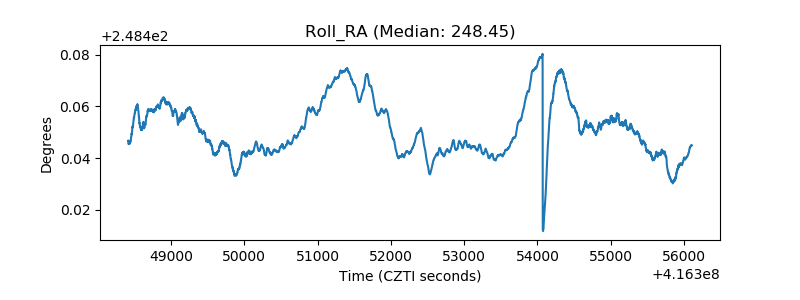 |
| Veto Counter | 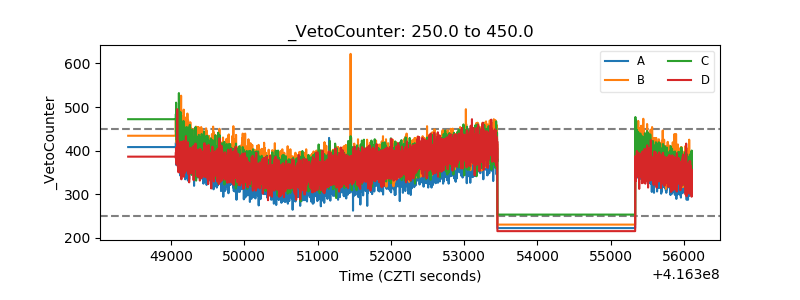 |