| Param | Original file | Final file |
|---|---|---|
| Filename | modeM0/AS1A12_056T02_9000005538_40305cztM0_level2.fits | modeM0/AS1A12_056T02_9000005538_40305cztM0_level2_quad_clean.evt |
| Size (bytes) | 393,981,120 | 92,534,400 |
| Size | 375.7 MB | 88.2 MB |
| Events in quadrant A | 3,861,466 | 618,515 |
| Events in quadrant B | 2,613,756 | 656,561 |
| Events in quadrant C | 2,821,546 | 622,448 |
| Events in quadrant D | 4,859,161 | 519,275 |
| Mode M0 | |||
|---|---|---|---|
| Quadrant | BADHDUFLAG | Total packets | Discarded packets |
| A | 0 | 14950 | 3 |
| B | 0 | 11565 | 2 |
| C | 0 | 11726 | 2 |
| D | 0 | 18332 | 2 |
| Mode M9 | |||
|---|---|---|---|
| Quadrant | BADHDUFLAG | Total packets | Discarded packets |
| A | 0 | 25 | 0 |
| B | 0 | 25 | 0 |
| C | 0 | 25 | 0 |
| D | 0 | 26 | 0 |
| Mode SS | |||
|---|---|---|---|
| Quadrant | BADHDUFLAG | Total packets | Discarded packets |
| A | 0 | 112 | 0 |
| B | 0 | 112 | 0 |
| C | 0 | 112 | 0 |
| D | 0 | 112 | 0 |
| Quadrant | Total seconds | Saturated seconds | Saturation percentage |
|---|---|---|---|
| A | 5501 | 297 | 5.399018% |
| B | 5501 | 25 | 0.454463% |
| C | 5501 | 41 | 0.745319% |
| D | 5501 | 610 | 11.088893% |
Noise dominated data is calculated using 1-second bins in cleaned event files. If a bin has >2000 counts, and if more than 50% of those come from <1% of pixels, then it is considered to be noise-dominated and hence unusable.
| Quadrant | # 1 sec bins | Bins with >0 counts | Bins with >2000 counts | High rate bins dominated by noise | Noise dominated (total time) | Noise dominated (detector-on time) | Marked lightcurve |
|---|---|---|---|---|---|---|---|
| A | 7024 | 5502 | 218 | 218 | 3.10% | 3.96% | 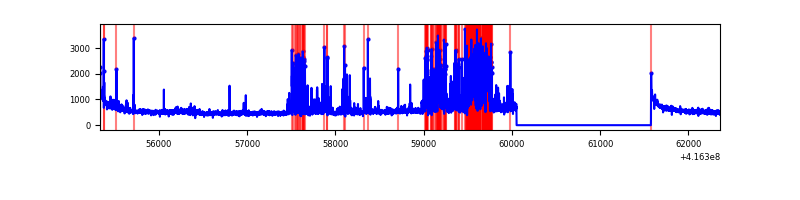 |
| B | 7024 | 5502 | 12 | 12 | 0.17% | 0.22% | 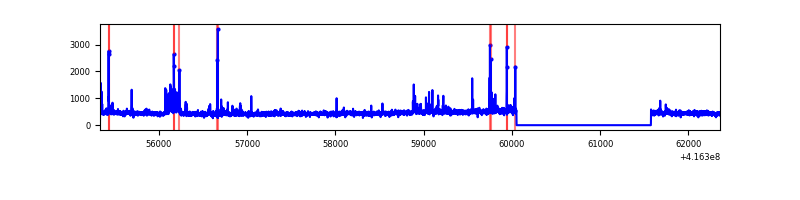 |
| C | 7024 | 5502 | 32 | 32 | 0.46% | 0.58% | 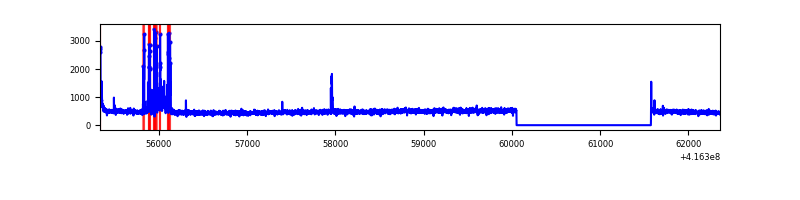 |
| D | 7024 | 5502 | 551 | 551 | 7.84% | 10.01% | 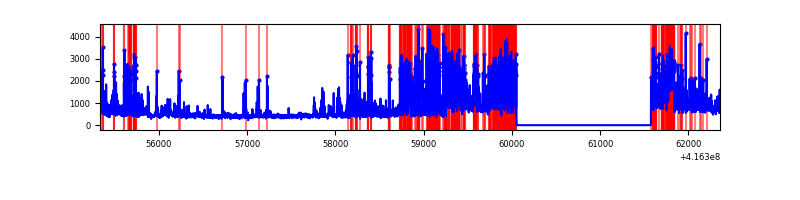 |
Top three noisy pixels from each quadrant. If the there are fewer than three noisy pixels in the level2.evt file, extra rows are filled as -1
| Pixel properties | Quadrant properties | ||||||
|---|---|---|---|---|---|---|---|
| Quadrant | DetID | PixID | Counts | Sigma | Mean | Median | Sigma |
| A | 13 | 248 | 911793 | 7397.06 | 600 | 589 | 123.2 |
| A | 10 | 83 | 483581 | 3920.88 | 600 | 589 | 123.2 |
| A | 12 | 189 | 50304 | 403.58 | 600 | 589 | 123.2 |
| B | 4 | 171 | 97984 | 820.86 | 612 | 596 | 118.6 |
| B | 5 | 255 | 61530 | 513.6 | 612 | 596 | 118.6 |
| B | 4 | 170 | 18875 | 154.07 | 612 | 596 | 118.6 |
| C | 15 | 214 | 233702 | 1635.43 | 603 | 607 | 142.5 |
| C | 14 | 254 | 192692 | 1347.7 | 603 | 607 | 142.5 |
| C | 0 | 10 | 25569 | 175.14 | 603 | 607 | 142.5 |
| D | 12 | 227 | 1786200 | 12629.0 | 572 | 556 | 141.4 |
| D | 1 | 47 | 369234 | 2607.48 | 572 | 556 | 141.4 |
| D | 2 | 250 | 258380 | 1823.46 | 572 | 556 | 141.4 |
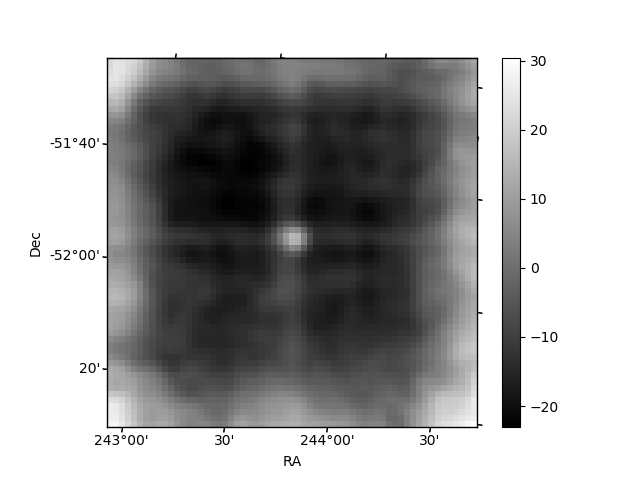
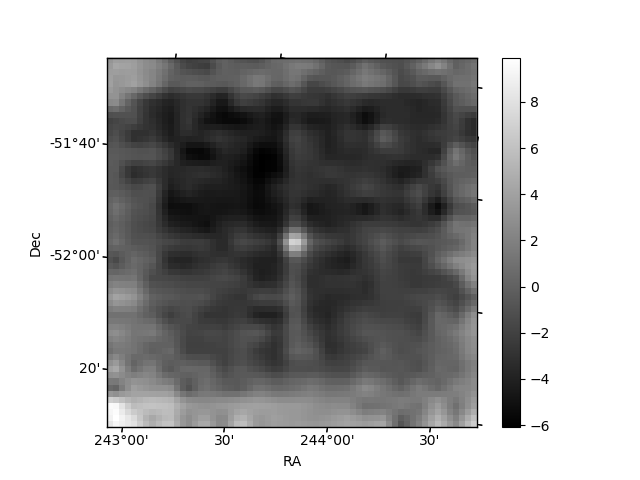
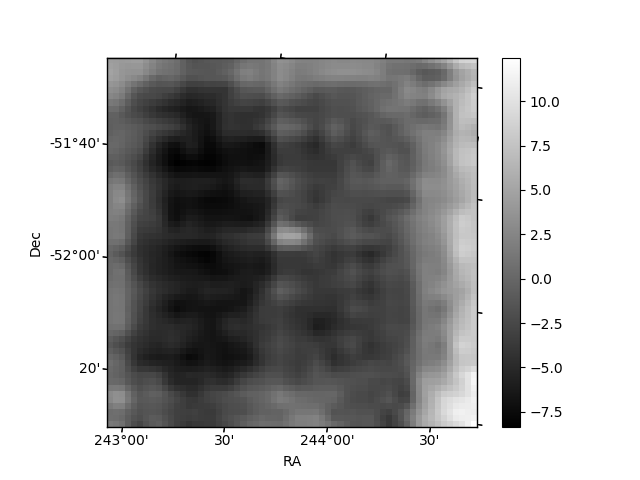
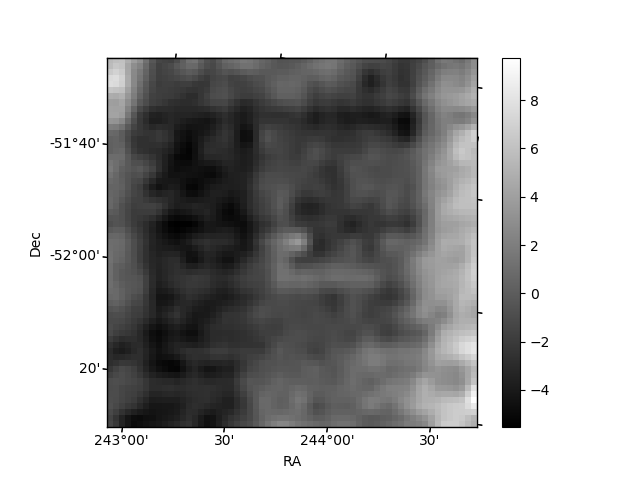
Histogram calculated using DETX and DETY for each event in the final _common_clean file
| Quadrant A | 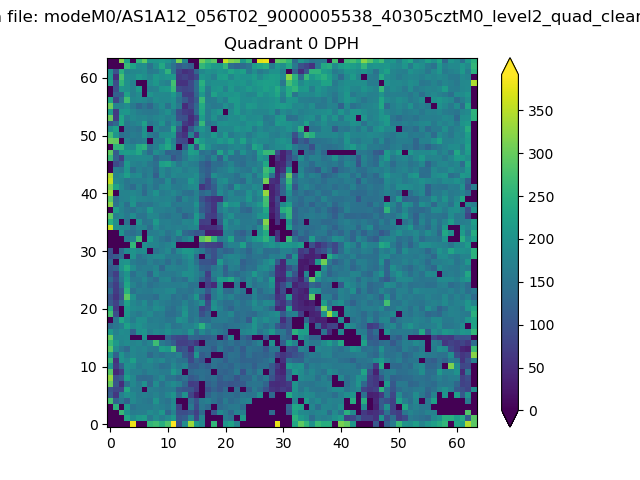 |
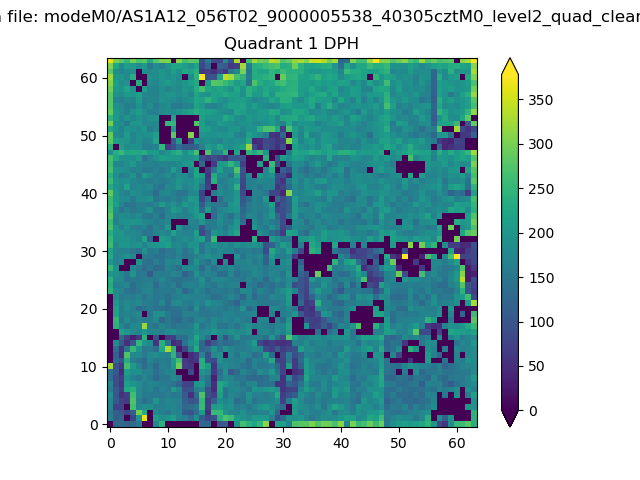 |
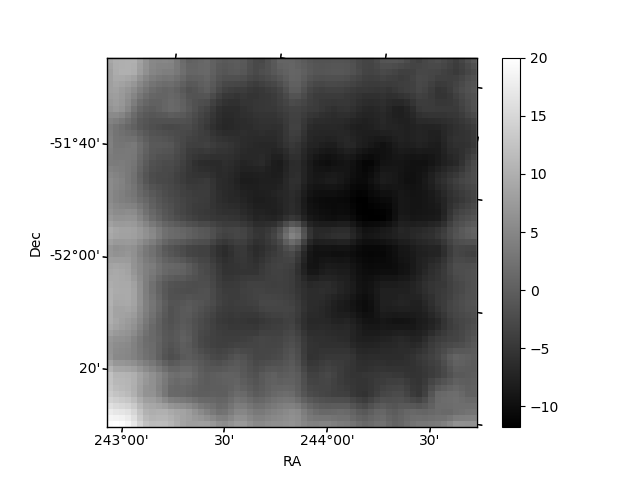
Quadrant B |
|---|---|---|---|
| Quadrant D | 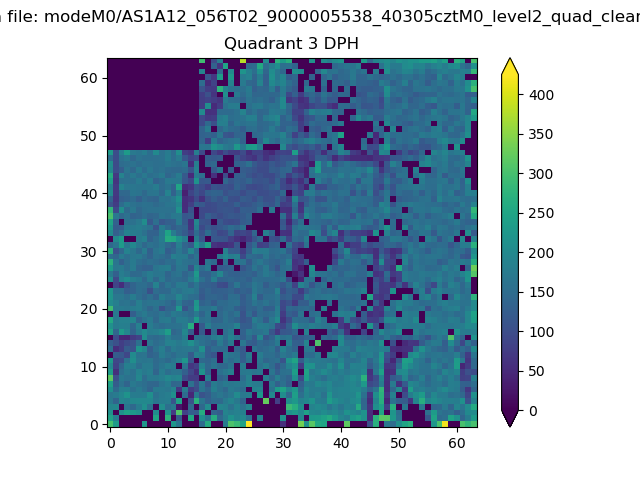 |
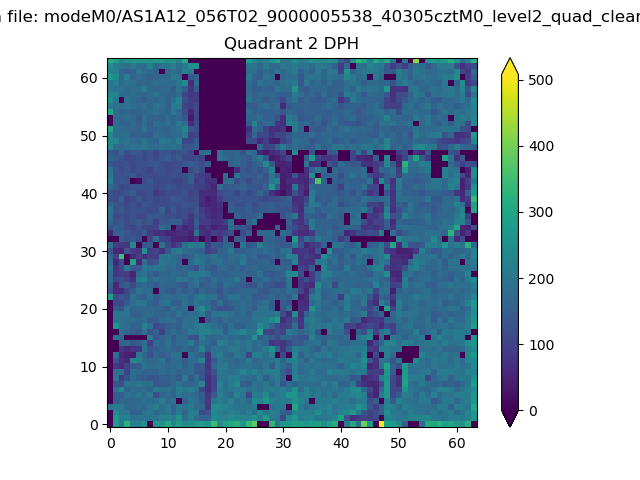 |
Quadrant C |
| Plot type | Count rate plots | Images |
|---|---|---|
| Comparison with Poisson distribution Blue bars denote a histogram of data divided into 1 sec bins. Red curve is a Poisson curve with rate = median count rate of data. |
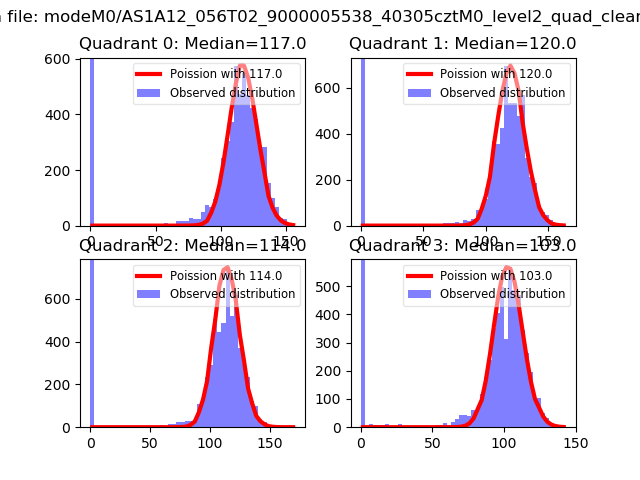 |
 |
| Quadrant-wise count rates Data is divided into 100 sec bins |
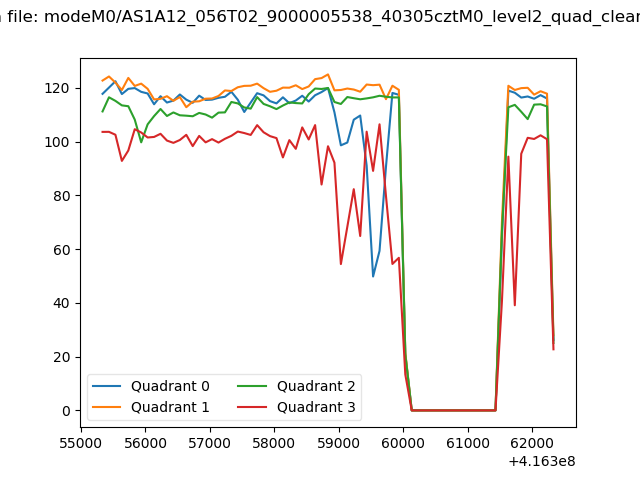 |
|
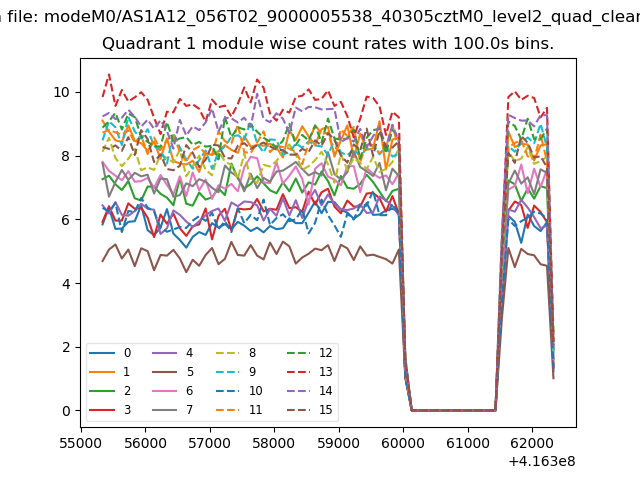
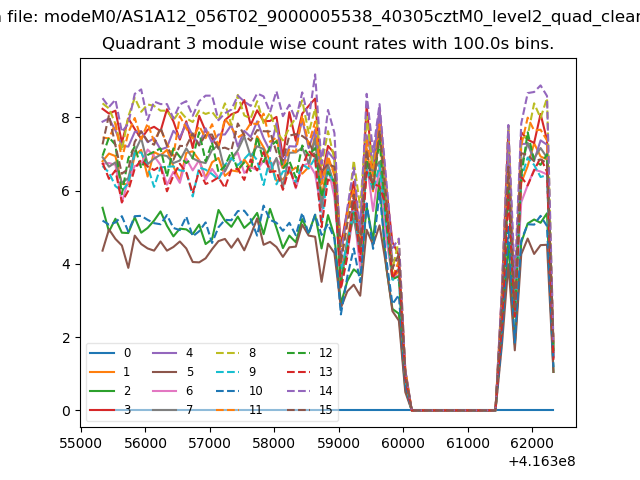
| Module-wise count rates for Quadrant A Data is divided into 100 sec bins |
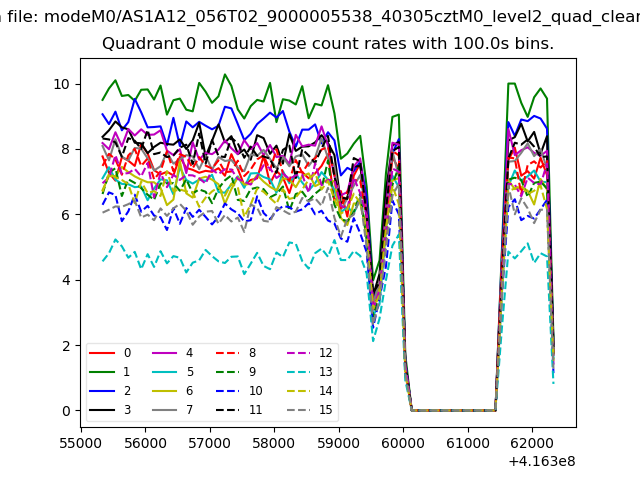 |
 |
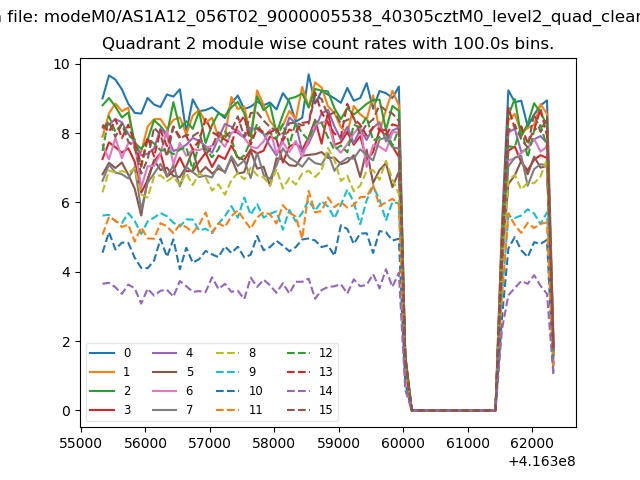
| Module-wise count rates for Quadrant B Data is divided into 100 sec bins |
 |
 |
| Module-wise count rates for Quadrant C Data is divided into 100 sec bins |
 |
 |
| Module-wise count rates for Quadrant D Data is divided into 100 sec bins |
 |
 |
| Parameter | Plot |
|---|---|
| CZT HV Monitor | 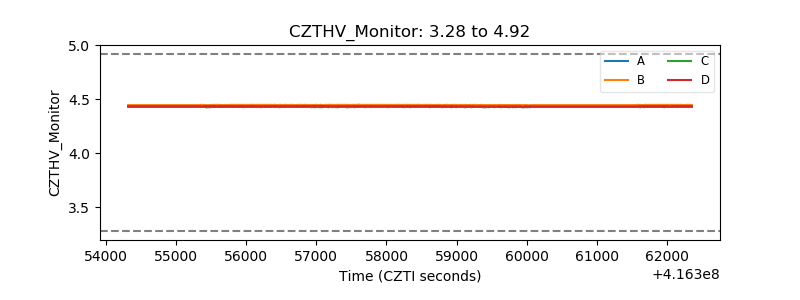 |
| D_VDD | 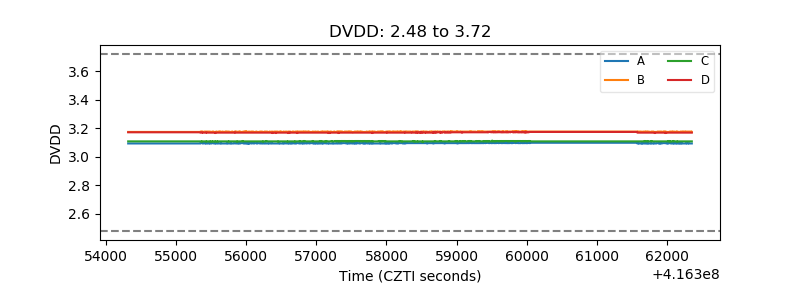 |
| Temperature 1 | 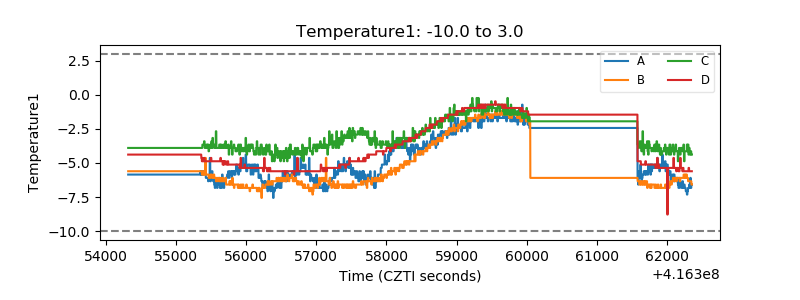 |
| Veto HV Monitor | 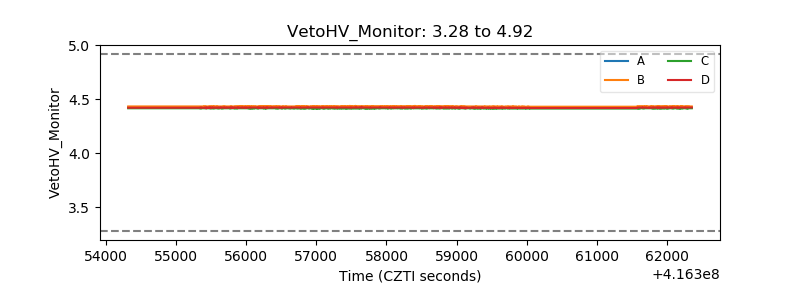 |
| Veto LLD | 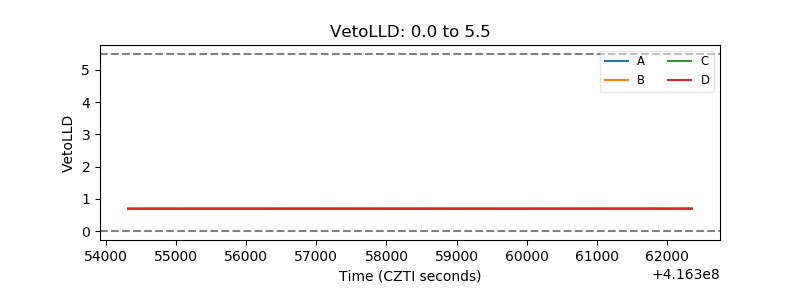 |
| Alpha Counter | 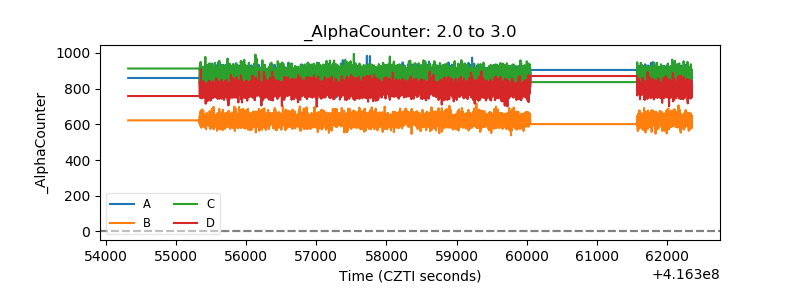 |
| _CPM_Rate | 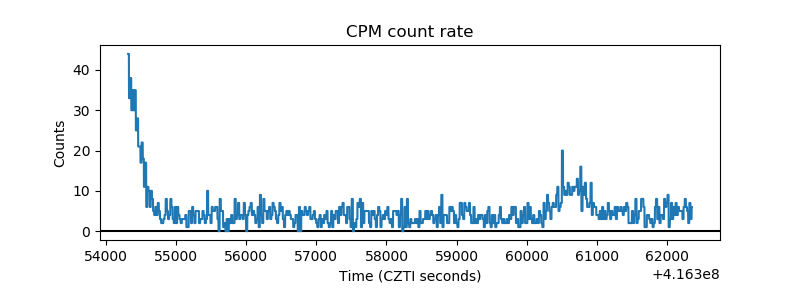 |
| CZT Counter | 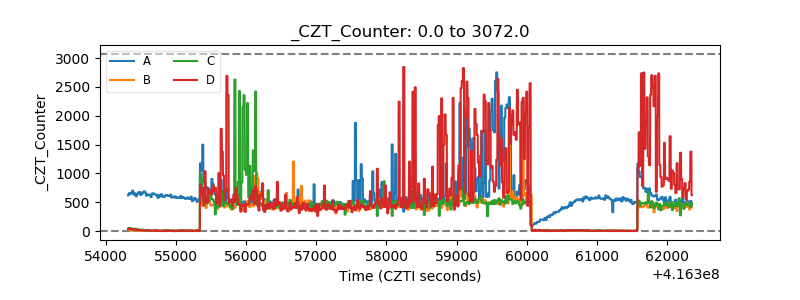 |
| +2.5 Volts monitor |  |
| +5 Volts monitor | 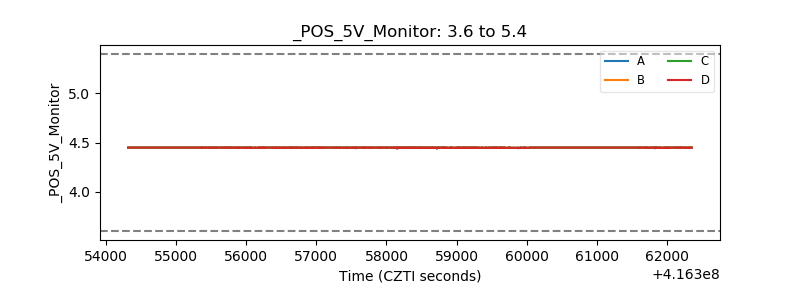 |
| _ROLL_ROT | 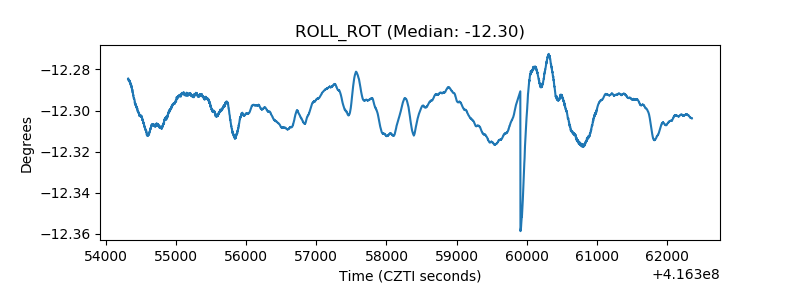 |
| _Roll_DEC | 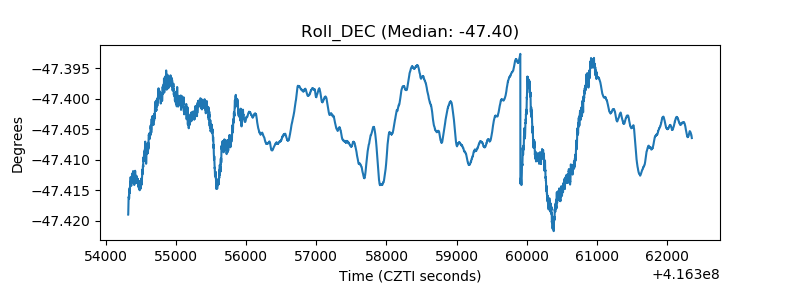 |
| _Roll_RA | 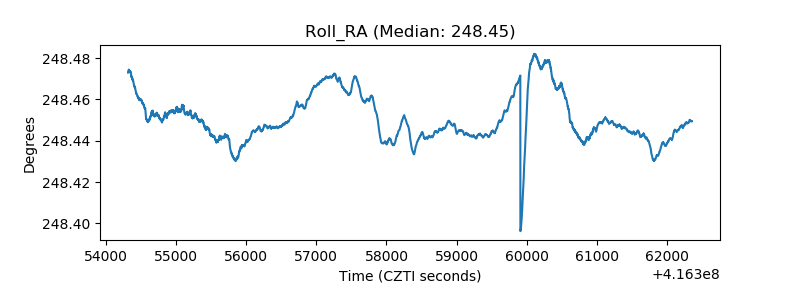 |
| Veto Counter | 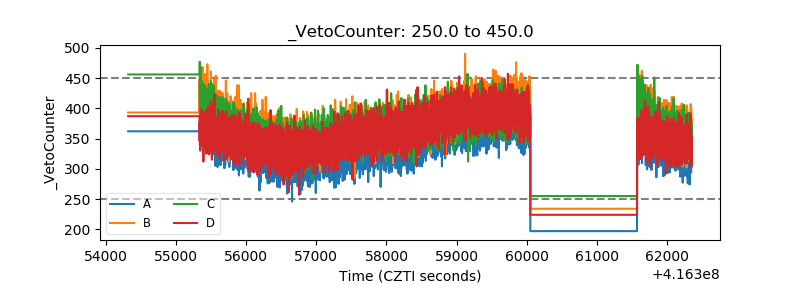 |