| Param | Original file | Final file |
|---|---|---|
| Filename | modeM0/AS1A12_056T02_9000005538_40306cztM0_level2.fits | modeM0/AS1A12_056T02_9000005538_40306cztM0_level2_quad_clean.evt |
| Size (bytes) | 453,674,880 | 94,314,240 |
| Size | 432.7 MB | 89.9 MB |
| Events in quadrant A | 3,200,542 | 666,989 |
| Events in quadrant B | 2,902,317 | 683,059 |
| Events in quadrant C | 2,781,202 | 650,425 |
| Events in quadrant D | 7,453,133 | 445,629 |
| Mode M0 | |||
|---|---|---|---|
| Quadrant | BADHDUFLAG | Total packets | Discarded packets |
| A | 0 | 13048 | 3 |
| B | 0 | 12675 | 2 |
| C | 0 | 11818 | 2 |
| D | 0 | 26255 | 2 |
| Mode M9 | |||
|---|---|---|---|
| Quadrant | BADHDUFLAG | Total packets | Discarded packets |
| A | 0 | 27 | 0 |
| B | 0 | 27 | 0 |
| C | 0 | 27 | 0 |
| D | 0 | 28 | 0 |
| Mode SS | |||
|---|---|---|---|
| Quadrant | BADHDUFLAG | Total packets | Discarded packets |
| A | 0 | 118 | 0 |
| B | 0 | 118 | 0 |
| C | 0 | 118 | 0 |
| D | 0 | 118 | 0 |
| Quadrant | Total seconds | Saturated seconds | Saturation percentage |
|---|---|---|---|
| A | 5864 | 26 | 0.443383% |
| B | 5864 | 22 | 0.375171% |
| C | 5864 | 2 | 0.034106% |
| D | 5864 | 1677 | 28.598226% |
Noise dominated data is calculated using 1-second bins in cleaned event files. If a bin has >2000 counts, and if more than 50% of those come from <1% of pixels, then it is considered to be noise-dominated and hence unusable.
| Quadrant | # 1 sec bins | Bins with >0 counts | Bins with >2000 counts | High rate bins dominated by noise | Noise dominated (total time) | Noise dominated (detector-on time) | Marked lightcurve |
|---|---|---|---|---|---|---|---|
| A | 7208 | 5865 | 7 | 7 | 0.10% | 0.12% | 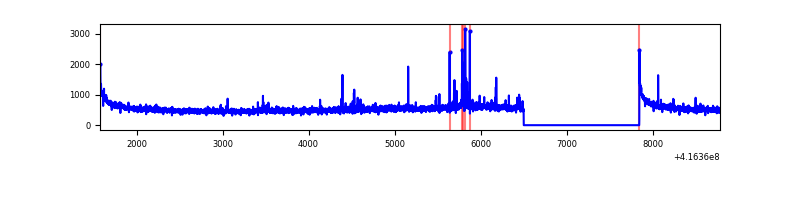 |
| B | 7208 | 5865 | 7 | 7 | 0.10% | 0.12% | 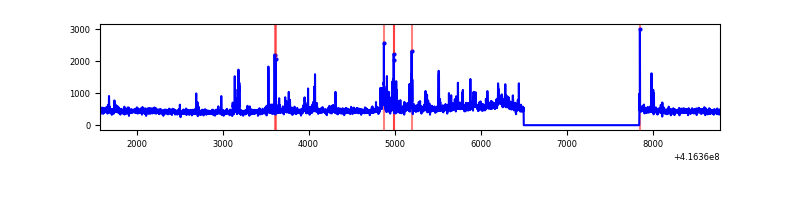 |
| C | 7208 | 5865 | 1 | 1 | 0.01% | 0.02% | 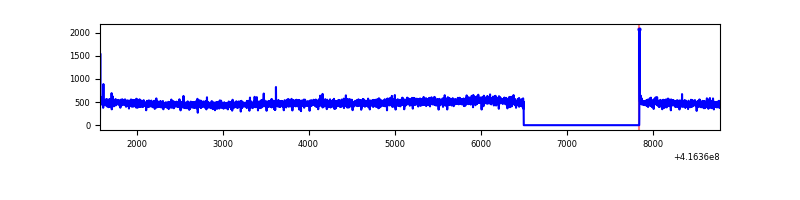 |
| D | 7207 | 5864 | 1566 | 1566 | 21.73% | 26.71% | 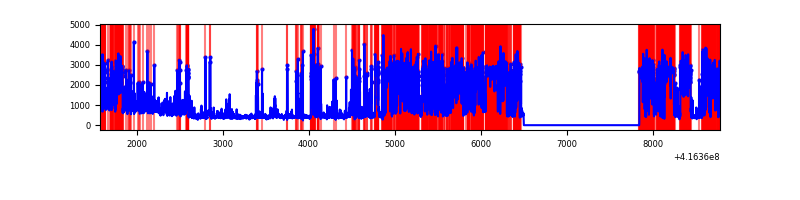 |
Top three noisy pixels from each quadrant. If the there are fewer than three noisy pixels in the level2.evt file, extra rows are filled as -1
| Pixel properties | Quadrant properties | ||||||
|---|---|---|---|---|---|---|---|
| Quadrant | DetID | PixID | Counts | Sigma | Mean | Median | Sigma |
| A | 10 | 83 | 506284 | 3766.25 | 654 | 640 | 134.3 |
| A | 2 | 79 | 65818 | 485.47 | 654 | 640 | 134.3 |
| A | 13 | 248 | 33860 | 247.44 | 654 | 640 | 134.3 |
| B | 4 | 171 | 161203 | 1265.67 | 652 | 635 | 126.9 |
| B | 0 | 229 | 57479 | 448.07 | 652 | 635 | 126.9 |
| B | 0 | 230 | 47137 | 366.55 | 652 | 635 | 126.9 |
| C | 15 | 214 | 248945 | 1634.81 | 644 | 649 | 151.9 |
| C | 0 | 10 | 10601 | 65.53 | 644 | 649 | 151.9 |
| C | 9 | 187 | 6823 | 40.65 | 644 | 649 | 151.9 |
| D | 12 | 227 | 4733618 | 34849.21 | 543 | 527 | 135.8 |
| D | 1 | 47 | 354651 | 2607.37 | 543 | 527 | 135.8 |
| D | 2 | 250 | 153703 | 1127.82 | 543 | 527 | 135.8 |
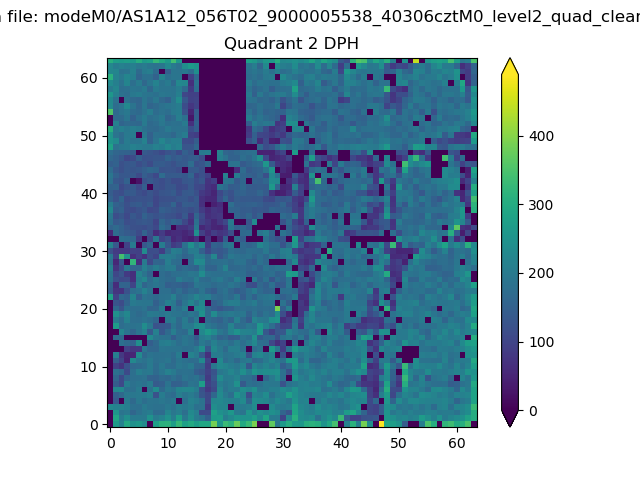
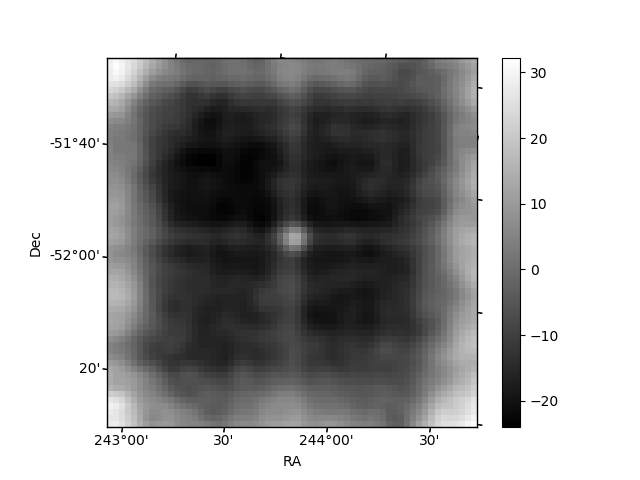
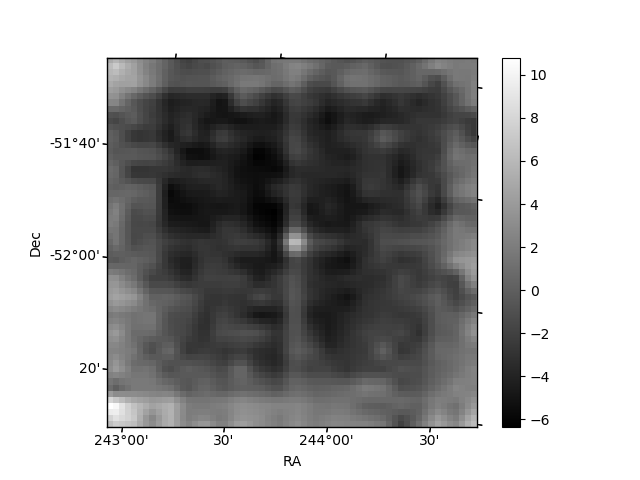
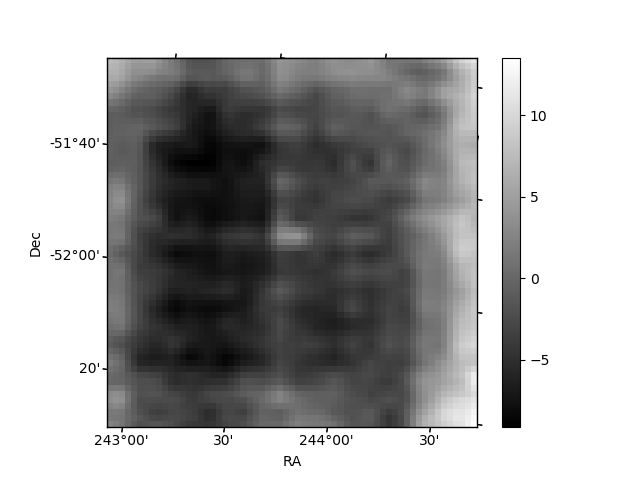
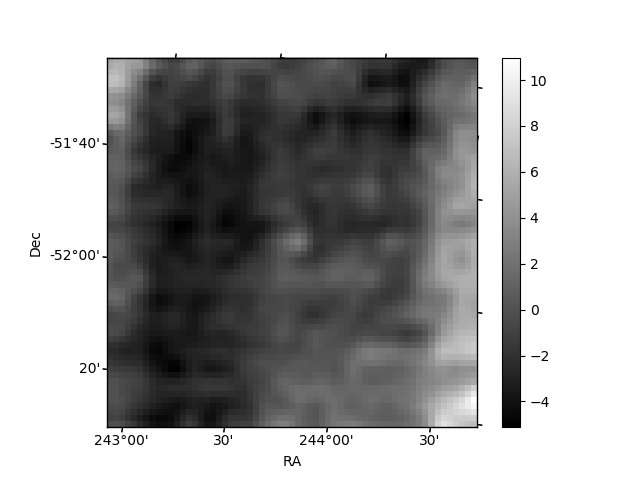
Histogram calculated using DETX and DETY for each event in the final _common_clean file
| Quadrant A | 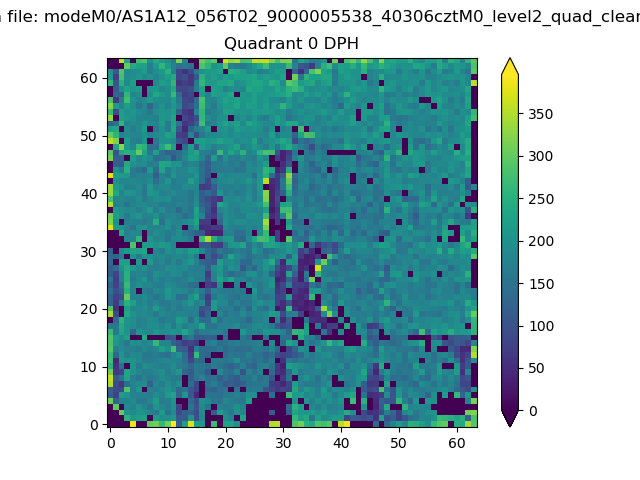 |
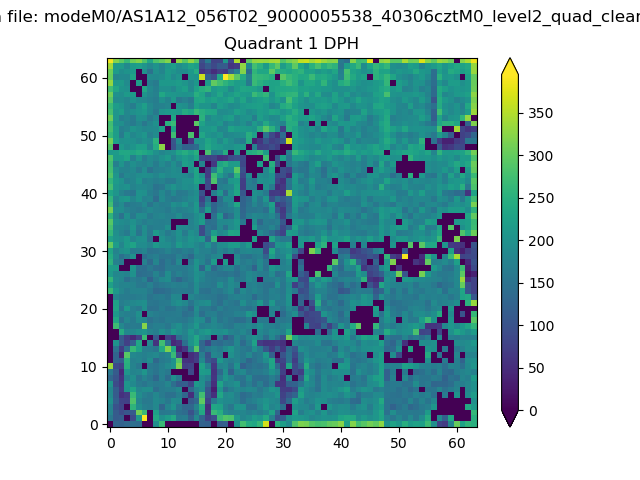 |
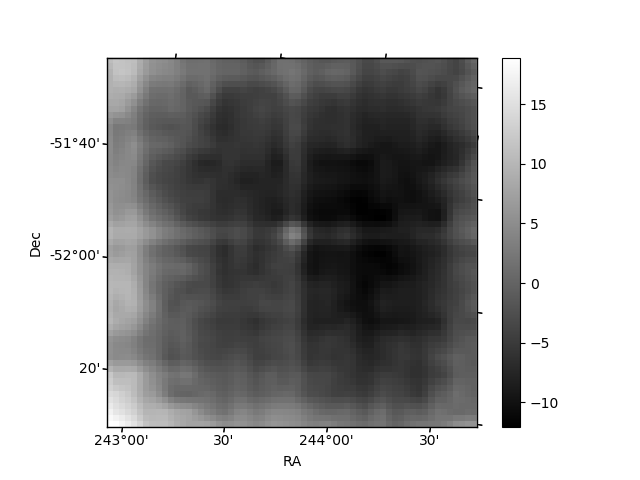
Quadrant B |
|---|---|---|---|
| Quadrant D | 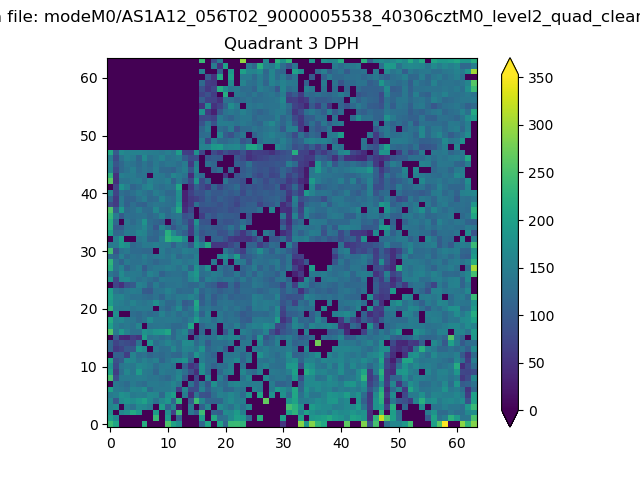 |
 |
Quadrant C |
| Plot type | Count rate plots | Images |
|---|---|---|
| Comparison with Poisson distribution Blue bars denote a histogram of data divided into 1 sec bins. Red curve is a Poisson curve with rate = median count rate of data. |
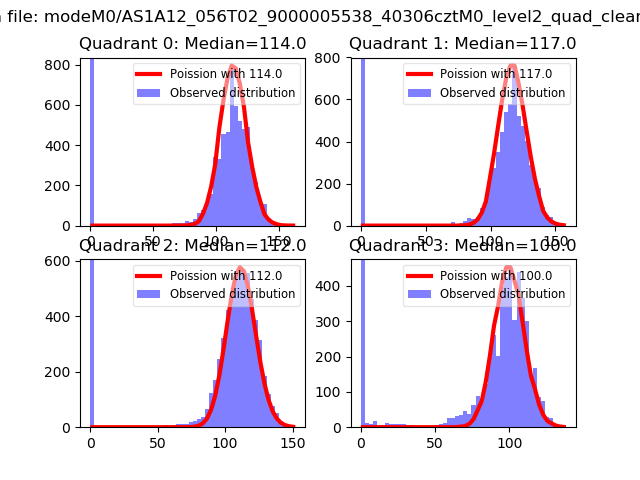 |
 |
| Quadrant-wise count rates Data is divided into 100 sec bins |
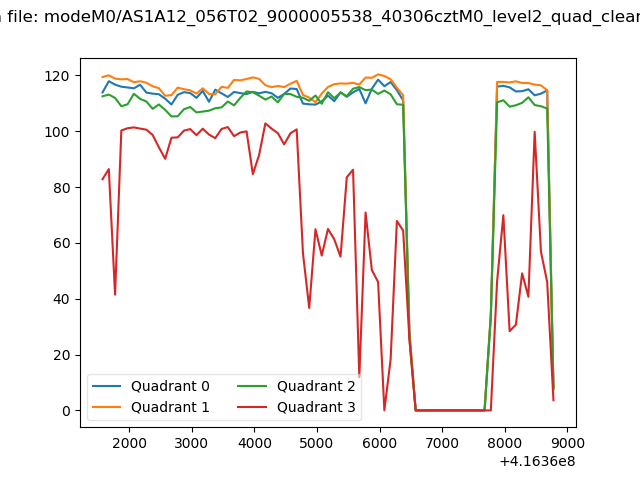 |
|
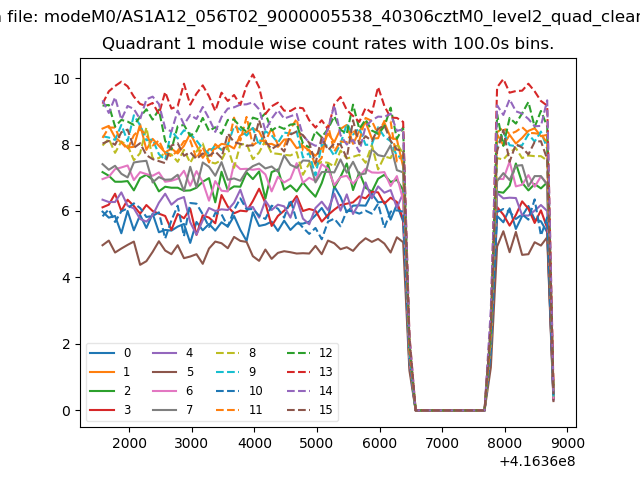
| Module-wise count rates for Quadrant A Data is divided into 100 sec bins |
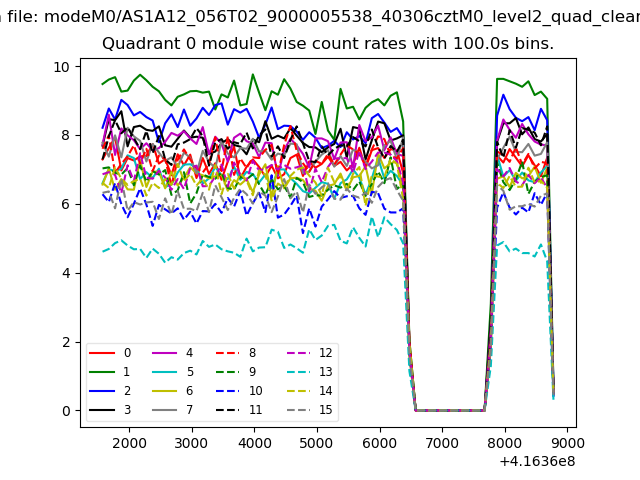 |
 |
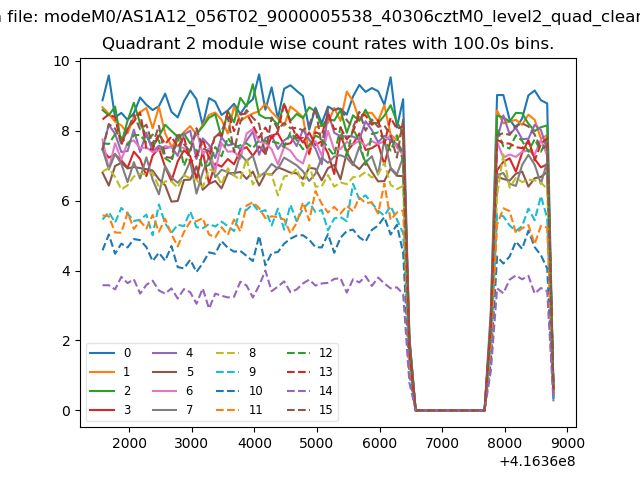
| Module-wise count rates for Quadrant B Data is divided into 100 sec bins |
 |
 |
| Module-wise count rates for Quadrant C Data is divided into 100 sec bins |
 |
 |
| Module-wise count rates for Quadrant D Data is divided into 100 sec bins |
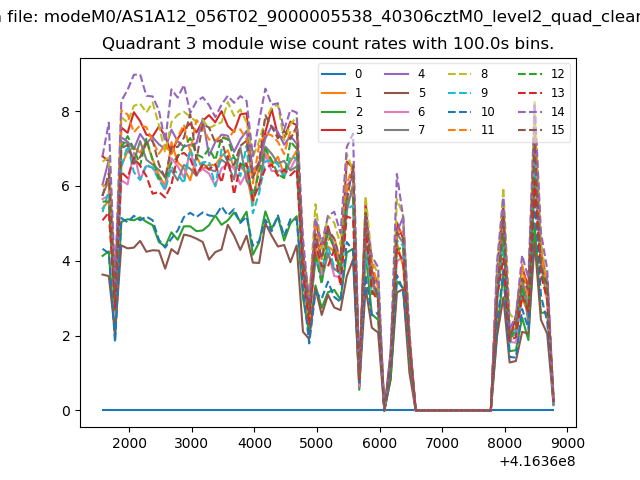 |
 |
| Parameter | Plot |
|---|---|
| CZT HV Monitor | 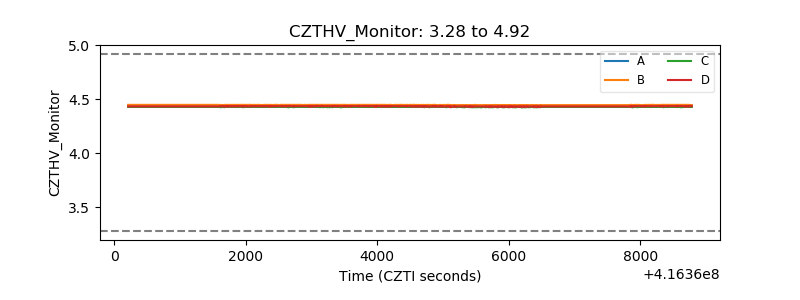 |
| D_VDD | 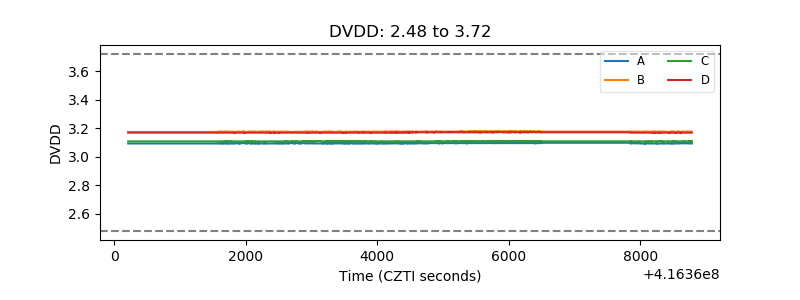 |
| Temperature 1 | 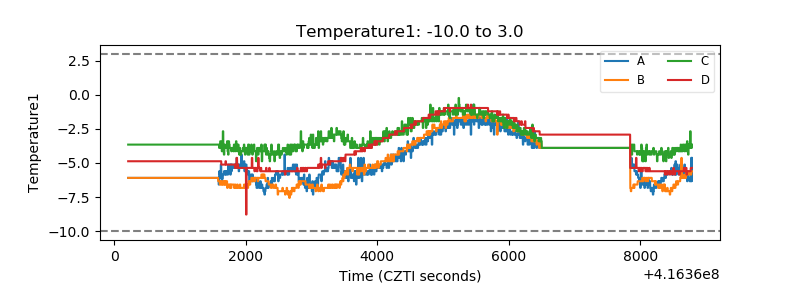 |
| Veto HV Monitor | 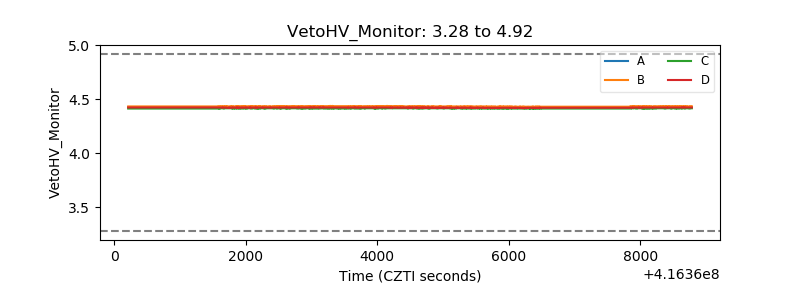 |
| Veto LLD | 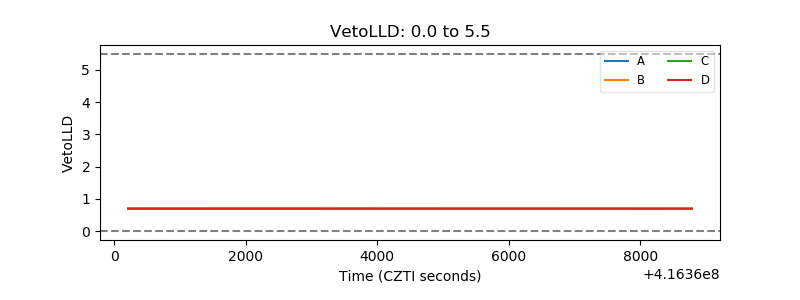 |
| Alpha Counter | 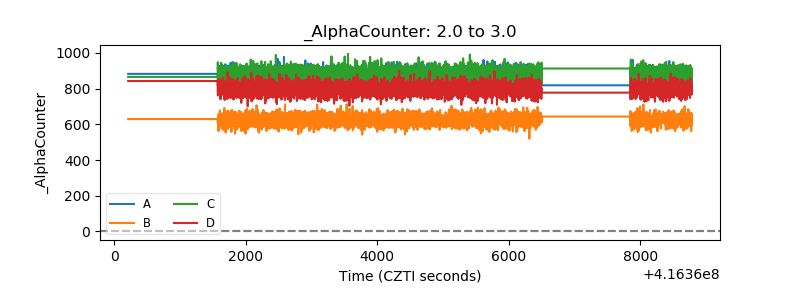 |
| _CPM_Rate | 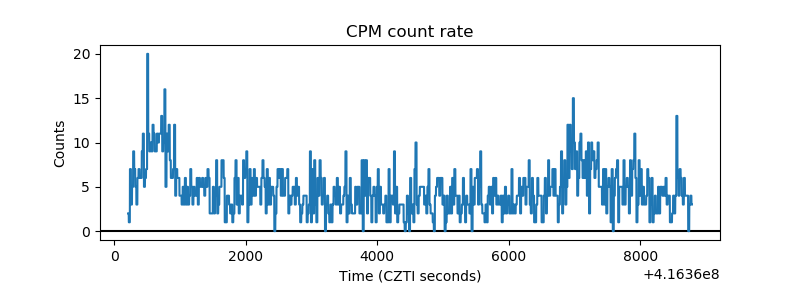 |
| CZT Counter | 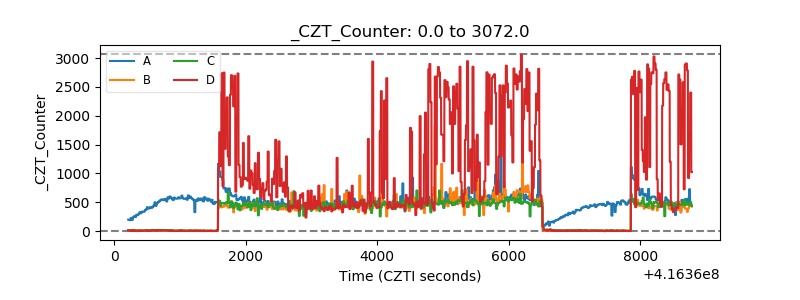 |
| +2.5 Volts monitor | 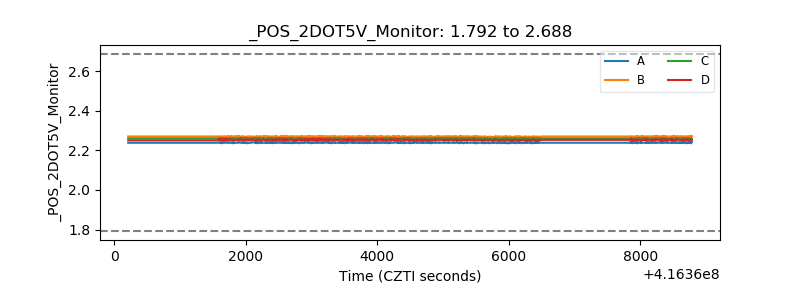 |
| +5 Volts monitor | 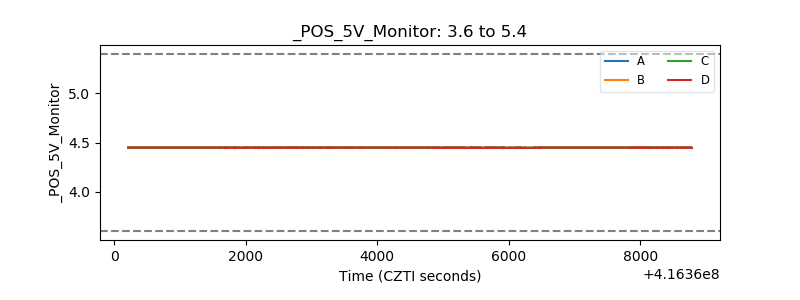 |
| _ROLL_ROT | 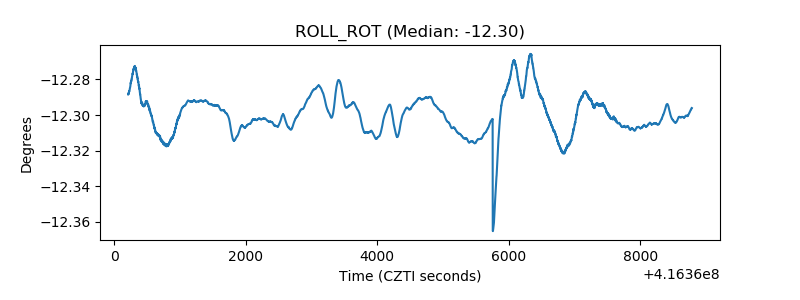 |
| _Roll_DEC | 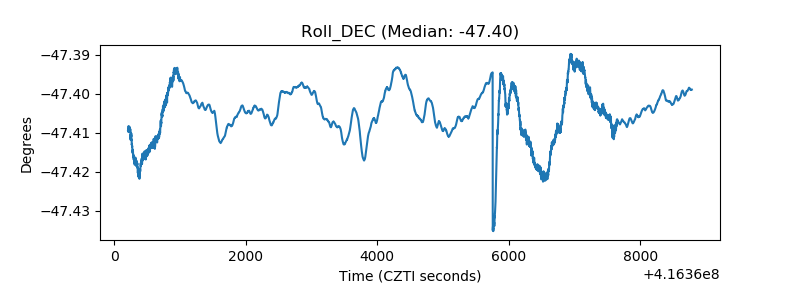 |
| _Roll_RA | 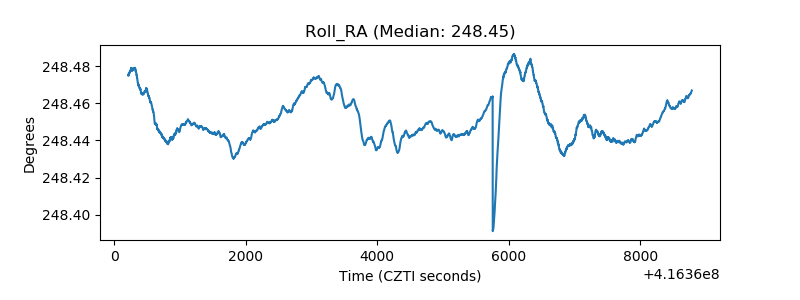 |
| Veto Counter | 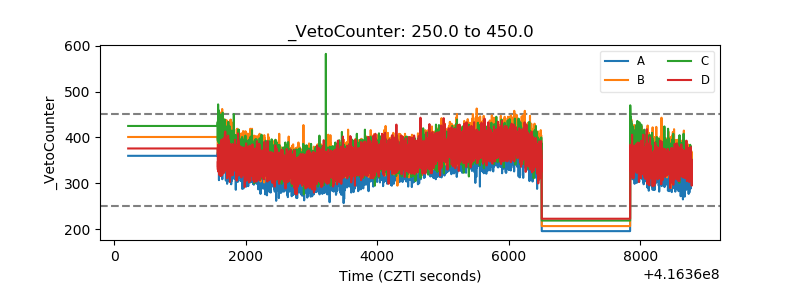 |