| Param | Original file | Final file |
|---|---|---|
| Filename | modeM0/AS1A12_056T02_9000005538_40311cztM0_level2.fits | modeM0/AS1A12_056T02_9000005538_40311cztM0_level2_quad_clean.evt |
| Size (bytes) | 1,627,833,600 | 332,873,280 |
| Size | 1.5 GB | 317.5 MB |
| Events in quadrant A | 13,447,623 | 2,313,550 |
| Events in quadrant B | 11,594,067 | 2,394,427 |
| Events in quadrant C | 10,920,476 | 2,304,349 |
| Events in quadrant D | 22,686,576 | 1,633,283 |
| Mode M0 | |||
|---|---|---|---|
| Quadrant | BADHDUFLAG | Total packets | Discarded packets |
| A | 0 | 52820 | 6 |
| B | 0 | 47898 | 5 |
| C | 0 | 44883 | 5 |
| D | 0 | 81510 | 5 |
| Mode M9 | |||
|---|---|---|---|
| Quadrant | BADHDUFLAG | Total packets | Discarded packets |
| A | 0 | 70 | 0 |
| B | 0 | 70 | 0 |
| C | 0 | 70 | 0 |
| D | 0 | 70 | 0 |
| Mode SS | |||
|---|---|---|---|
| Quadrant | BADHDUFLAG | Total packets | Discarded packets |
| A | 0 | 426 | 0 |
| B | 0 | 426 | 0 |
| C | 0 | 426 | 0 |
| D | 0 | 426 | 0 |
| Quadrant | Total seconds | Saturated seconds | Saturation percentage |
|---|---|---|---|
| A | 20805 | 515 | 2.475366% |
| B | 20805 | 299 | 1.437155% |
| C | 20805 | 233 | 1.119923% |
| D | 20805 | 4648 | 22.340783% |
Noise dominated data is calculated using 1-second bins in cleaned event files. If a bin has >2000 counts, and if more than 50% of those come from <1% of pixels, then it is considered to be noise-dominated and hence unusable.
| Quadrant | # 1 sec bins | Bins with >0 counts | Bins with >2000 counts | High rate bins dominated by noise | Noise dominated (total time) | Noise dominated (detector-on time) | Marked lightcurve |
|---|---|---|---|---|---|---|---|
| A | 27760 | 20811 | 415 | 415 | 1.49% | 1.99% | 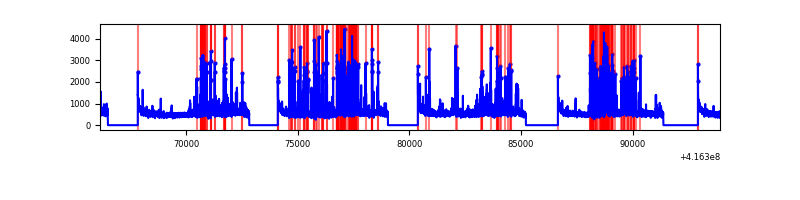 |
| B | 27760 | 20811 | 206 | 206 | 0.74% | 0.99% | 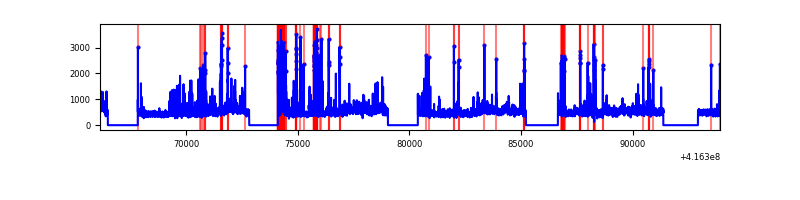 |
| C | 27760 | 20811 | 212 | 212 | 0.76% | 1.02% | 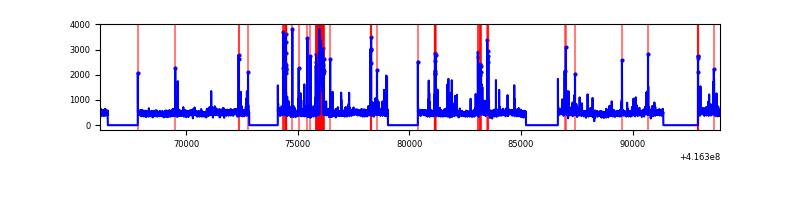 |
| D | 27760 | 20811 | 4472 | 4472 | 16.11% | 21.49% | 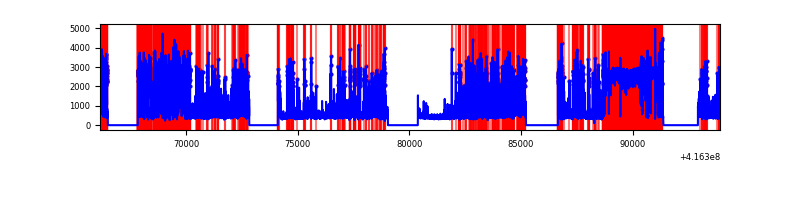 |
Top three noisy pixels from each quadrant. If the there are fewer than three noisy pixels in the level2.evt file, extra rows are filled as -1
| Pixel properties | Quadrant properties | ||||||
|---|---|---|---|---|---|---|---|
| Quadrant | DetID | PixID | Counts | Sigma | Mean | Median | Sigma |
| A | 10 | 83 | 1655027 | 3480.56 | 2336 | 2289 | 474.8 |
| A | 13 | 248 | 1437241 | 3021.92 | 2336 | 2289 | 474.8 |
| A | 6 | 10 | 687625 | 1443.27 | 2336 | 2289 | 474.8 |
| B | 5 | 255 | 899857 | 2009.73 | 2331 | 2270 | 446.6 |
| B | 7 | 202 | 682816 | 1523.77 | 2331 | 2270 | 446.6 |
| B | 4 | 170 | 186356 | 412.17 | 2331 | 2270 | 446.6 |
| C | 14 | 254 | 977809 | 1840.61 | 2291 | 2305 | 530.0 |
| C | 15 | 214 | 876993 | 1650.39 | 2291 | 2305 | 530.0 |
| C | 9 | 187 | 50965 | 91.81 | 2291 | 2305 | 530.0 |
| D | 12 | 227 | 12366920 | 25447.62 | 1978 | 1923 | 485.9 |
| D | 2 | 250 | 991955 | 2037.52 | 1978 | 1923 | 485.9 |
| D | 1 | 47 | 589957 | 1210.2 | 1978 | 1923 | 485.9 |
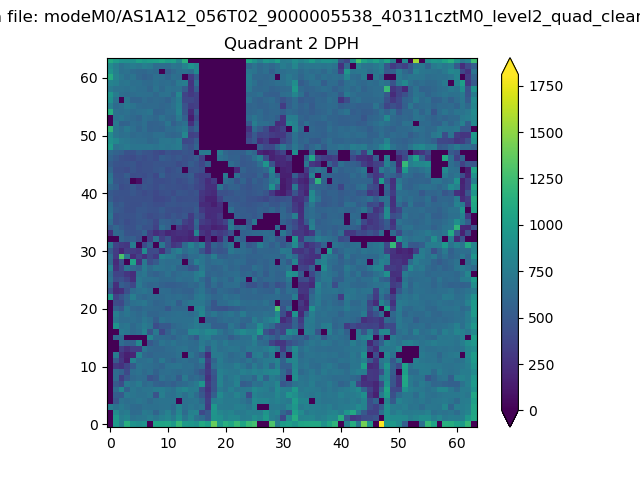
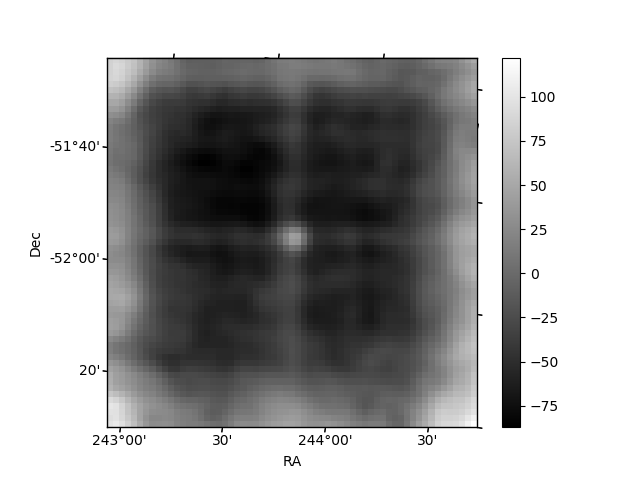
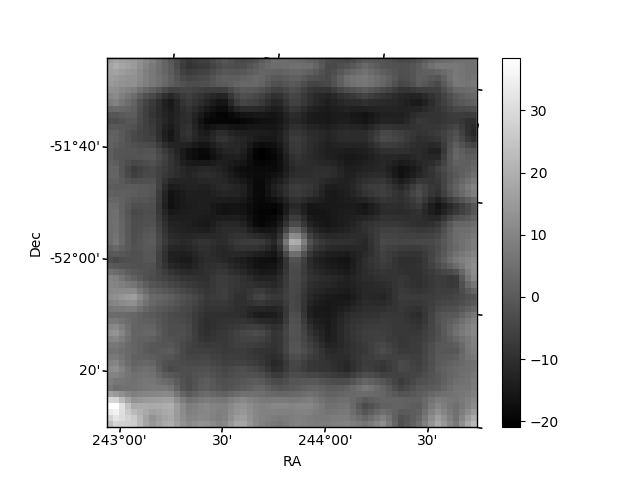
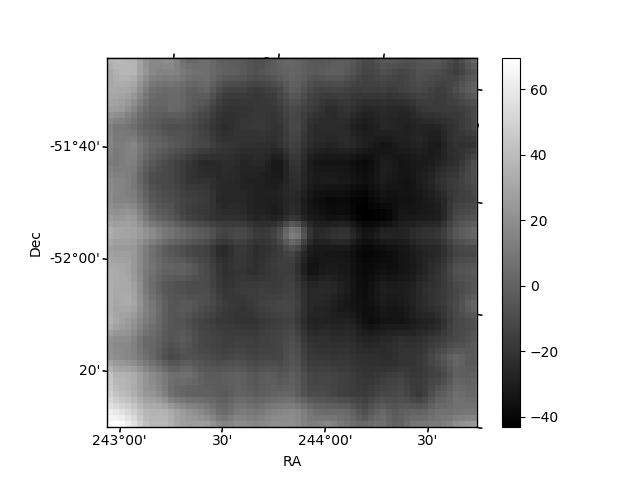
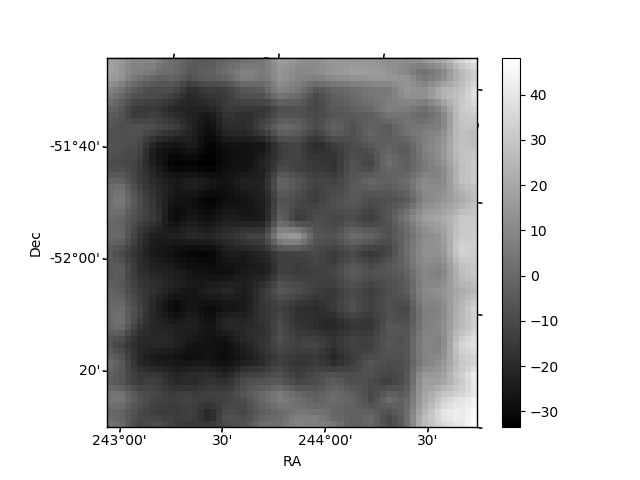
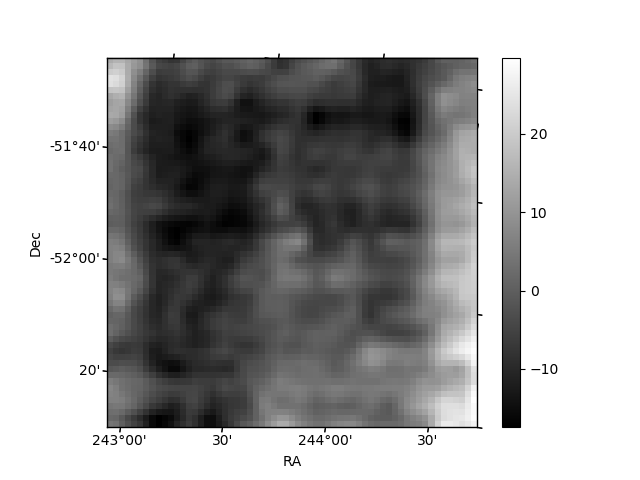
Histogram calculated using DETX and DETY for each event in the final _common_clean file
| Quadrant A | 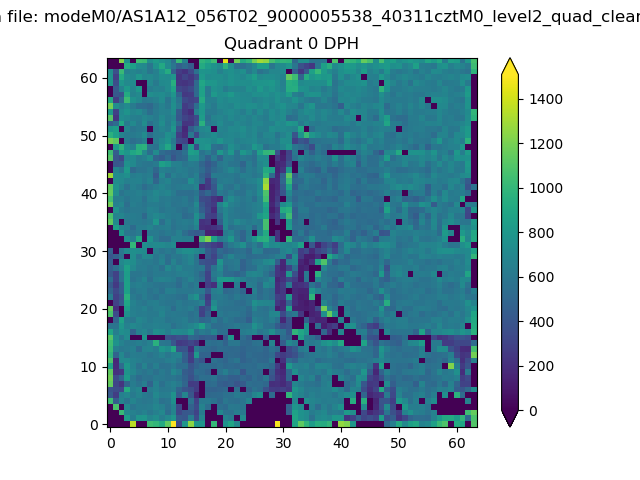 |
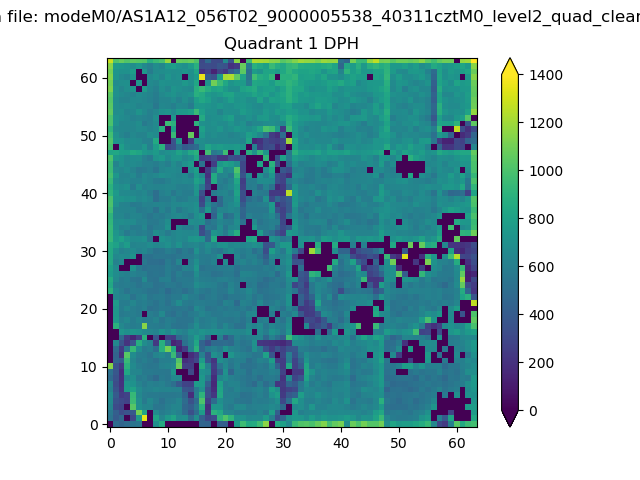 |
Quadrant B |
|---|---|---|---|
| Quadrant D | 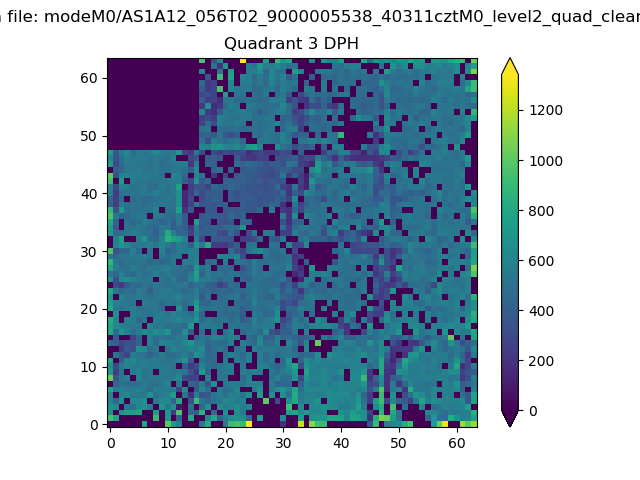 |
 |
Quadrant C |
| Plot type | Count rate plots | Images |
|---|---|---|
| Comparison with Poisson distribution Blue bars denote a histogram of data divided into 1 sec bins. Red curve is a Poisson curve with rate = median count rate of data. |
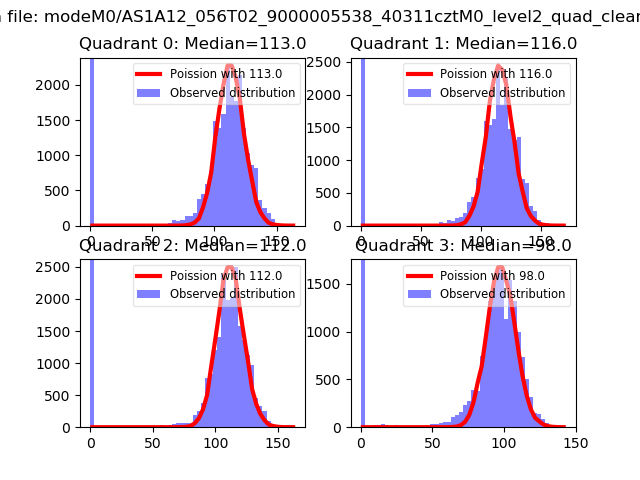 |
 |
| Quadrant-wise count rates Data is divided into 100 sec bins |
 |
|
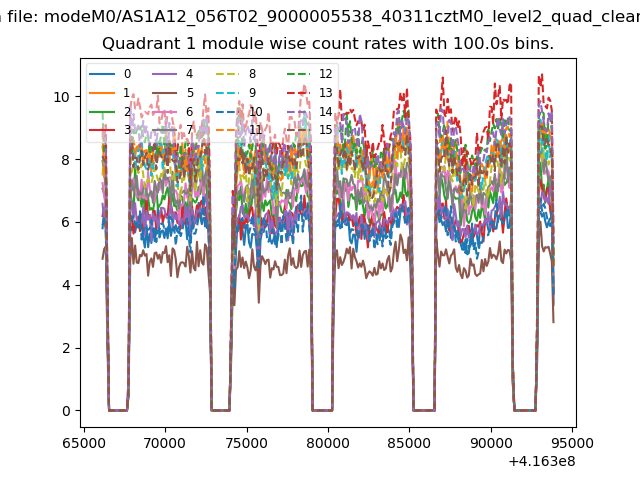
| Module-wise count rates for Quadrant A Data is divided into 100 sec bins |
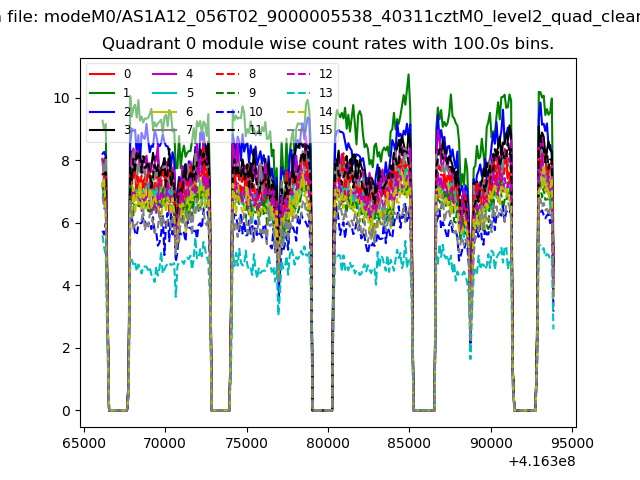 |
 |
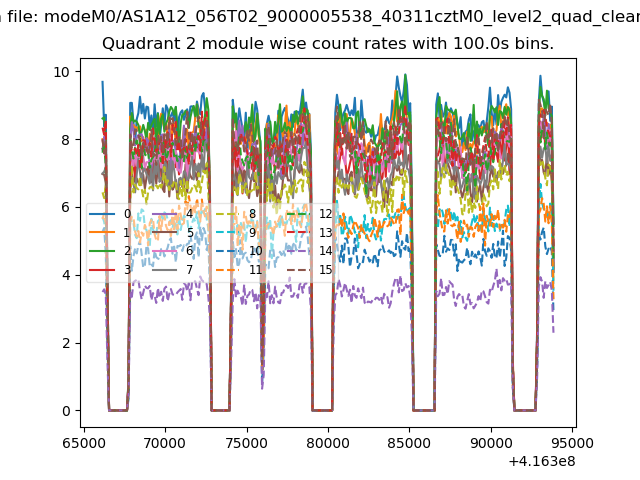
| Module-wise count rates for Quadrant B Data is divided into 100 sec bins |
 |
 |
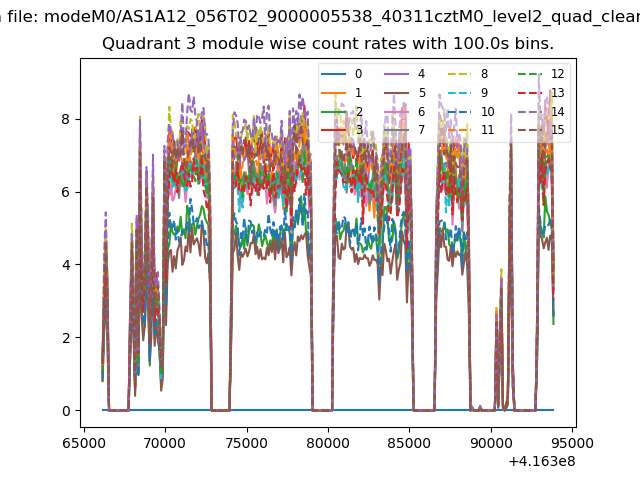
| Module-wise count rates for Quadrant C Data is divided into 100 sec bins |
 |
 |
| Module-wise count rates for Quadrant D Data is divided into 100 sec bins |
 |
 |
| Parameter | Plot |
|---|---|
| CZT HV Monitor | 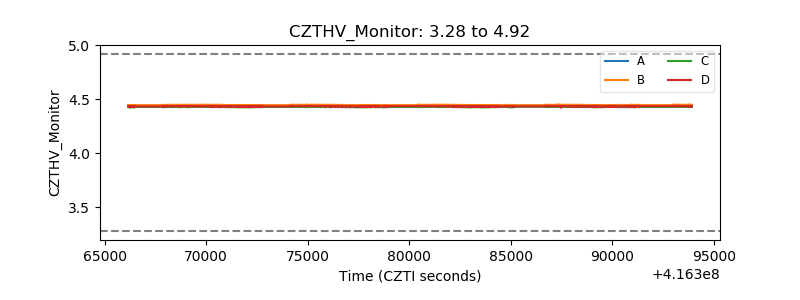 |
| D_VDD | 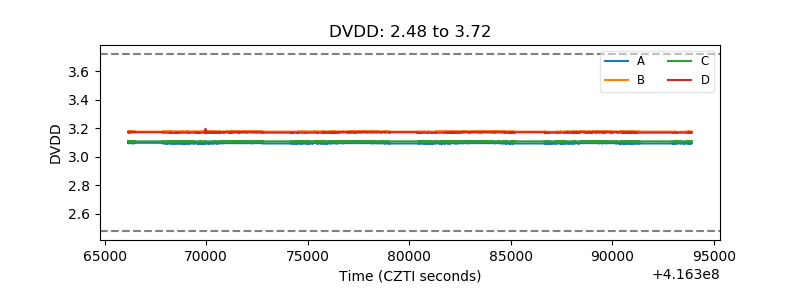 |
| Temperature 1 | 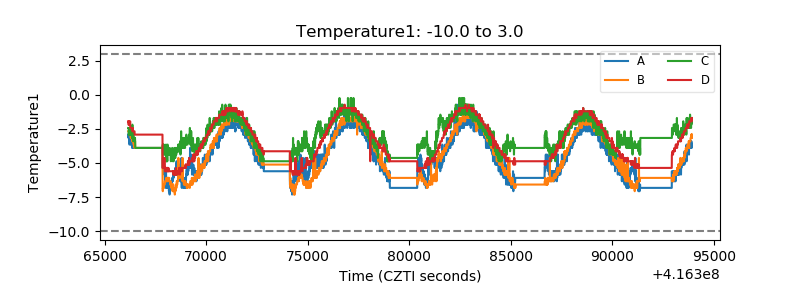 |
| Veto HV Monitor | 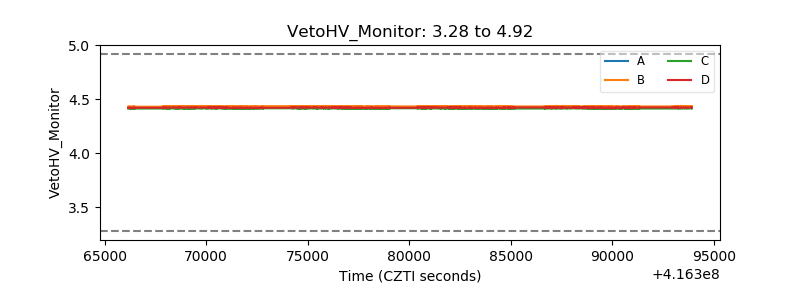 |
| Veto LLD | 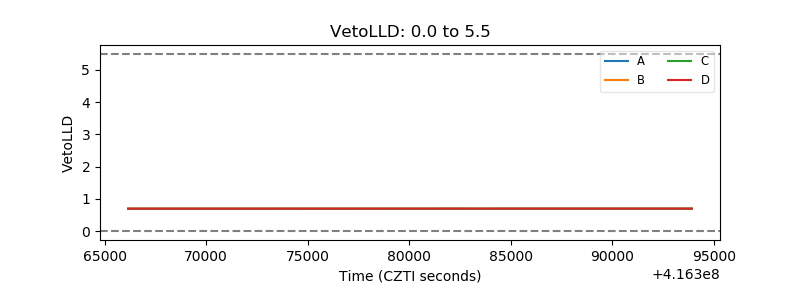 |
| Alpha Counter |  |
| _CPM_Rate | 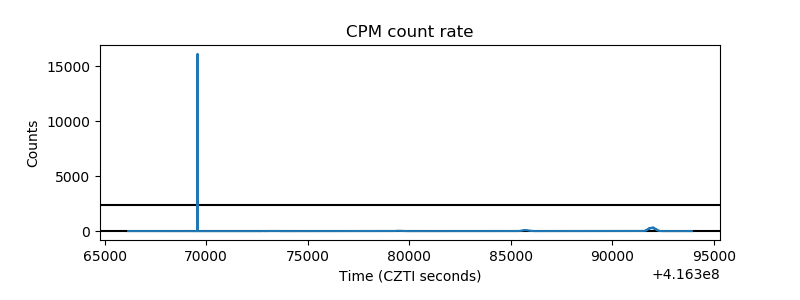 |
| CZT Counter | 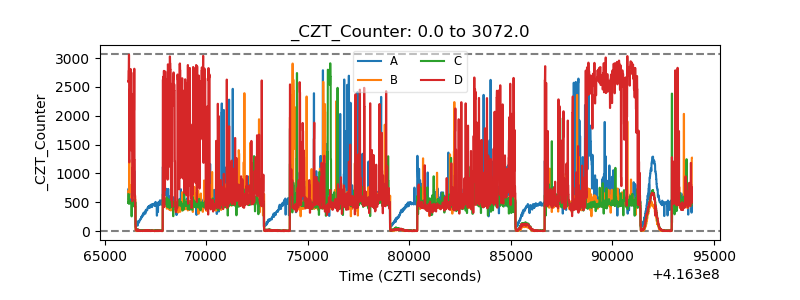 |
| +2.5 Volts monitor | 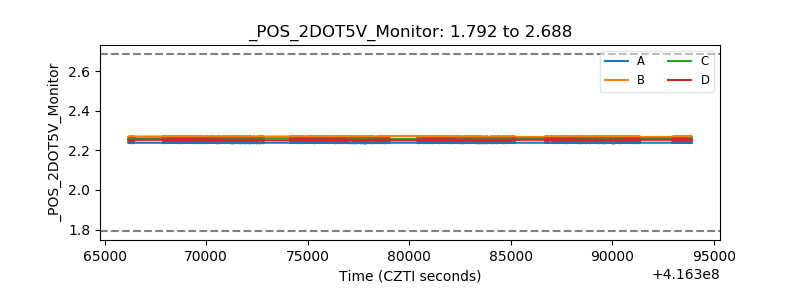 |
| +5 Volts monitor | 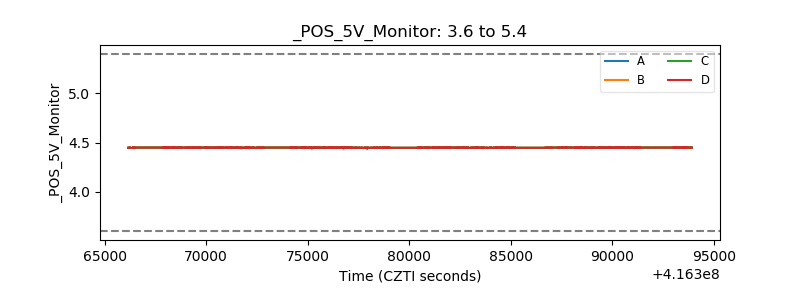 |
| _ROLL_ROT | 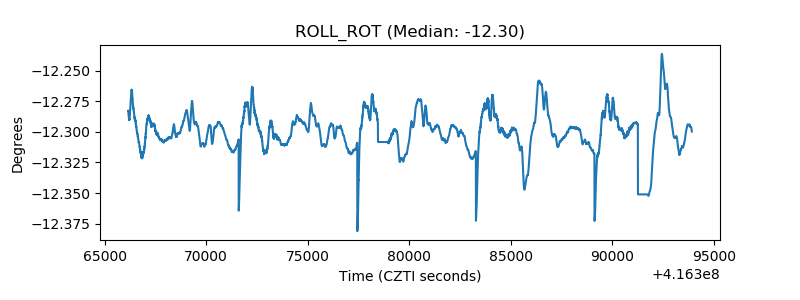 |
| _Roll_DEC | 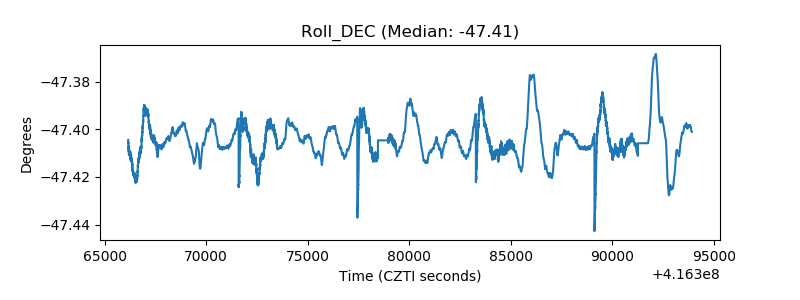 |
| _Roll_RA | 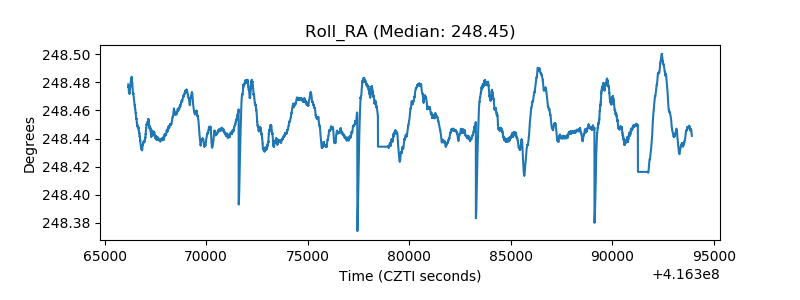 |
| Veto Counter | 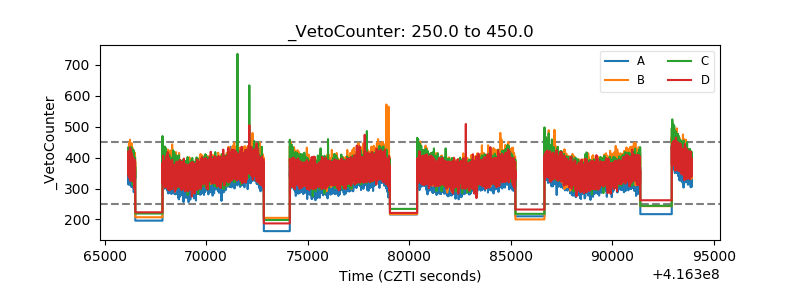 |