| Param | Original file | Final file |
|---|---|---|
| Filename | modeM0/AS1A12_056T02_9000005538_40313cztM0_level2.fits | modeM0/AS1A12_056T02_9000005538_40313cztM0_level2_quad_clean.evt |
| Size (bytes) | 693,264,960 | 165,951,360 |
| Size | 661.1 MB | 158.3 MB |
| Events in quadrant A | 5,804,503 | 1,129,584 |
| Events in quadrant B | 4,672,604 | 1,159,466 |
| Events in quadrant C | 5,341,498 | 1,106,490 |
| Events in quadrant D | 9,095,928 | 959,832 |
| Mode M0 | |||
|---|---|---|---|
| Quadrant | BADHDUFLAG | Total packets | Discarded packets |
| A | 0 | 22942 | 3 |
| B | 0 | 20027 | 2 |
| C | 0 | 21749 | 2 |
| D | 0 | 33658 | 2 |
| Mode M9 | |||
|---|---|---|---|
| Quadrant | BADHDUFLAG | Total packets | Discarded packets |
| A | 0 | 35 | 0 |
| B | 0 | 35 | 0 |
| C | 0 | 35 | 0 |
| D | 0 | 35 | 0 |
| Mode SS | |||
|---|---|---|---|
| Quadrant | BADHDUFLAG | Total packets | Discarded packets |
| A | 0 | 198 | 0 |
| B | 0 | 198 | 0 |
| C | 0 | 198 | 0 |
| D | 0 | 198 | 0 |
| Quadrant | Total seconds | Saturated seconds | Saturation percentage |
|---|---|---|---|
| A | 9653 | 126 | 1.305294% |
| B | 9653 | 44 | 0.455817% |
| C | 9653 | 122 | 1.263856% |
| D | 9653 | 835 | 8.650161% |
Noise dominated data is calculated using 1-second bins in cleaned event files. If a bin has >2000 counts, and if more than 50% of those come from <1% of pixels, then it is considered to be noise-dominated and hence unusable.
| Quadrant | # 1 sec bins | Bins with >0 counts | Bins with >2000 counts | High rate bins dominated by noise | Noise dominated (total time) | Noise dominated (detector-on time) | Marked lightcurve |
|---|---|---|---|---|---|---|---|
| A | 13179 | 9655 | 103 | 103 | 0.78% | 1.07% | 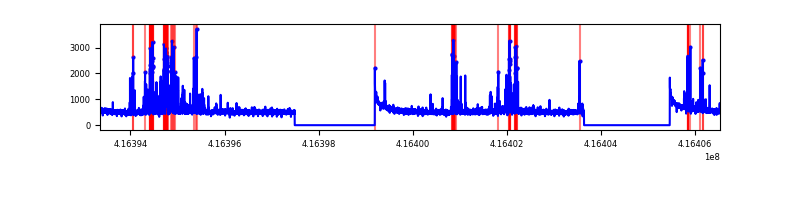 |
| B | 13179 | 9655 | 19 | 19 | 0.14% | 0.20% | 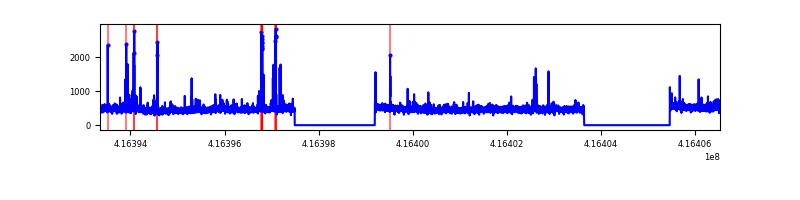 |
| C | 13179 | 9655 | 97 | 97 | 0.74% | 1.00% | 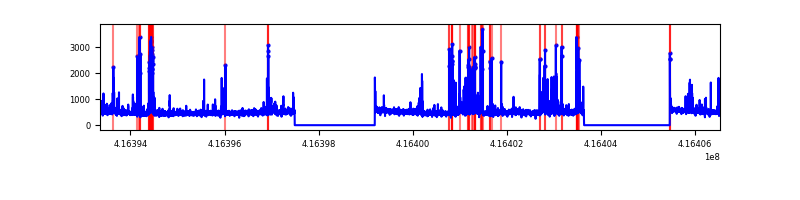 |
| D | 13179 | 9655 | 849 | 849 | 6.44% | 8.79% | 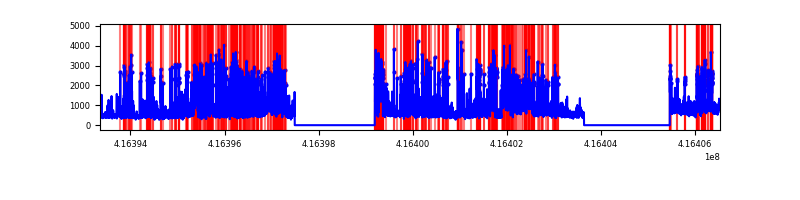 |
Top three noisy pixels from each quadrant. If the there are fewer than three noisy pixels in the level2.evt file, extra rows are filled as -1
| Pixel properties | Quadrant properties | ||||||
|---|---|---|---|---|---|---|---|
| Quadrant | DetID | PixID | Counts | Sigma | Mean | Median | Sigma |
| A | 10 | 83 | 733943 | 3295.83 | 1105 | 1086 | 222.4 |
| A | 13 | 248 | 648798 | 2912.91 | 1105 | 1086 | 222.4 |
| A | 12 | 189 | 72636 | 321.78 | 1105 | 1086 | 222.4 |
| B | 5 | 255 | 105631 | 500.83 | 1098 | 1071 | 208.8 |
| B | 4 | 170 | 71239 | 336.1 | 1098 | 1071 | 208.8 |
| B | 0 | 245 | 70134 | 330.81 | 1098 | 1071 | 208.8 |
| C | 14 | 254 | 707029 | 2832.82 | 1071 | 1080 | 249.2 |
| C | 15 | 214 | 402619 | 1611.29 | 1071 | 1080 | 249.2 |
| C | 0 | 10 | 24062 | 92.22 | 1071 | 1080 | 249.2 |
| D | 12 | 227 | 2727684 | 10663.08 | 1040 | 1010 | 255.7 |
| D | 12 | 79 | 943354 | 3685.18 | 1040 | 1010 | 255.7 |
| D | 1 | 47 | 630638 | 2462.26 | 1040 | 1010 | 255.7 |
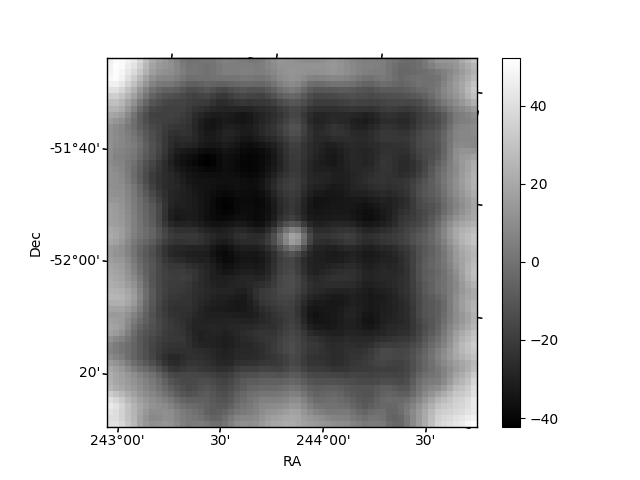
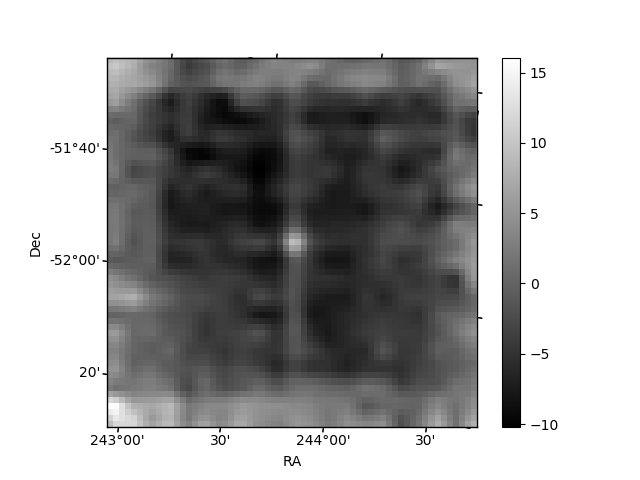
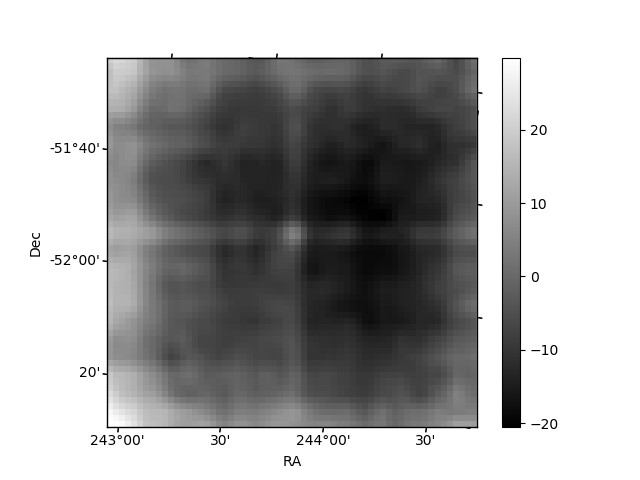
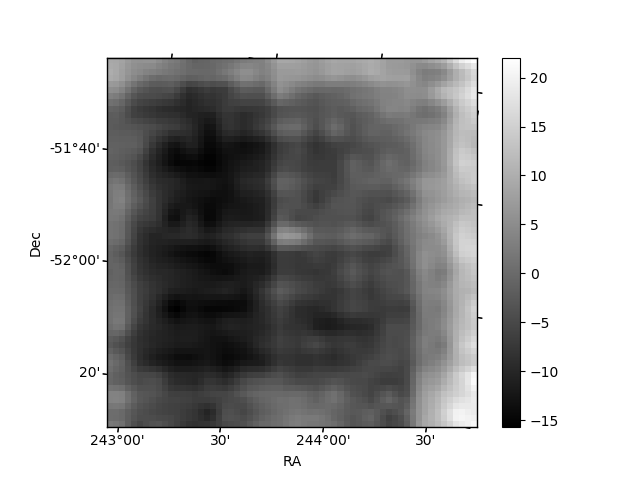
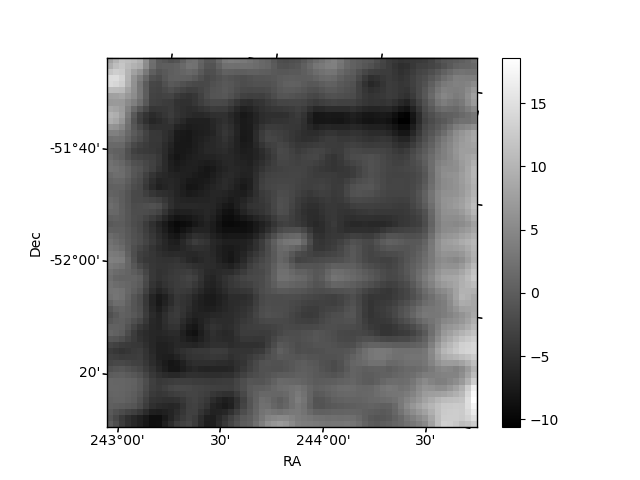
Histogram calculated using DETX and DETY for each event in the final _common_clean file
| Quadrant A | 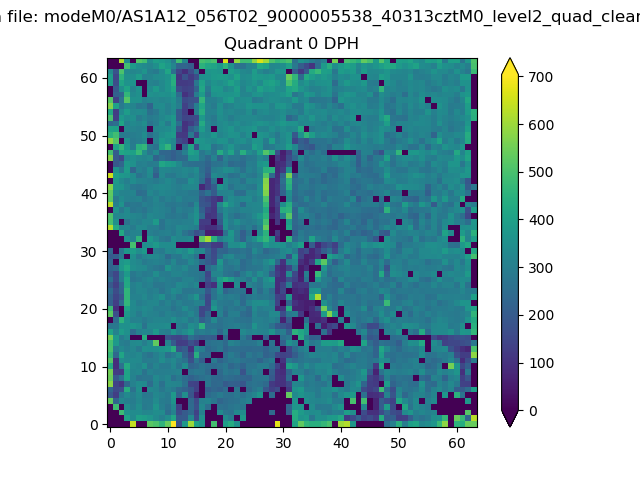 |
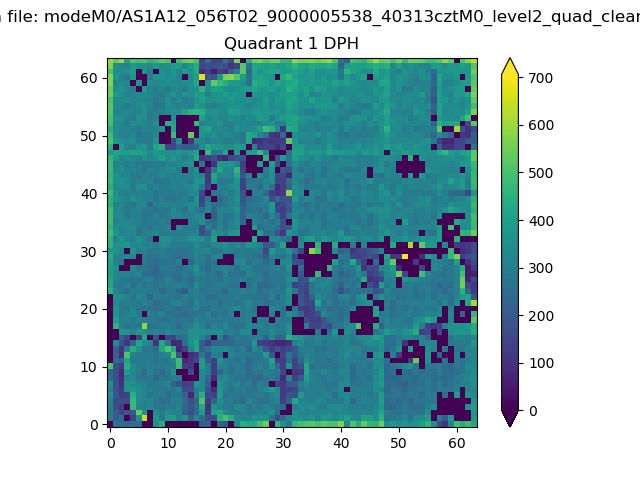 |
Quadrant B |
|---|---|---|---|
| Quadrant D | 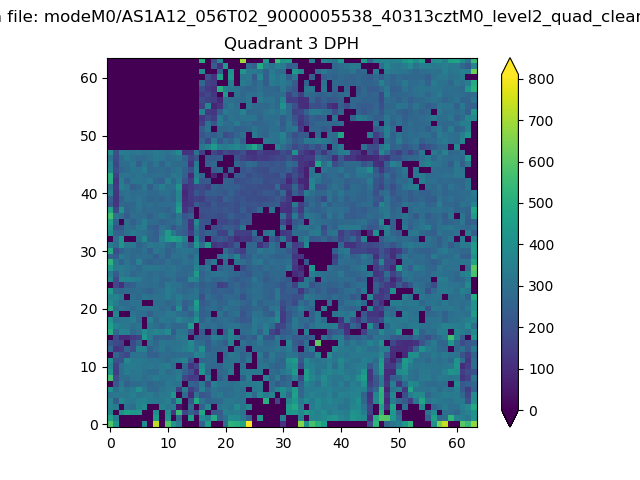 |
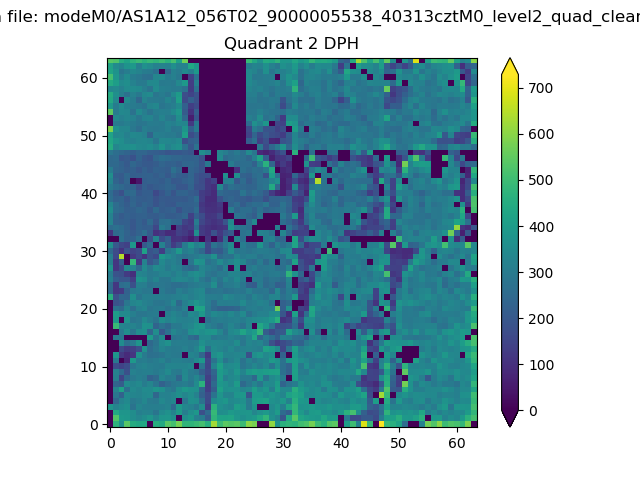 |
Quadrant C |
| Plot type | Count rate plots | Images |
|---|---|---|
| Comparison with Poisson distribution Blue bars denote a histogram of data divided into 1 sec bins. Red curve is a Poisson curve with rate = median count rate of data. |
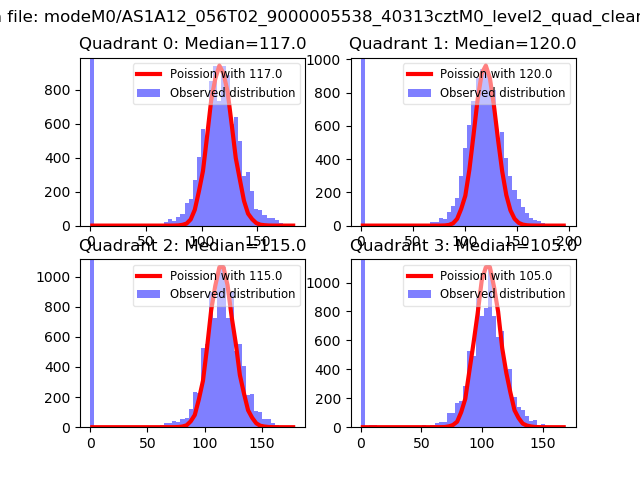 |
 |
| Quadrant-wise count rates Data is divided into 100 sec bins |
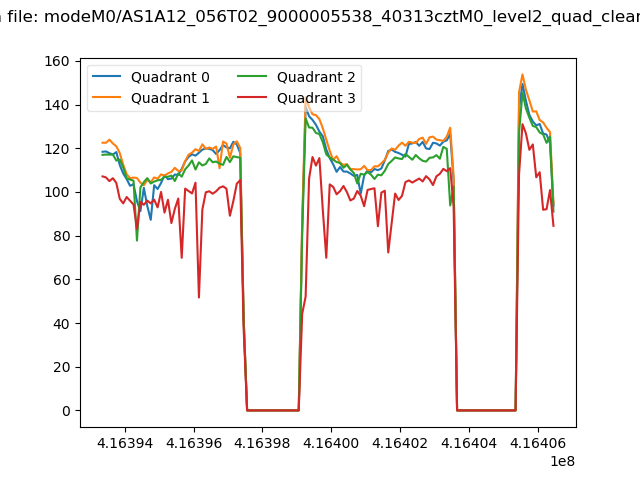 |
|
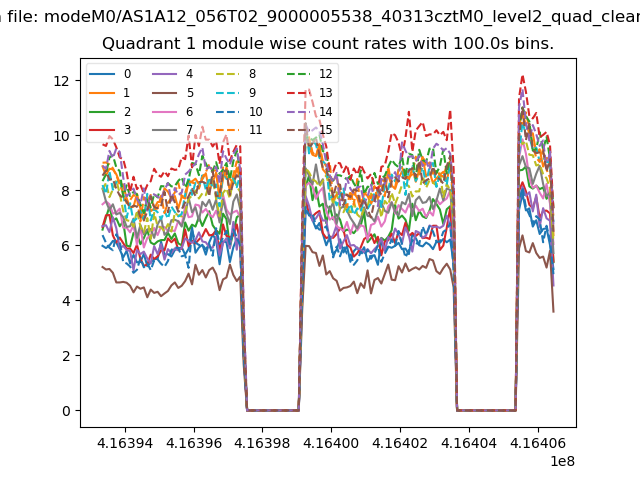
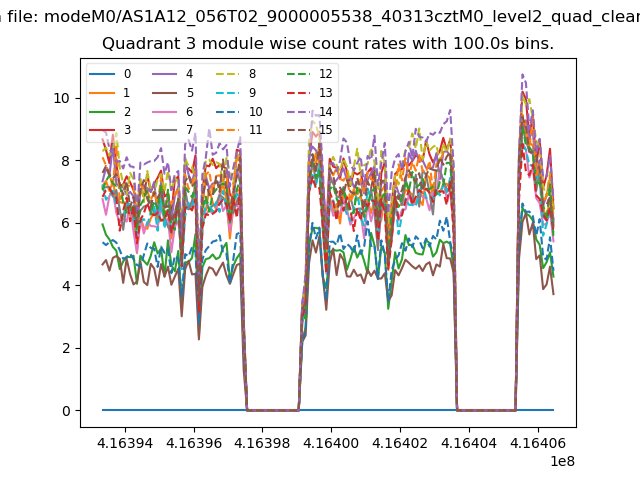
| Module-wise count rates for Quadrant A Data is divided into 100 sec bins |
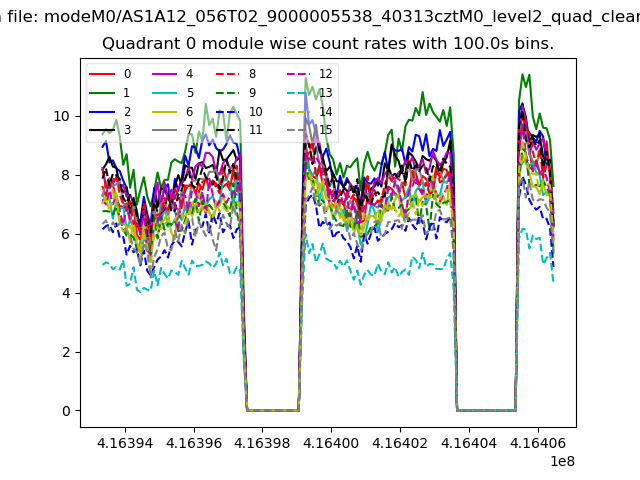 |
 |
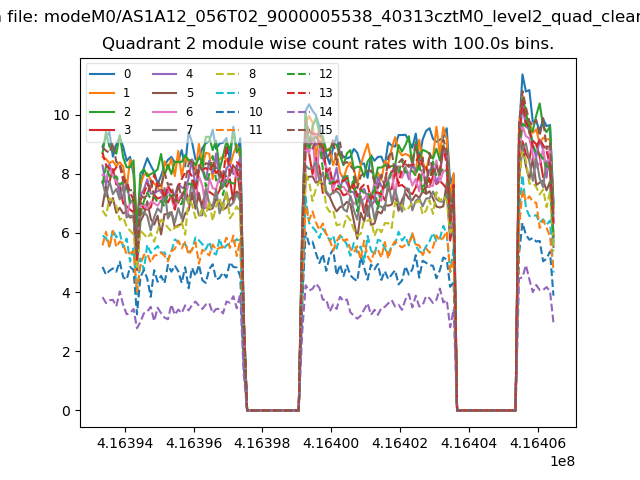
| Module-wise count rates for Quadrant B Data is divided into 100 sec bins |
 |
 |
| Module-wise count rates for Quadrant C Data is divided into 100 sec bins |
 |
 |
| Module-wise count rates for Quadrant D Data is divided into 100 sec bins |
 |
 |
| Parameter | Plot |
|---|---|
| CZT HV Monitor | 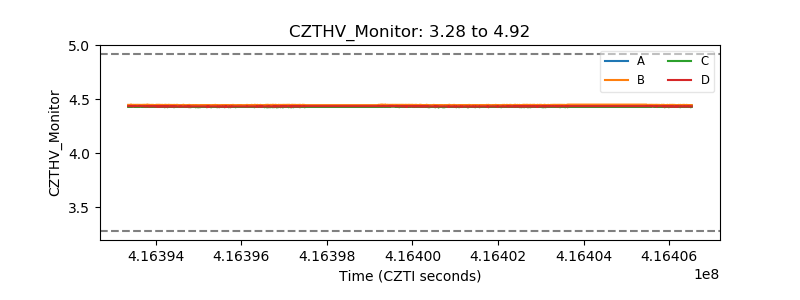 |
| D_VDD | 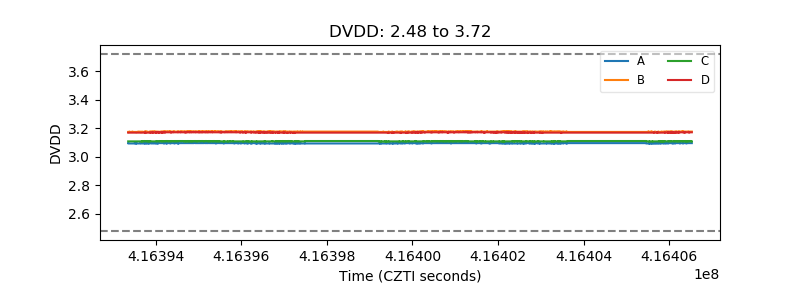 |
| Temperature 1 | 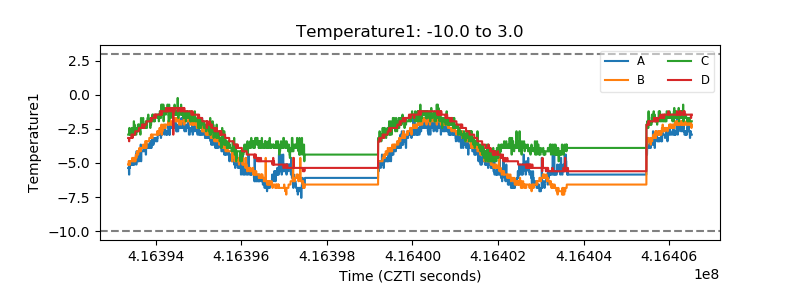 |
| Veto HV Monitor | 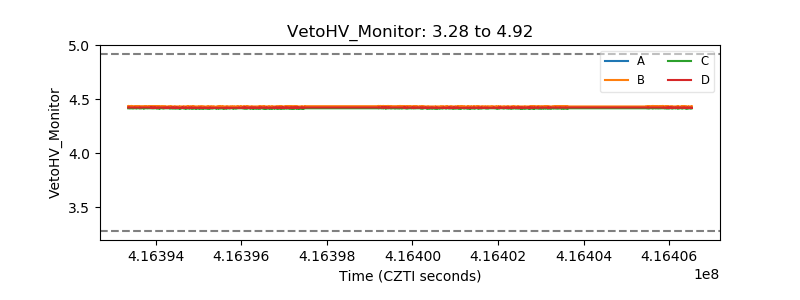 |
| Veto LLD | 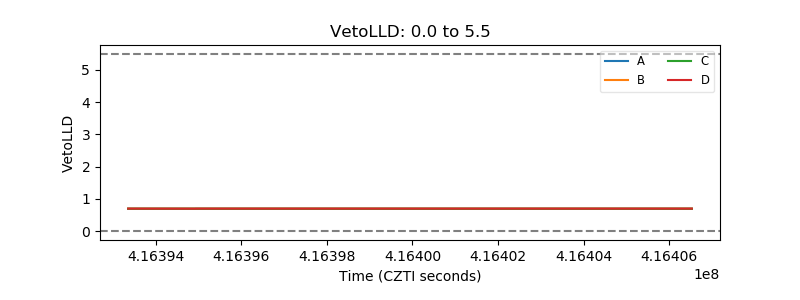 |
| Alpha Counter | 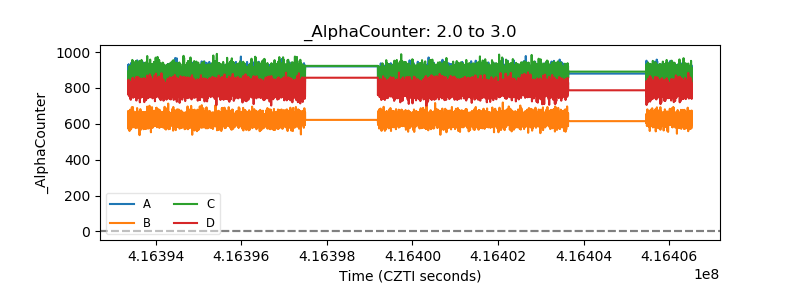 |
| _CPM_Rate | 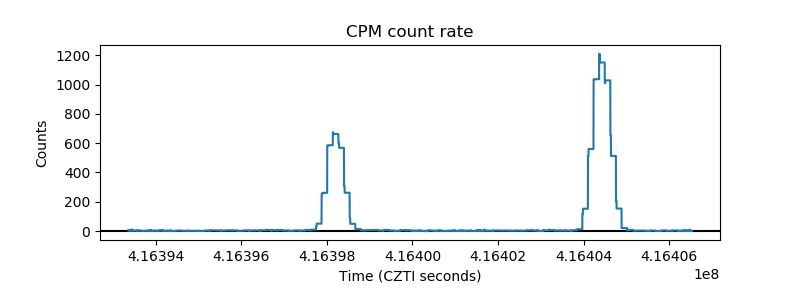 |
| CZT Counter | 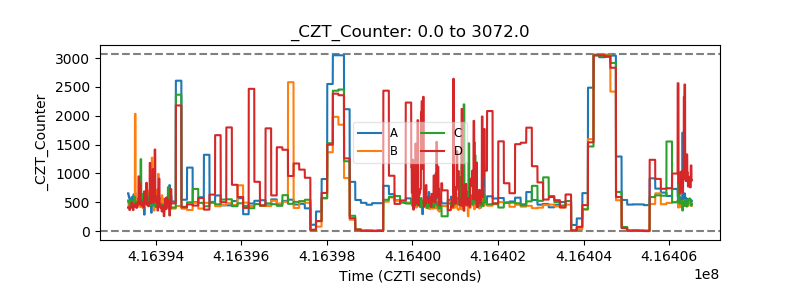 |
| +2.5 Volts monitor | 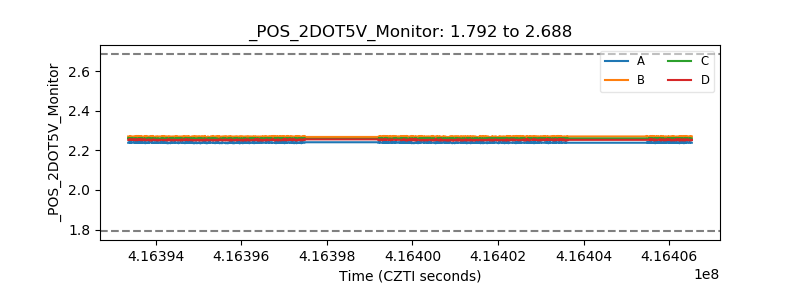 |
| +5 Volts monitor | 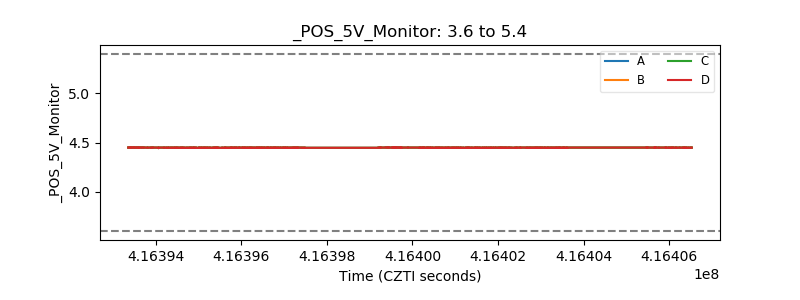 |
| _ROLL_ROT | 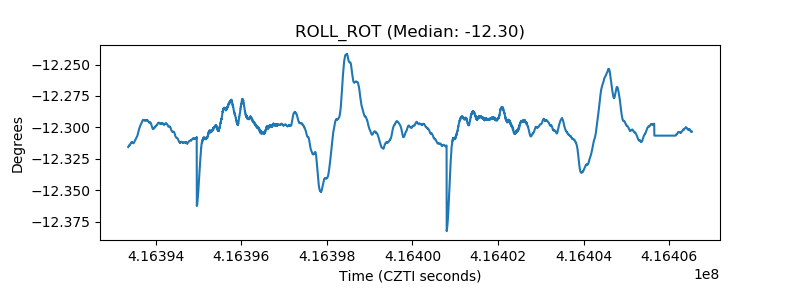 |
| _Roll_DEC | 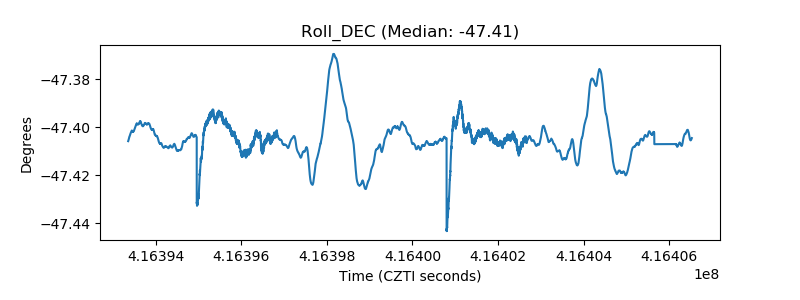 |
| _Roll_RA | 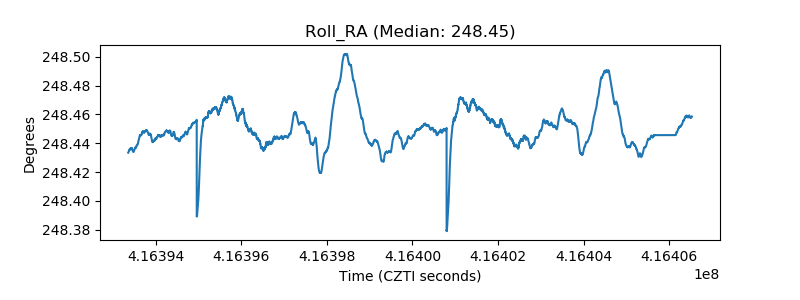 |
| Veto Counter | 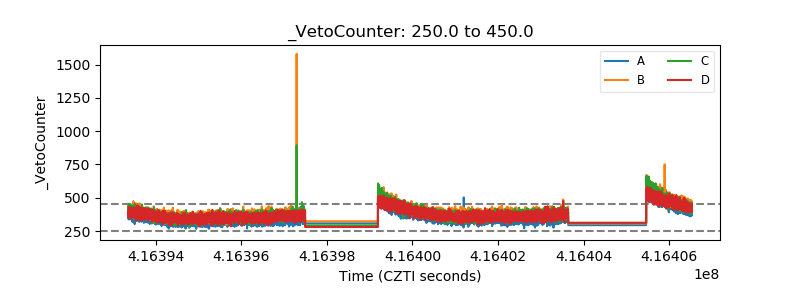 |