| Param | Original file | Final file |
|---|---|---|
| Filename | modeM0/AS1A12_056T02_9000005538_40315cztM0_level2.fits | modeM0/AS1A12_056T02_9000005538_40315cztM0_level2_quad_clean.evt |
| Size (bytes) | 400,112,640 | 98,095,680 |
| Size | 381.6 MB | 93.6 MB |
| Events in quadrant A | 3,644,003 | 684,288 |
| Events in quadrant B | 2,850,812 | 707,458 |
| Events in quadrant C | 4,367,415 | 614,679 |
| Events in quadrant D | 3,551,419 | 605,523 |
| Mode M0 | |||
|---|---|---|---|
| Quadrant | BADHDUFLAG | Total packets | Discarded packets |
| A | 0 | 14214 | 3 |
| B | 0 | 11562 | 2 |
| C | 0 | 16071 | 2 |
| D | 0 | 14017 | 2 |
| Mode M9 | |||
|---|---|---|---|
| Quadrant | BADHDUFLAG | Total packets | Discarded packets |
| A | 0 | 22 | 0 |
| B | 0 | 22 | 0 |
| C | 0 | 22 | 0 |
| D | 0 | 23 | 0 |
| Mode SS | |||
|---|---|---|---|
| Quadrant | BADHDUFLAG | Total packets | Discarded packets |
| A | 0 | 106 | 0 |
| B | 0 | 106 | 0 |
| C | 0 | 106 | 0 |
| D | 0 | 106 | 0 |
| Quadrant | Total seconds | Saturated seconds | Saturation percentage |
|---|---|---|---|
| A | 5112 | 104 | 2.034429% |
| B | 5112 | 13 | 0.254304% |
| C | 5112 | 482 | 9.428795% |
| D | 5112 | 135 | 2.640845% |
Noise dominated data is calculated using 1-second bins in cleaned event files. If a bin has >2000 counts, and if more than 50% of those come from <1% of pixels, then it is considered to be noise-dominated and hence unusable.
| Quadrant | # 1 sec bins | Bins with >0 counts | Bins with >2000 counts | High rate bins dominated by noise | Noise dominated (total time) | Noise dominated (detector-on time) | Marked lightcurve |
|---|---|---|---|---|---|---|---|
| A | 7145 | 5113 | 67 | 67 | 0.94% | 1.31% | 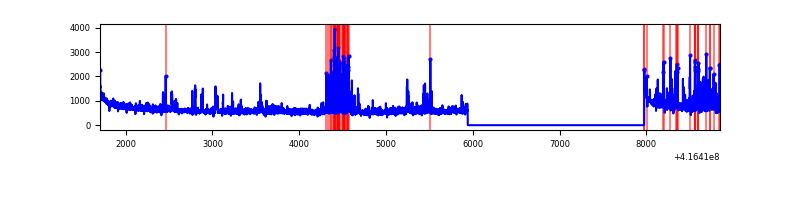 |
| B | 7145 | 5113 | 4 | 4 | 0.06% | 0.08% | 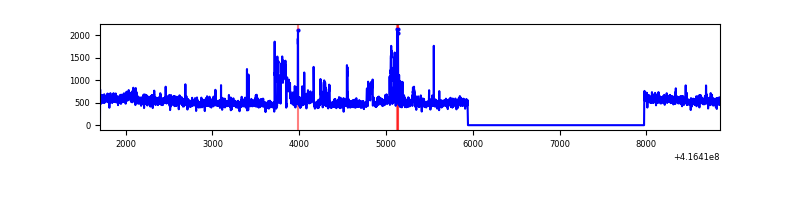 |
| C | 7145 | 5113 | 458 | 458 | 6.41% | 8.96% | 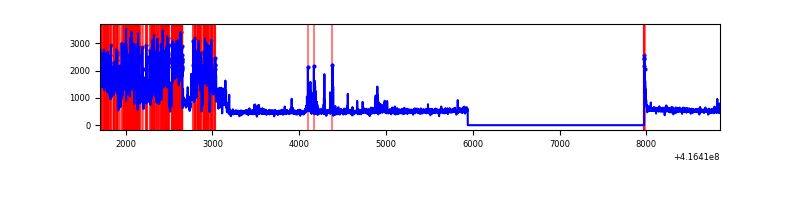 |
| D | 7145 | 5113 | 124 | 124 | 1.74% | 2.43% | 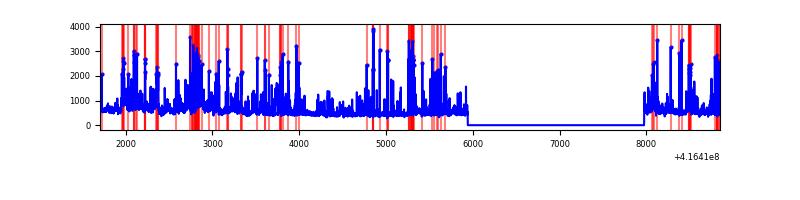 |
Top three noisy pixels from each quadrant. If the there are fewer than three noisy pixels in the level2.evt file, extra rows are filled as -1
| Pixel properties | Quadrant properties | ||||||
|---|---|---|---|---|---|---|---|
| Quadrant | DetID | PixID | Counts | Sigma | Mean | Median | Sigma |
| A | 10 | 83 | 469997 | 3704.47 | 630 | 621 | 126.7 |
| A | 13 | 248 | 395681 | 3117.94 | 630 | 621 | 126.7 |
| A | 6 | 10 | 278097 | 2189.93 | 630 | 621 | 126.7 |
| B | 0 | 229 | 252661 | 2128.88 | 630 | 615 | 118.4 |
| B | 0 | 230 | 59190 | 494.75 | 630 | 615 | 118.4 |
| B | 0 | 218 | 24910 | 205.21 | 630 | 615 | 118.4 |
| C | 9 | 187 | 1455569 | 10645.66 | 593 | 599 | 136.7 |
| C | 14 | 254 | 349246 | 2550.97 | 593 | 599 | 136.7 |
| C | 15 | 214 | 213412 | 1557.1 | 593 | 599 | 136.7 |
| D | 12 | 227 | 550021 | 3701.85 | 605 | 589 | 148.4 |
| D | 12 | 79 | 187919 | 1262.15 | 605 | 589 | 148.4 |
| D | 12 | 233 | 176583 | 1185.78 | 605 | 589 | 148.4 |
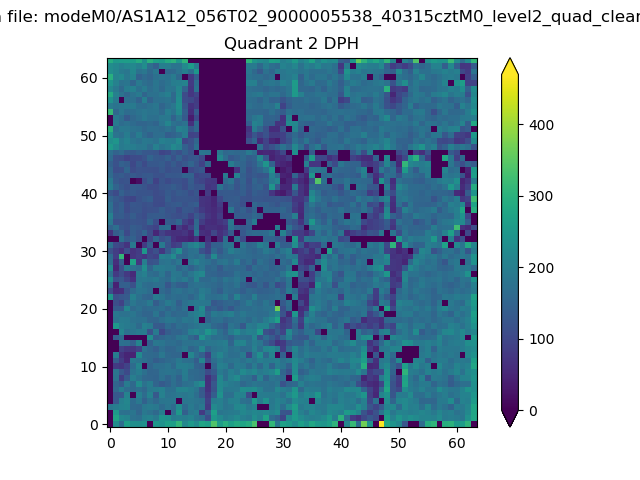
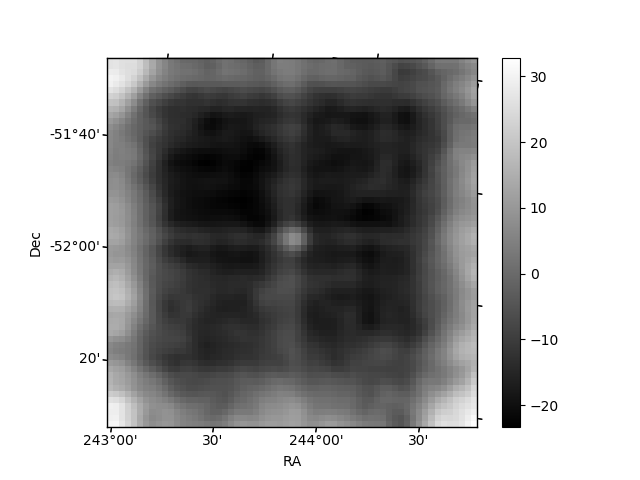
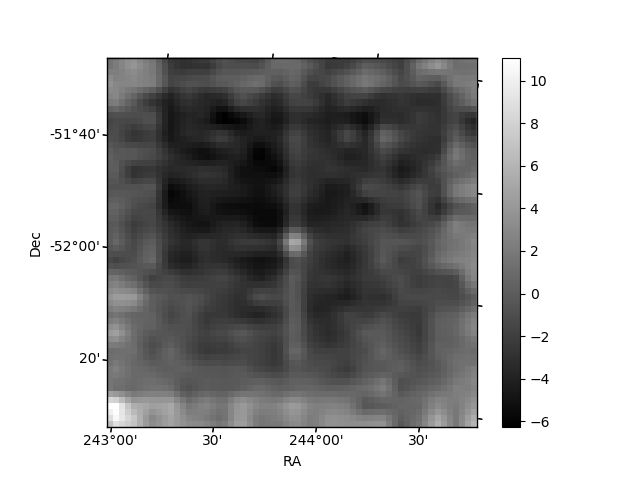
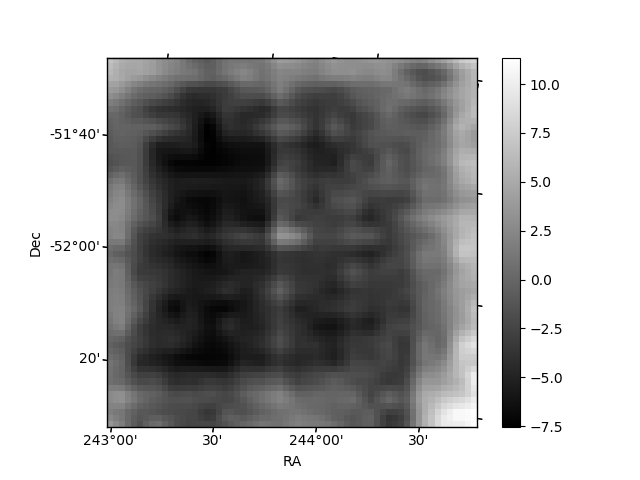
Histogram calculated using DETX and DETY for each event in the final _common_clean file
| Quadrant A | 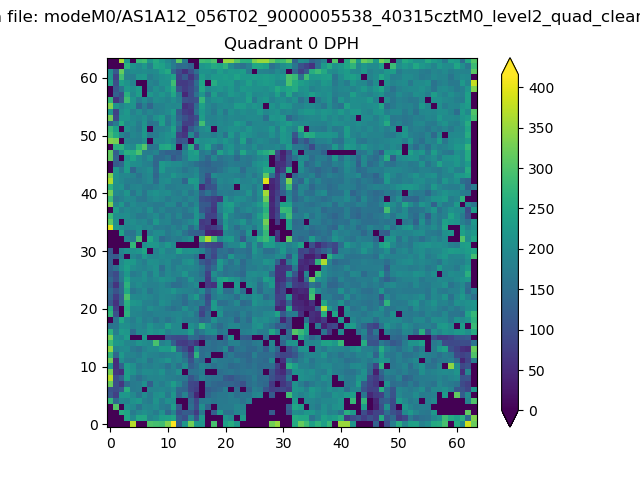 |
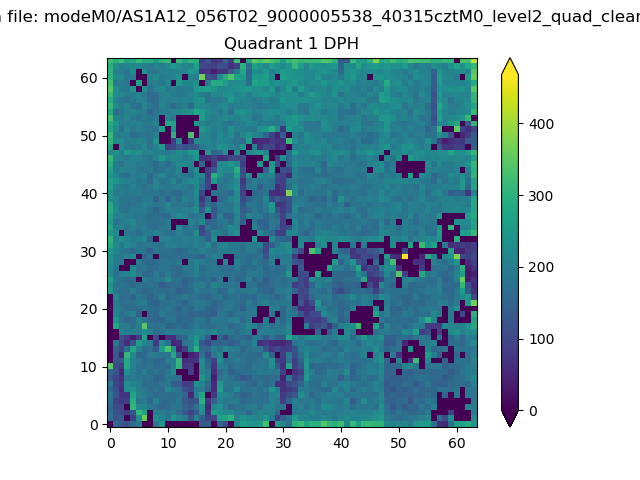 |
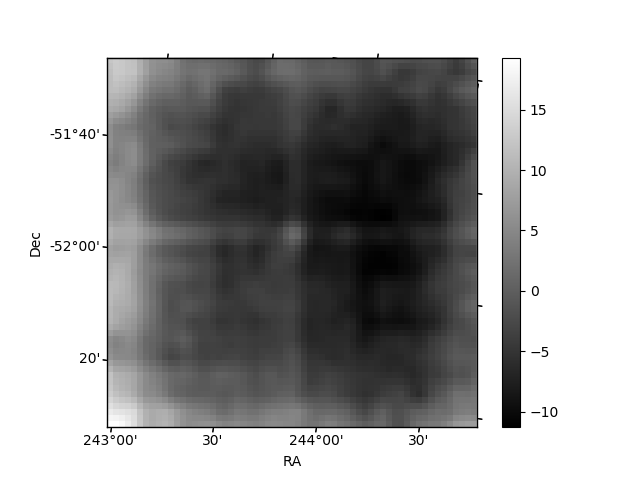
Quadrant B |
|---|---|---|---|
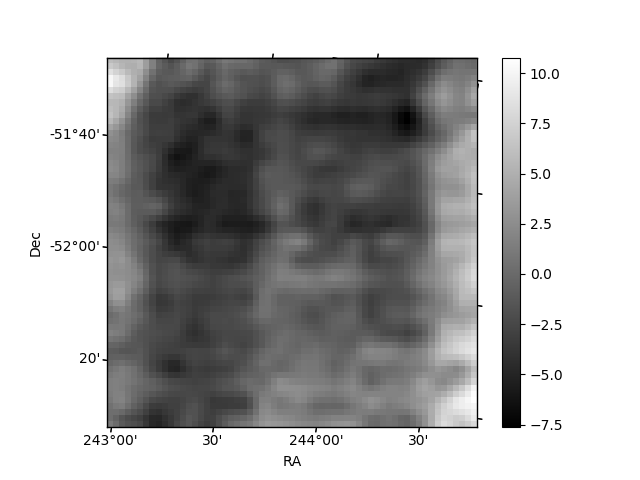
| Quadrant D | 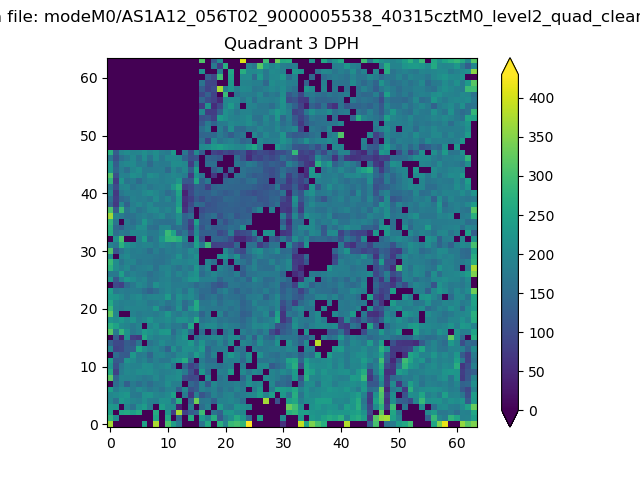 |
 |
Quadrant C |
| Plot type | Count rate plots | Images |
|---|---|---|
| Comparison with Poisson distribution Blue bars denote a histogram of data divided into 1 sec bins. Red curve is a Poisson curve with rate = median count rate of data. |
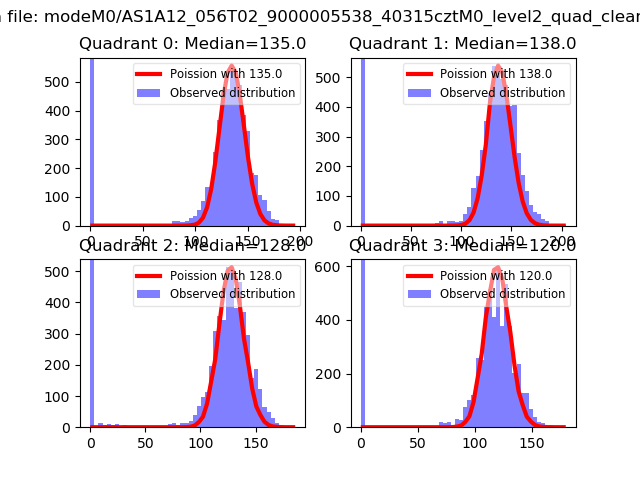 |
 |
| Quadrant-wise count rates Data is divided into 100 sec bins |
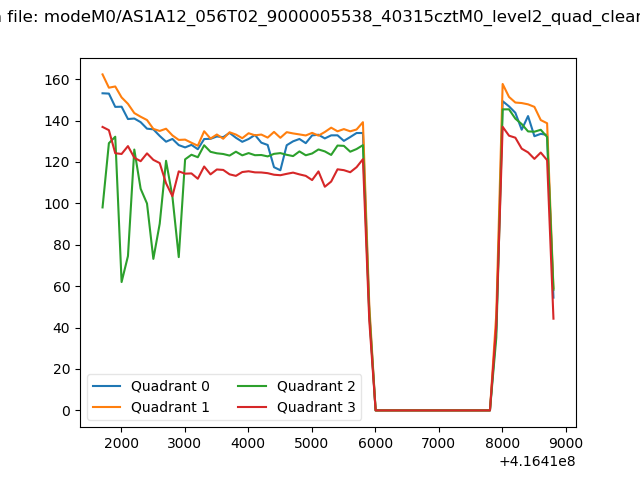 |
|
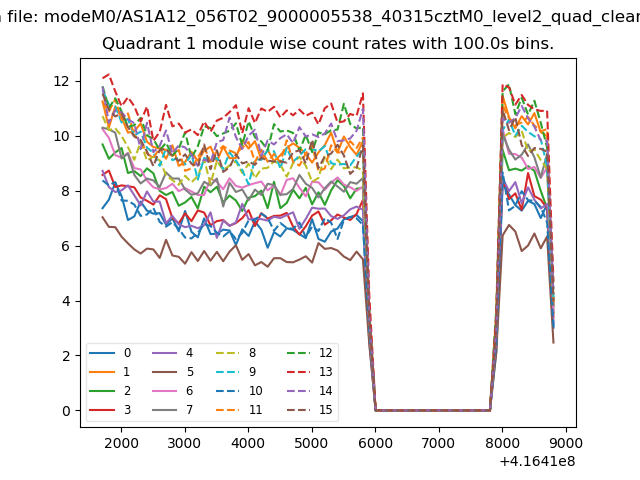
| Module-wise count rates for Quadrant A Data is divided into 100 sec bins |
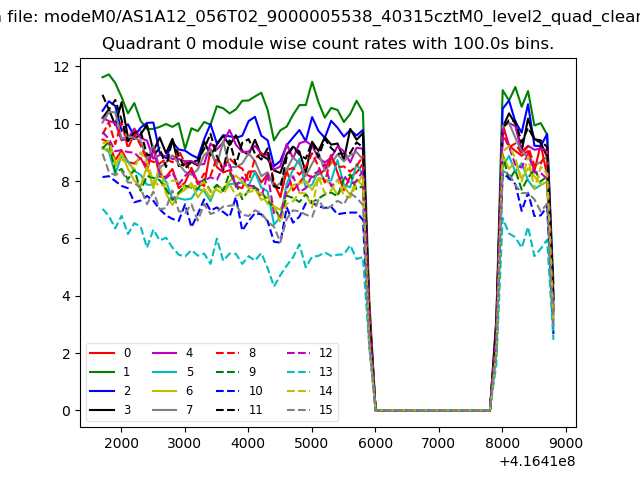 |
 |
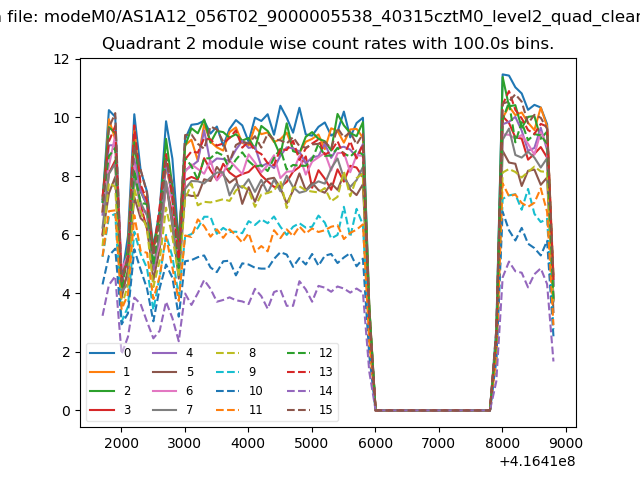
| Module-wise count rates for Quadrant B Data is divided into 100 sec bins |
 |
 |
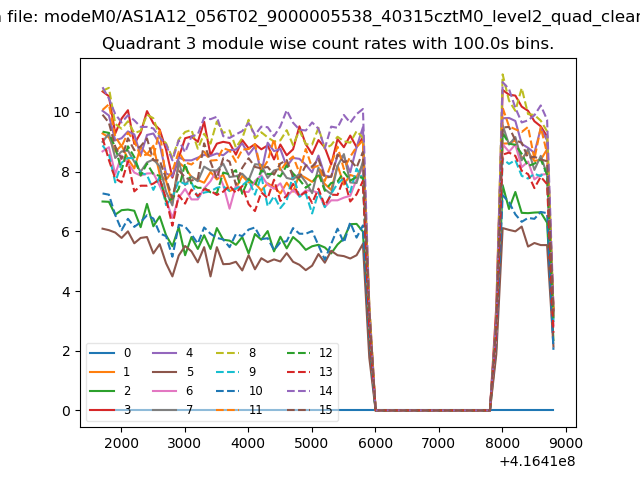
| Module-wise count rates for Quadrant C Data is divided into 100 sec bins |
 |
 |
| Module-wise count rates for Quadrant D Data is divided into 100 sec bins |
 |
 |
| Parameter | Plot |
|---|---|
| CZT HV Monitor | 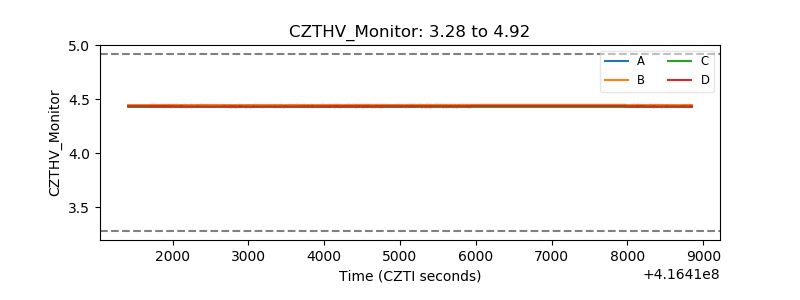 |
| D_VDD | 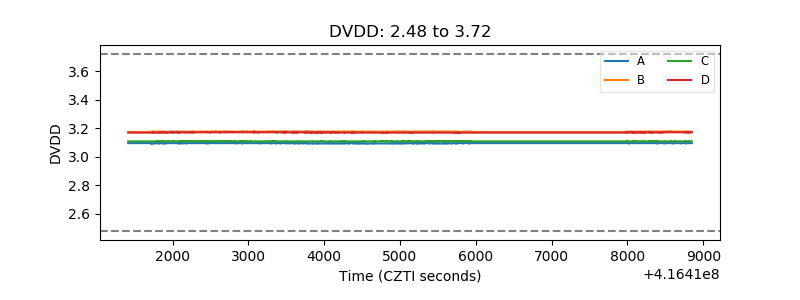 |
| Temperature 1 | 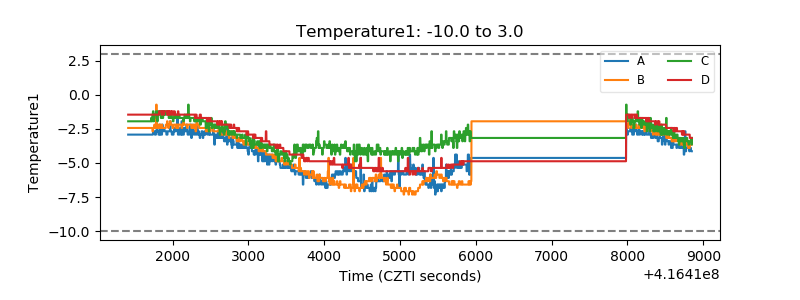 |
| Veto HV Monitor | 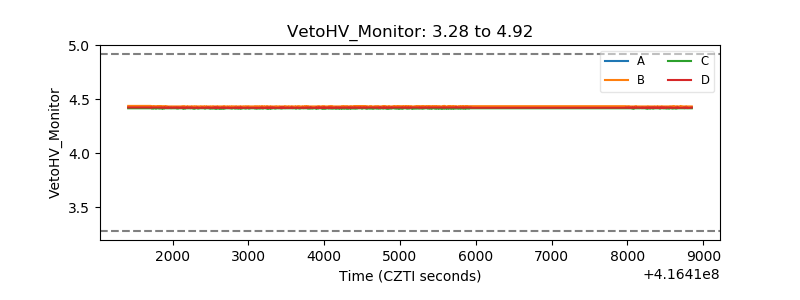 |
| Veto LLD | 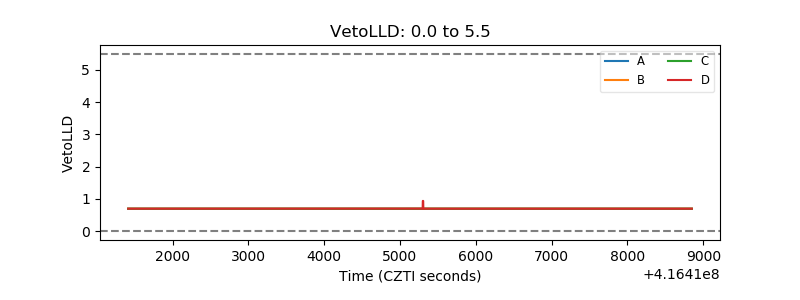 |
| Alpha Counter | 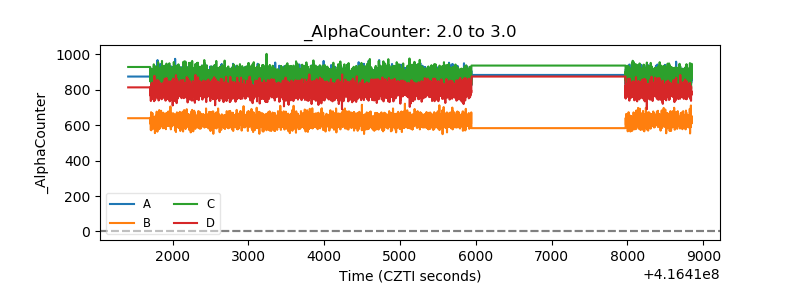 |
| _CPM_Rate | 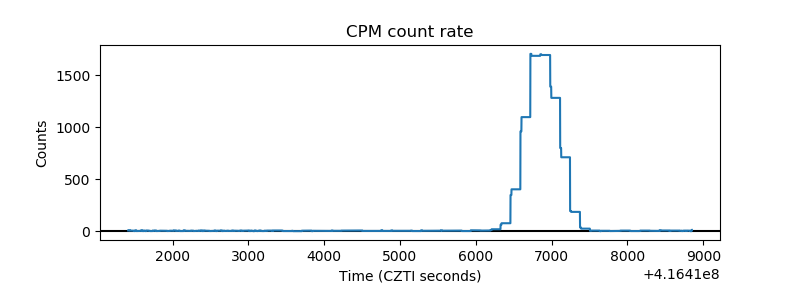 |
| CZT Counter | 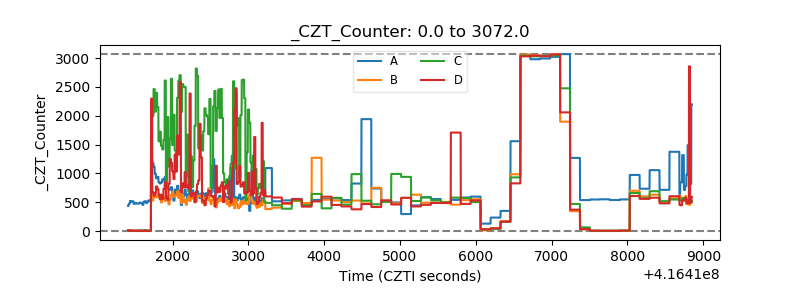 |
| +2.5 Volts monitor | 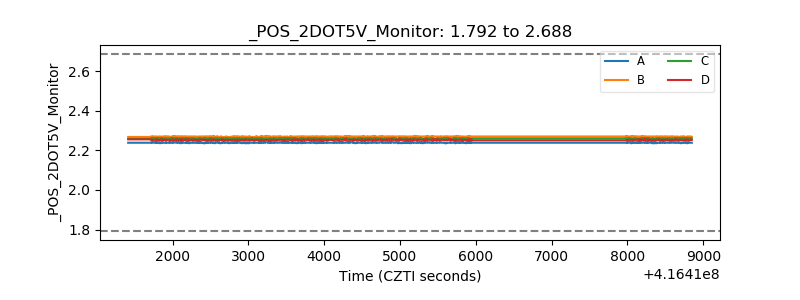 |
| +5 Volts monitor | 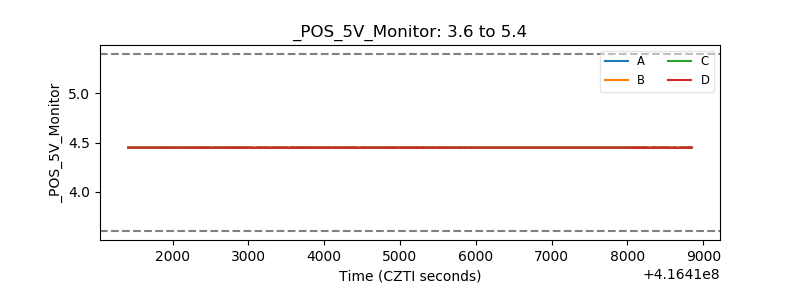 |
| _ROLL_ROT | 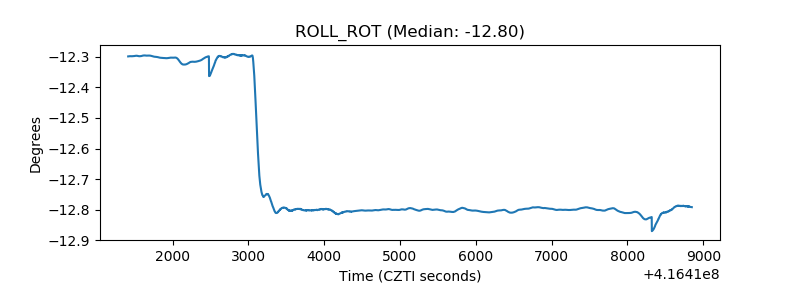 |
| _Roll_DEC | 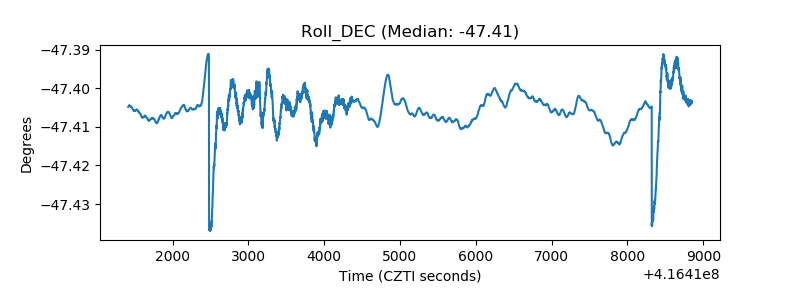 |
| _Roll_RA | 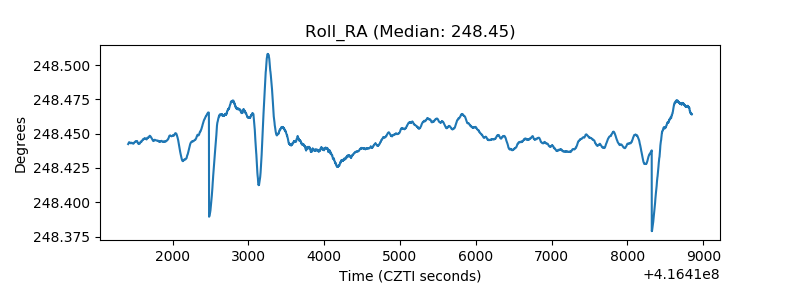 |
| Veto Counter | 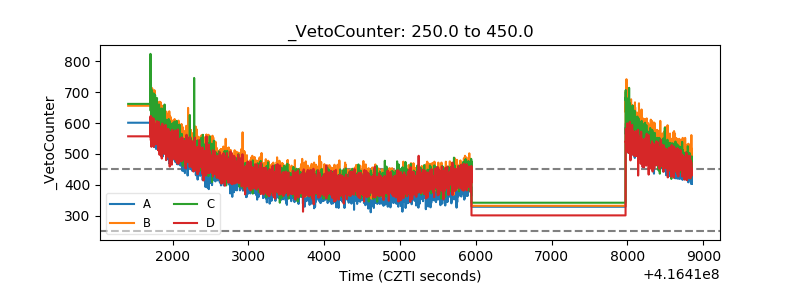 |