| Param | Original file | Final file |
|---|---|---|
| Filename | modeM0/AS1A12_056T02_9000005538_40316cztM0_level2.fits | modeM0/AS1A12_056T02_9000005538_40316cztM0_level2_quad_clean.evt |
| Size (bytes) | 326,543,040 | 97,479,360 |
| Size | 311.4 MB | 93.0 MB |
| Events in quadrant A | 3,240,519 | 674,348 |
| Events in quadrant B | 2,731,902 | 691,914 |
| Events in quadrant C | 2,630,878 | 645,725 |
| Events in quadrant D | 3,094,054 | 588,700 |
| Mode M0 | |||
|---|---|---|---|
| Quadrant | BADHDUFLAG | Total packets | Discarded packets |
| A | 0 | 12745 | 3 |
| B | 0 | 11048 | 2 |
| C | 0 | 10592 | 2 |
| D | 0 | 12453 | 2 |
| Mode M9 | |||
|---|---|---|---|
| Quadrant | BADHDUFLAG | Total packets | Discarded packets |
| A | 0 | 34 | 0 |
| B | 0 | 34 | 0 |
| C | 0 | 34 | 0 |
| D | 0 | 35 | 0 |
| Mode SS | |||
|---|---|---|---|
| Quadrant | BADHDUFLAG | Total packets | Discarded packets |
| A | 0 | 102 | 0 |
| B | 0 | 102 | 0 |
| C | 0 | 102 | 0 |
| D | 0 | 102 | 0 |
| Quadrant | Total seconds | Saturated seconds | Saturation percentage |
|---|---|---|---|
| A | 5012 | 56 | 1.117318% |
| B | 5012 | 30 | 0.598563% |
| C | 5012 | 19 | 0.379090% |
| D | 5012 | 106 | 2.114924% |
Noise dominated data is calculated using 1-second bins in cleaned event files. If a bin has >2000 counts, and if more than 50% of those come from <1% of pixels, then it is considered to be noise-dominated and hence unusable.
| Quadrant | # 1 sec bins | Bins with >0 counts | Bins with >2000 counts | High rate bins dominated by noise | Noise dominated (total time) | Noise dominated (detector-on time) | Marked lightcurve |
|---|---|---|---|---|---|---|---|
| A | 7136 | 5013 | 26 | 26 | 0.36% | 0.52% | 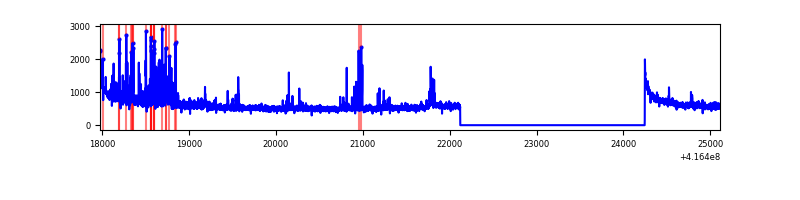 |
| B | 7136 | 5013 | 15 | 15 | 0.21% | 0.30% | 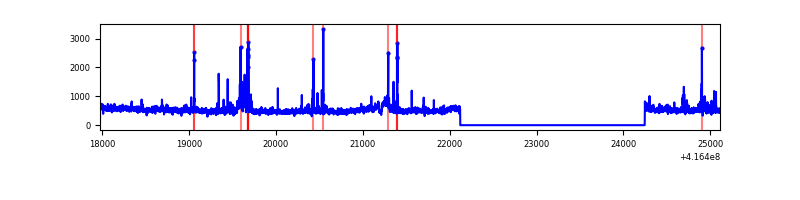 |
| C | 7136 | 5013 | 14 | 14 | 0.20% | 0.28% | 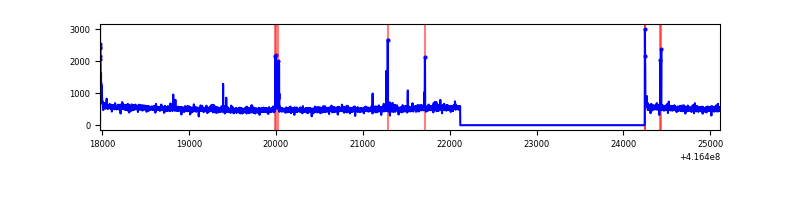 |
| D | 7136 | 5013 | 100 | 100 | 1.40% | 1.99% | 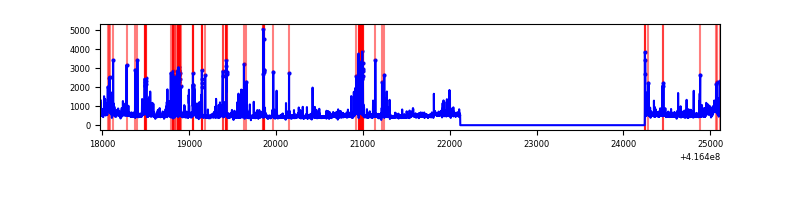 |
Top three noisy pixels from each quadrant. If the there are fewer than three noisy pixels in the level2.evt file, extra rows are filled as -1
| Pixel properties | Quadrant properties | ||||||
|---|---|---|---|---|---|---|---|
| Quadrant | DetID | PixID | Counts | Sigma | Mean | Median | Sigma |
| A | 10 | 83 | 467601 | 3751.75 | 613 | 603 | 124.5 |
| A | 13 | 248 | 239551 | 1919.65 | 613 | 603 | 124.5 |
| A | 6 | 10 | 81455 | 649.55 | 613 | 603 | 124.5 |
| B | 4 | 170 | 139786 | 1209.0 | 610 | 596 | 115.1 |
| B | 0 | 229 | 91355 | 788.33 | 610 | 596 | 115.1 |
| B | 0 | 245 | 37794 | 323.1 | 610 | 596 | 115.1 |
| C | 15 | 214 | 216102 | 1576.48 | 591 | 597 | 136.7 |
| C | 14 | 254 | 63425 | 459.61 | 591 | 597 | 136.7 |
| C | 0 | 10 | 36675 | 263.92 | 591 | 597 | 136.7 |
| D | 12 | 227 | 370860 | 2616.09 | 581 | 566 | 141.5 |
| D | 12 | 233 | 158464 | 1115.53 | 581 | 566 | 141.5 |
| D | 12 | 79 | 95527 | 670.89 | 581 | 566 | 141.5 |
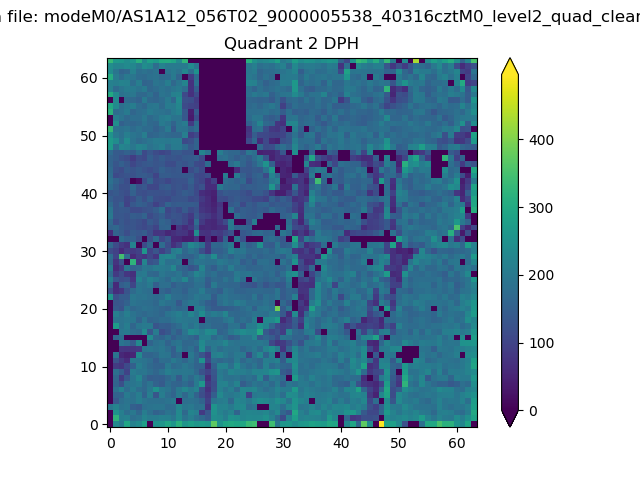
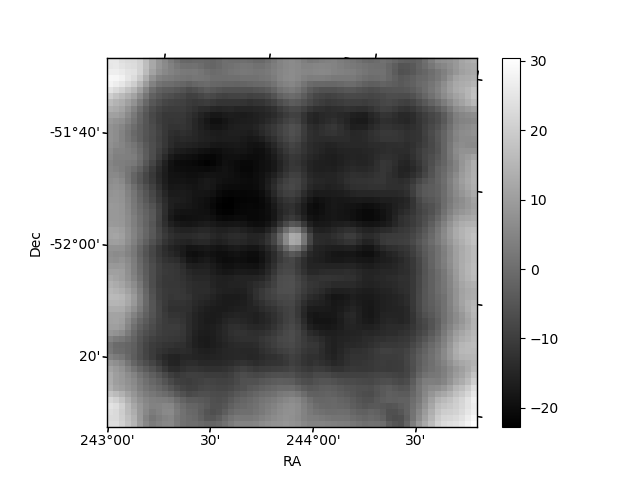
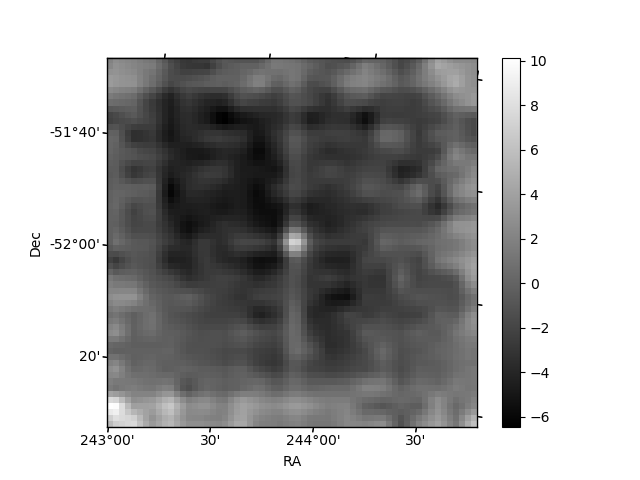
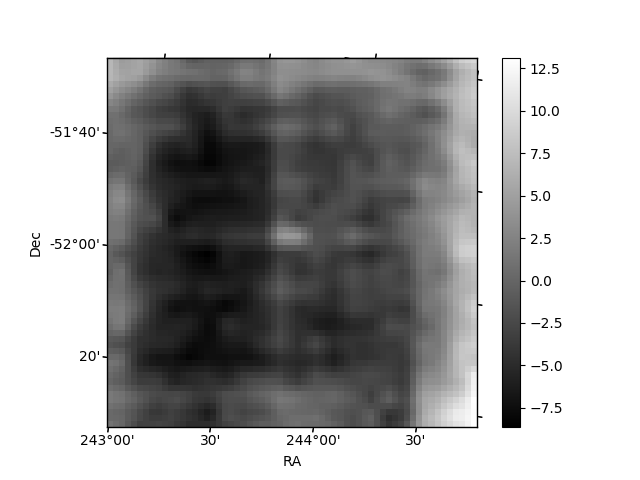
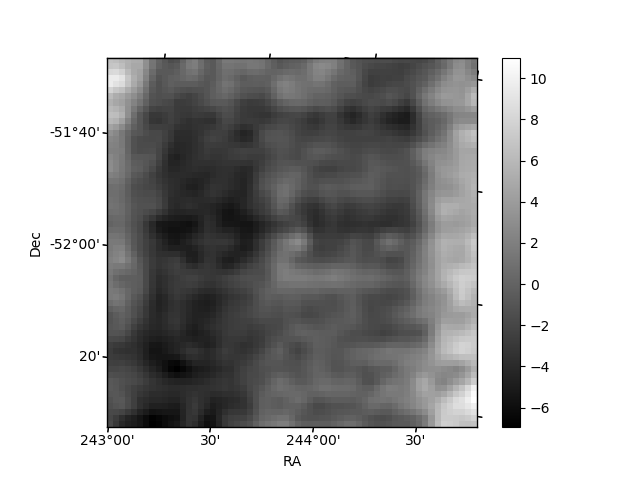
Histogram calculated using DETX and DETY for each event in the final _common_clean file
| Quadrant A | 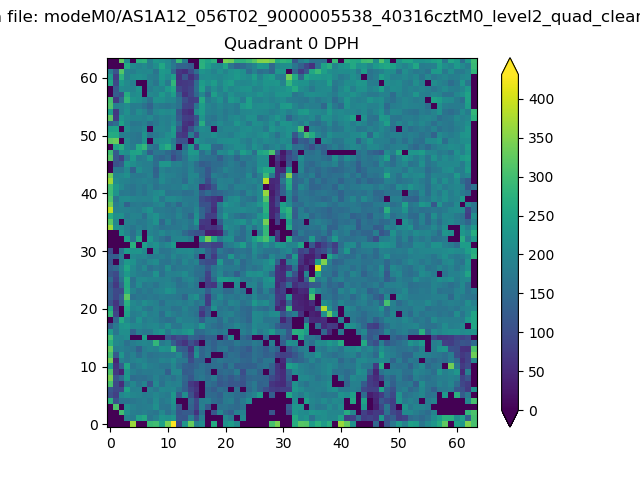 |
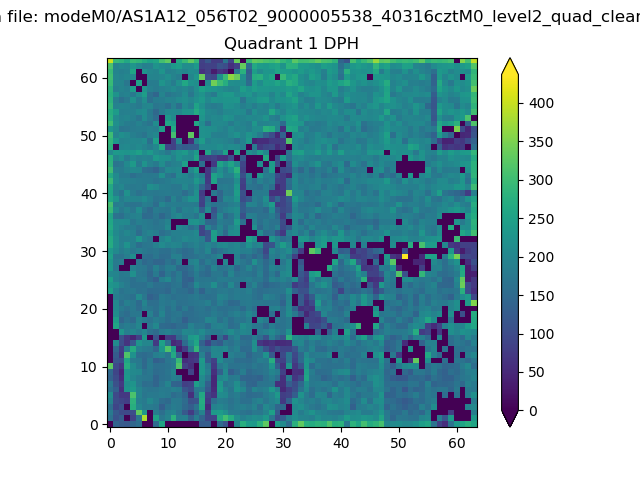 |
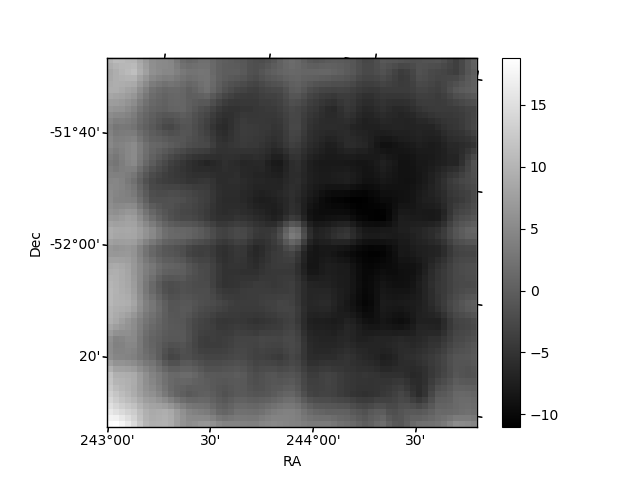
Quadrant B |
|---|---|---|---|
| Quadrant D | 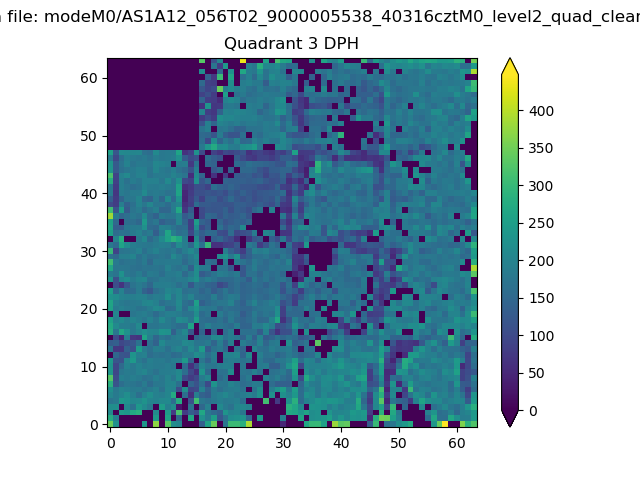 |
 |
Quadrant C |
| Plot type | Count rate plots | Images |
|---|---|---|
| Comparison with Poisson distribution Blue bars denote a histogram of data divided into 1 sec bins. Red curve is a Poisson curve with rate = median count rate of data. |
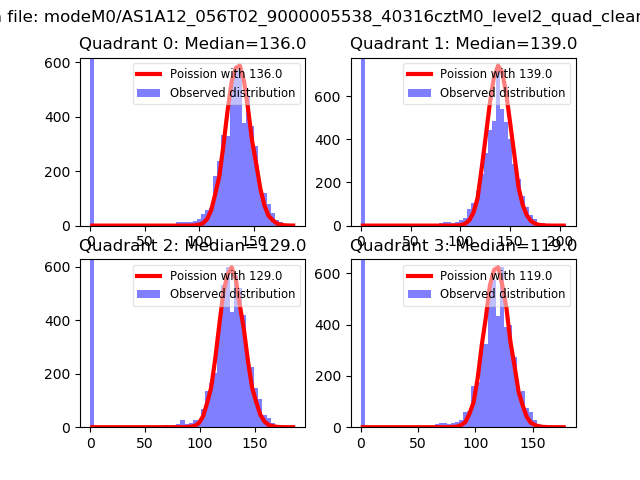 |
 |
| Quadrant-wise count rates Data is divided into 100 sec bins |
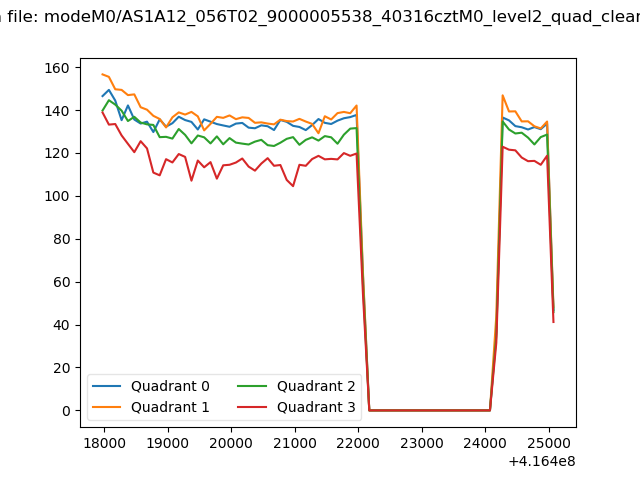 |
|
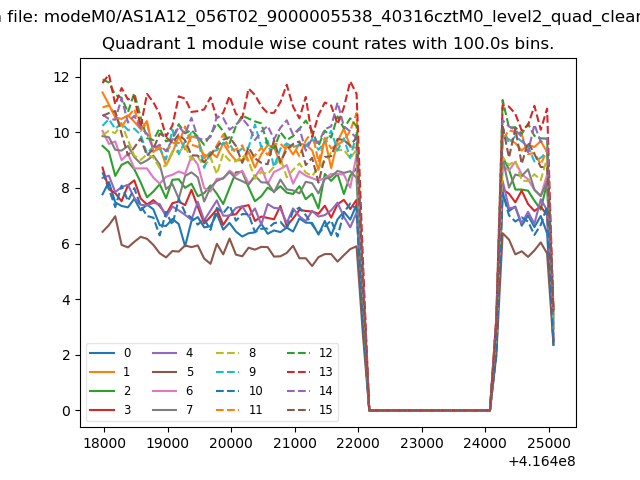
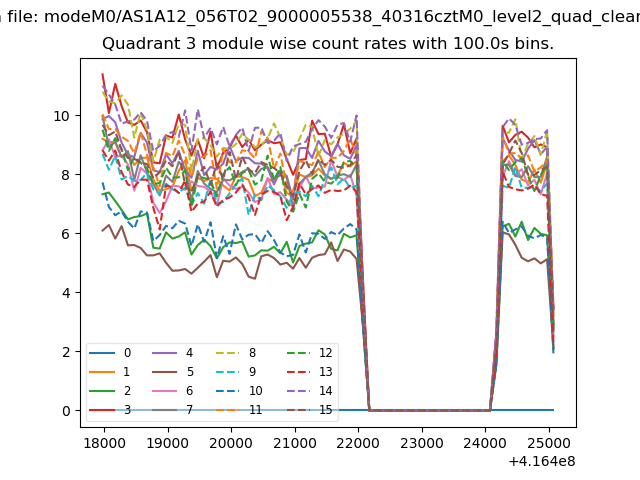
| Module-wise count rates for Quadrant A Data is divided into 100 sec bins |
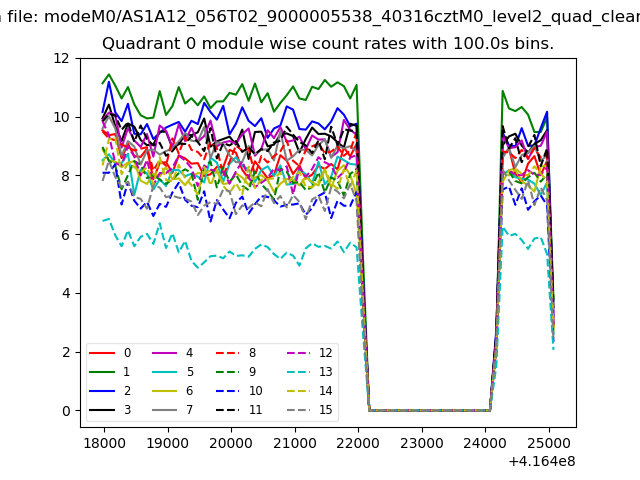 |
 |
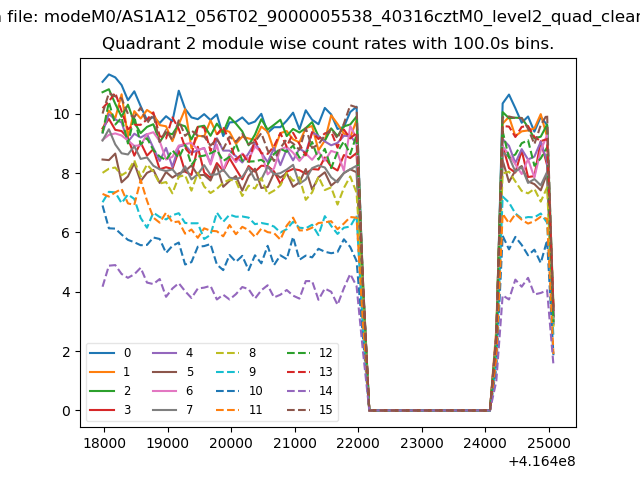
| Module-wise count rates for Quadrant B Data is divided into 100 sec bins |
 |
 |
| Module-wise count rates for Quadrant C Data is divided into 100 sec bins |
 |
 |
| Module-wise count rates for Quadrant D Data is divided into 100 sec bins |
 |
 |
| Parameter | Plot |
|---|---|
| CZT HV Monitor | 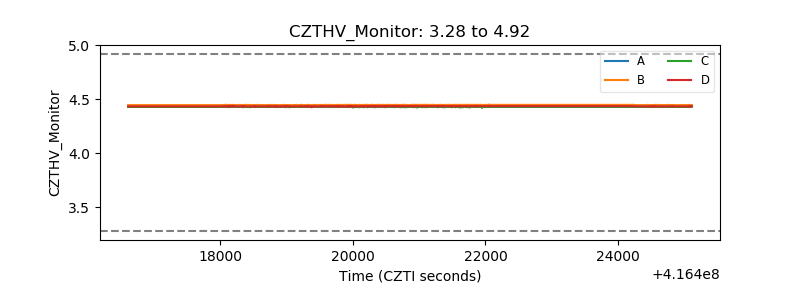 |
| D_VDD | 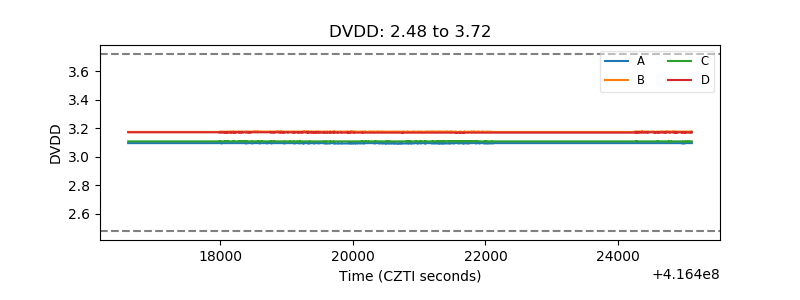 |
| Temperature 1 | 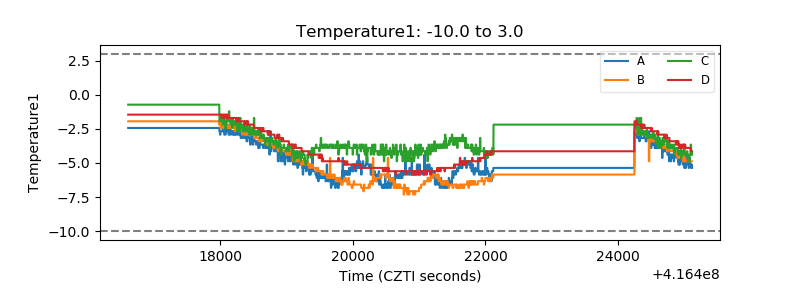 |
| Veto HV Monitor | 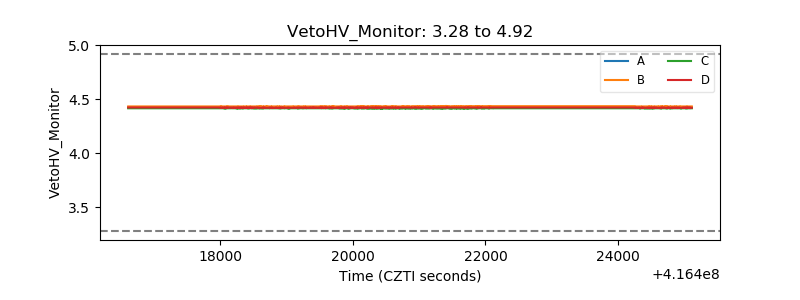 |
| Veto LLD | 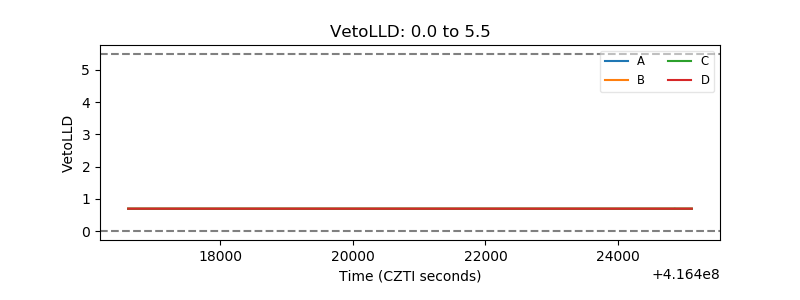 |
| Alpha Counter | 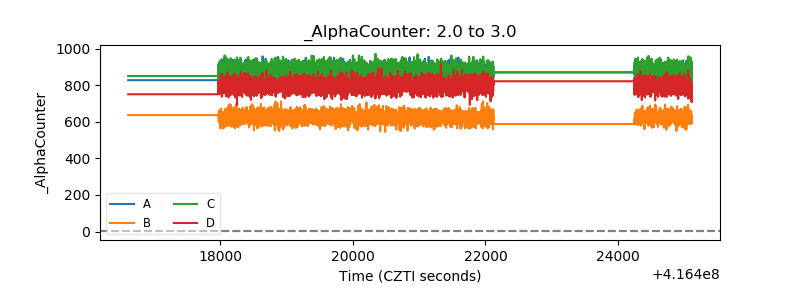 |
| _CPM_Rate |  |
| CZT Counter | 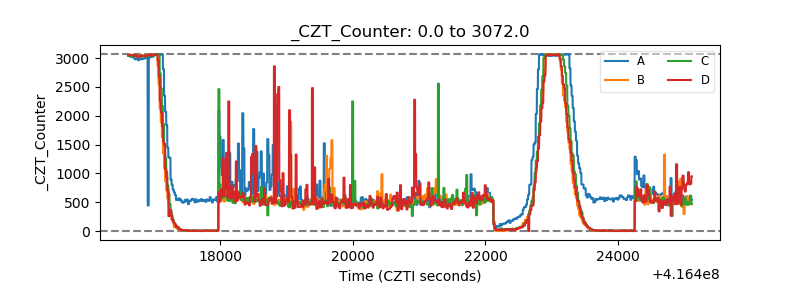 |
| +2.5 Volts monitor |  |
| +5 Volts monitor | 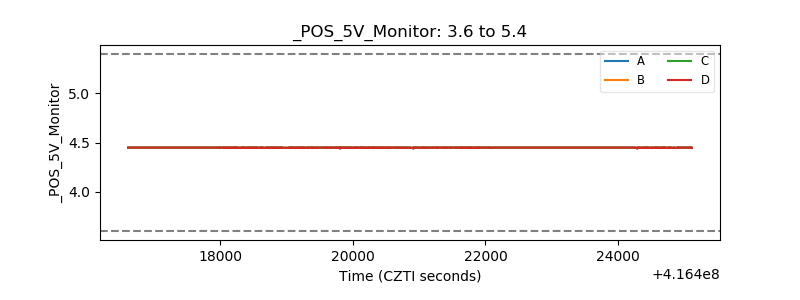 |
| _ROLL_ROT | 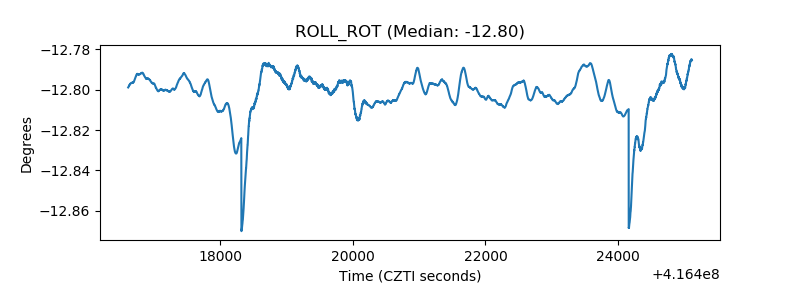 |
| _Roll_DEC | 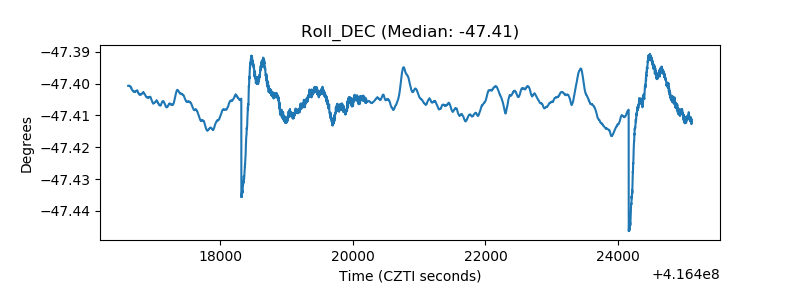 |
| _Roll_RA | 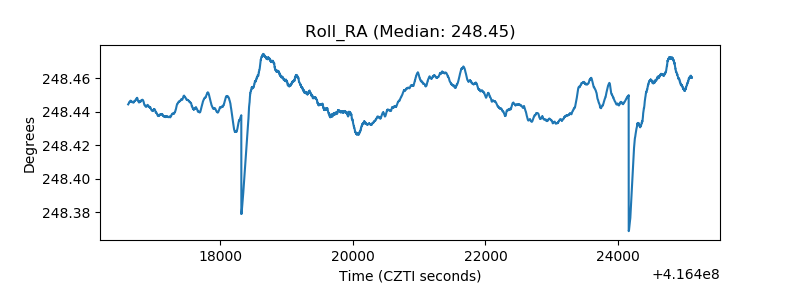 |
| Veto Counter | 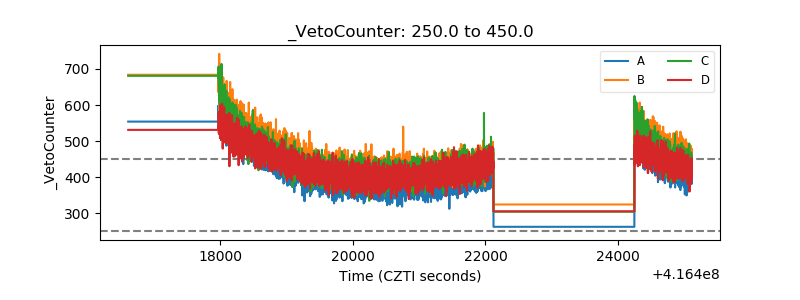 |