| Param | Original file | Final file |
|---|---|---|
| Filename | modeM0/AS1A12_056T02_9000005538_40317cztM0_level2.fits | modeM0/AS1A12_056T02_9000005538_40317cztM0_level2_quad_clean.evt |
| Size (bytes) | 305,735,040 | 92,805,120 |
| Size | 291.6 MB | 88.5 MB |
| Events in quadrant A | 3,214,562 | 633,906 |
| Events in quadrant B | 2,443,231 | 656,406 |
| Events in quadrant C | 2,489,074 | 614,458 |
| Events in quadrant D | 2,784,257 | 558,546 |
| Mode M0 | |||
|---|---|---|---|
| Quadrant | BADHDUFLAG | Total packets | Discarded packets |
| A | 0 | 12725 | 3 |
| B | 0 | 10314 | 2 |
| C | 0 | 10209 | 2 |
| D | 0 | 11750 | 2 |
| Mode M9 | |||
|---|---|---|---|
| Quadrant | BADHDUFLAG | Total packets | Discarded packets |
| A | 0 | 34 | 0 |
| B | 0 | 34 | 0 |
| C | 0 | 34 | 0 |
| D | 0 | 35 | 0 |
| Mode SS | |||
|---|---|---|---|
| Quadrant | BADHDUFLAG | Total packets | Discarded packets |
| A | 0 | 100 | 0 |
| B | 0 | 100 | 0 |
| C | 0 | 100 | 0 |
| D | 0 | 100 | 0 |
| Quadrant | Total seconds | Saturated seconds | Saturation percentage |
|---|---|---|---|
| A | 4954 | 98 | 1.978199% |
| B | 4954 | 12 | 0.242229% |
| C | 4954 | 14 | 0.282600% |
| D | 4954 | 69 | 1.392814% |
Noise dominated data is calculated using 1-second bins in cleaned event files. If a bin has >2000 counts, and if more than 50% of those come from <1% of pixels, then it is considered to be noise-dominated and hence unusable.
| Quadrant | # 1 sec bins | Bins with >0 counts | Bins with >2000 counts | High rate bins dominated by noise | Noise dominated (total time) | Noise dominated (detector-on time) | Marked lightcurve |
|---|---|---|---|---|---|---|---|
| A | 7077 | 4955 | 84 | 84 | 1.19% | 1.70% | 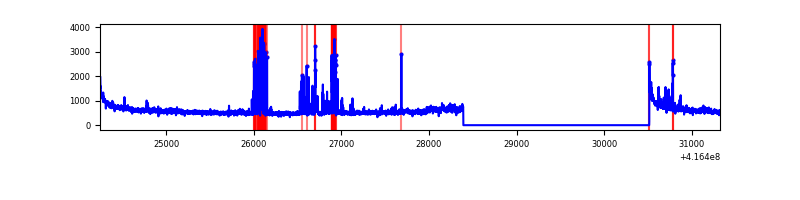 |
| B | 7077 | 4955 | 6 | 6 | 0.08% | 0.12% | 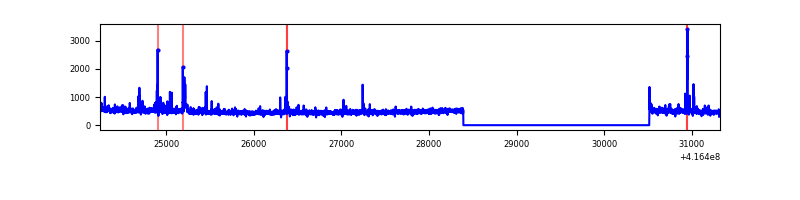 |
| C | 7077 | 4955 | 8 | 8 | 0.11% | 0.16% | 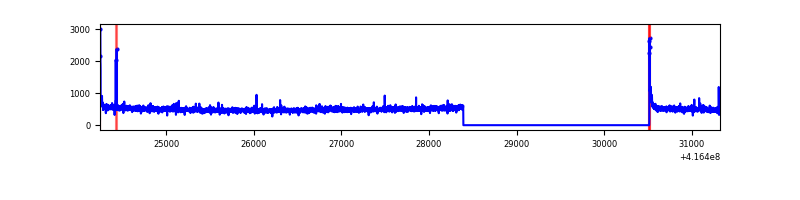 |
| D | 7077 | 4955 | 66 | 66 | 0.93% | 1.33% | 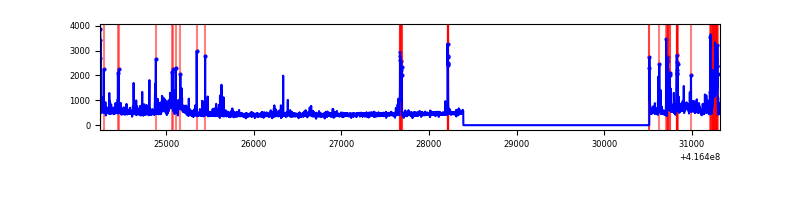 |
Top three noisy pixels from each quadrant. If the there are fewer than three noisy pixels in the level2.evt file, extra rows are filled as -1
| Pixel properties | Quadrant properties | ||||||
|---|---|---|---|---|---|---|---|
| Quadrant | DetID | PixID | Counts | Sigma | Mean | Median | Sigma |
| A | 10 | 83 | 457137 | 3843.0 | 581 | 571 | 118.8 |
| A | 13 | 248 | 367557 | 3088.99 | 581 | 571 | 118.8 |
| A | 12 | 189 | 89887 | 751.79 | 581 | 571 | 118.8 |
| B | 0 | 245 | 54935 | 489.54 | 583 | 570 | 111.1 |
| B | 5 | 255 | 41210 | 365.95 | 583 | 570 | 111.1 |
| B | 4 | 170 | 23435 | 205.89 | 583 | 570 | 111.1 |
| C | 15 | 214 | 214009 | 1619.29 | 565 | 571 | 131.8 |
| C | 0 | 10 | 38081 | 284.58 | 565 | 571 | 131.8 |
| C | 14 | 254 | 15542 | 113.58 | 565 | 571 | 131.8 |
| D | 12 | 79 | 189511 | 1388.83 | 556 | 543 | 136.1 |
| D | 12 | 227 | 161675 | 1184.25 | 556 | 543 | 136.1 |
| D | 9 | 19 | 90560 | 661.59 | 556 | 543 | 136.1 |
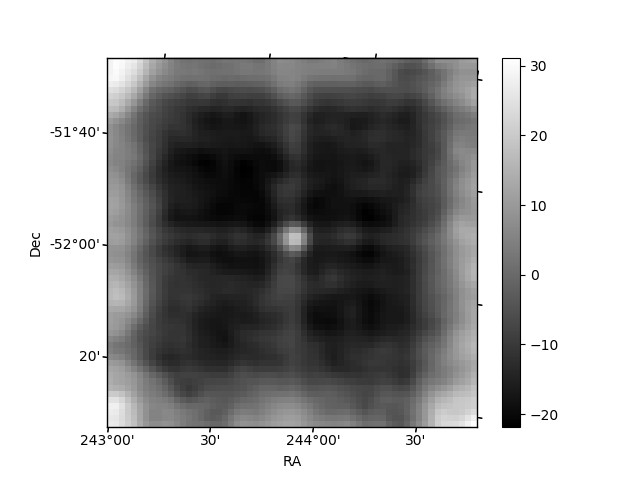
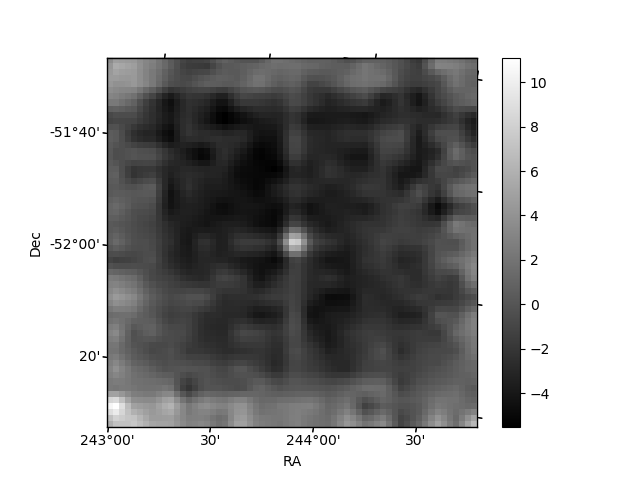
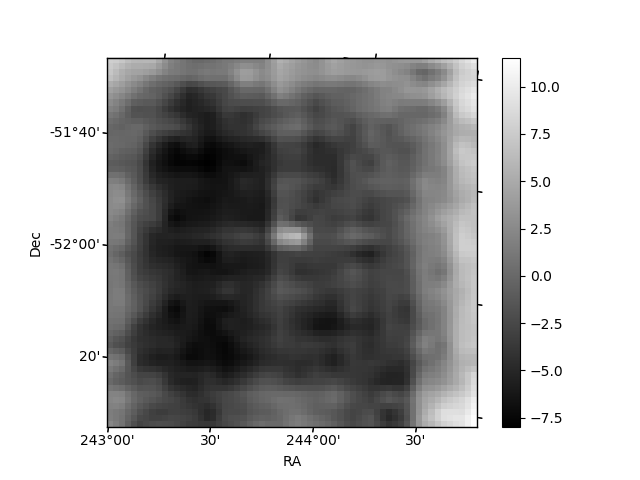
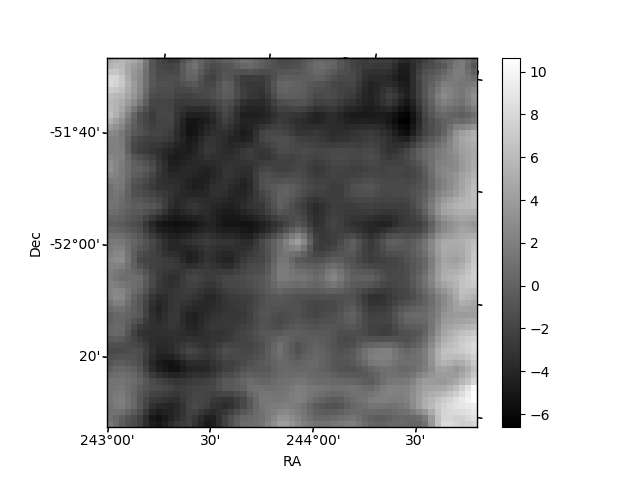
Histogram calculated using DETX and DETY for each event in the final _common_clean file
| Quadrant A | 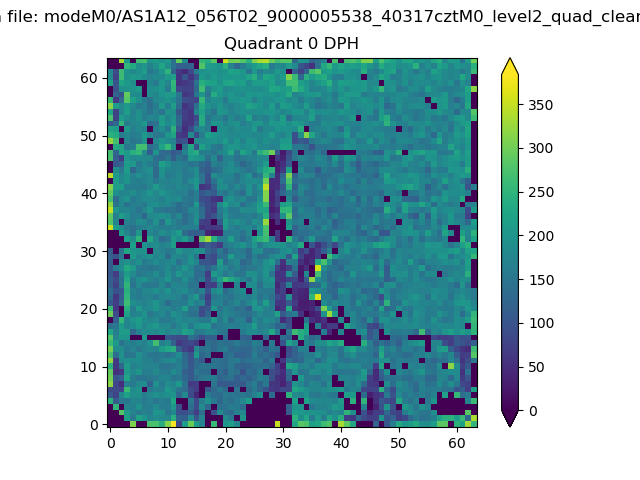 |
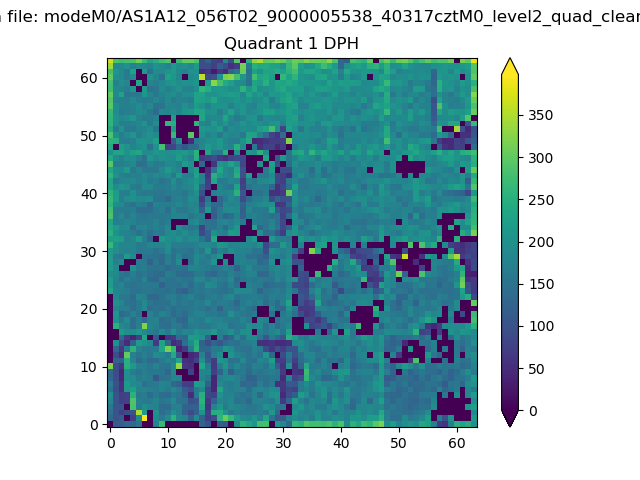 |
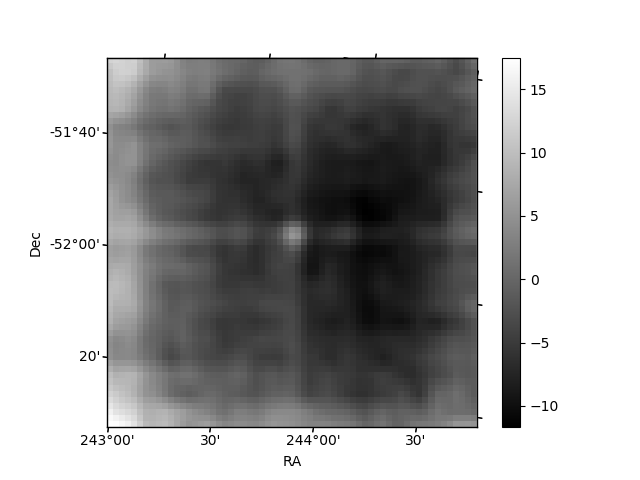
Quadrant B |
|---|---|---|---|
| Quadrant D | 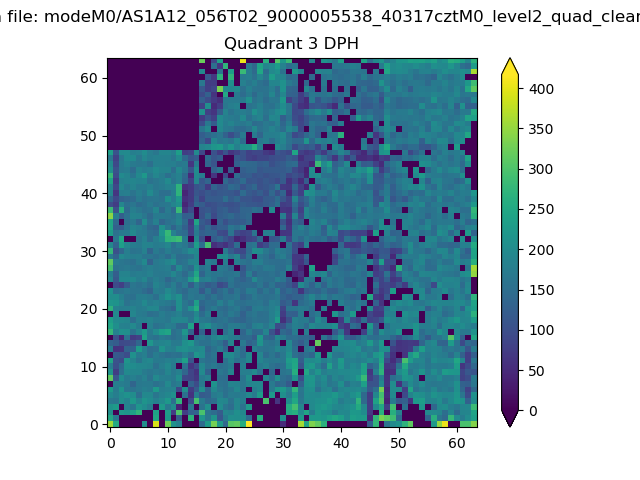 |
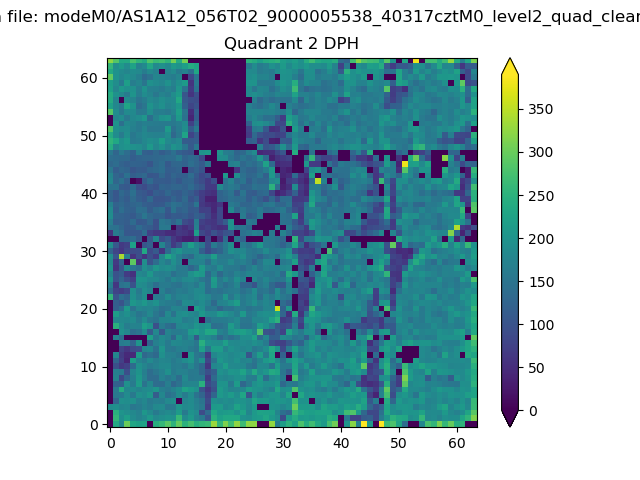 |
Quadrant C |
| Plot type | Count rate plots | Images |
|---|---|---|
| Comparison with Poisson distribution Blue bars denote a histogram of data divided into 1 sec bins. Red curve is a Poisson curve with rate = median count rate of data. |
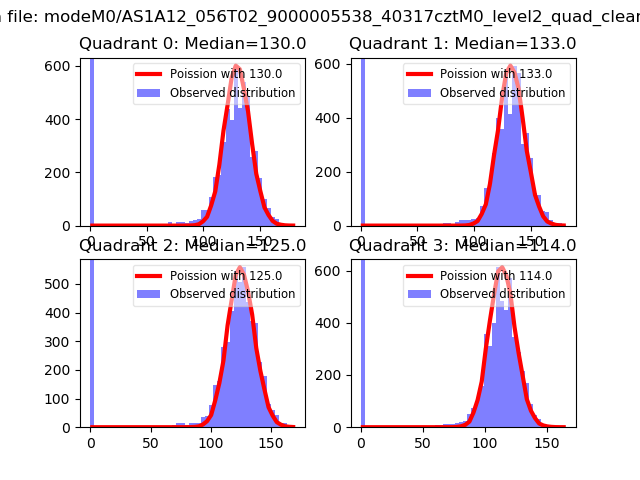 |
 |
| Quadrant-wise count rates Data is divided into 100 sec bins |
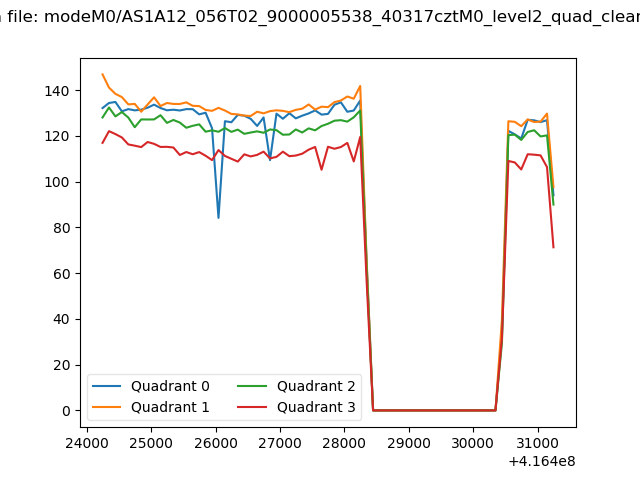 |
|
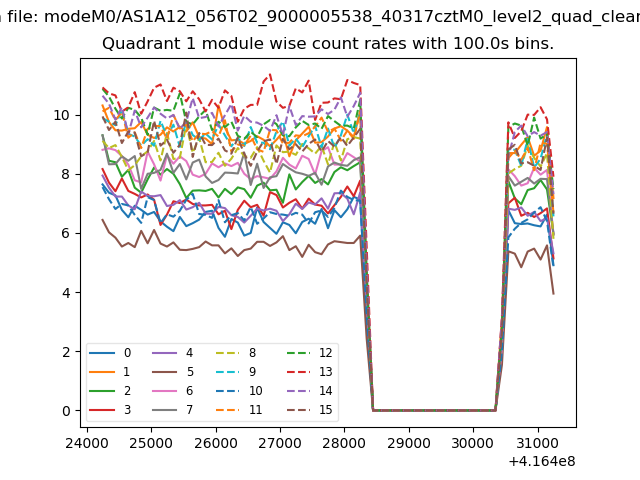
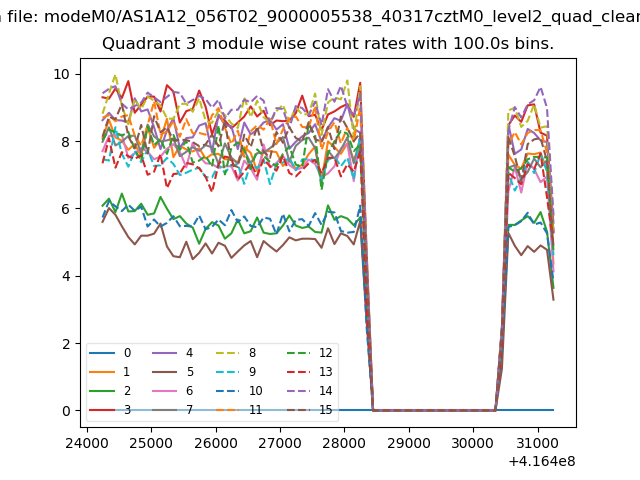
| Module-wise count rates for Quadrant A Data is divided into 100 sec bins |
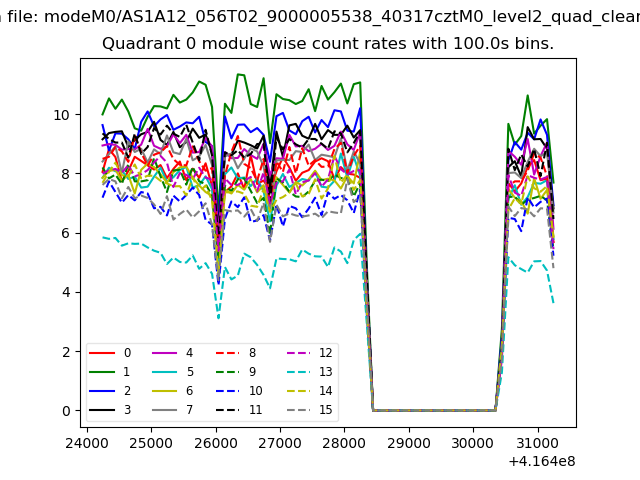 |
 |
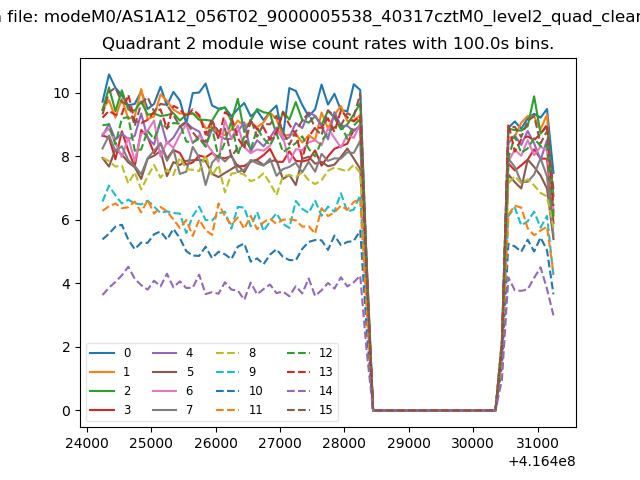
| Module-wise count rates for Quadrant B Data is divided into 100 sec bins |
 |
 |
| Module-wise count rates for Quadrant C Data is divided into 100 sec bins |
 |
 |
| Module-wise count rates for Quadrant D Data is divided into 100 sec bins |
 |
 |
| Parameter | Plot |
|---|---|
| CZT HV Monitor | 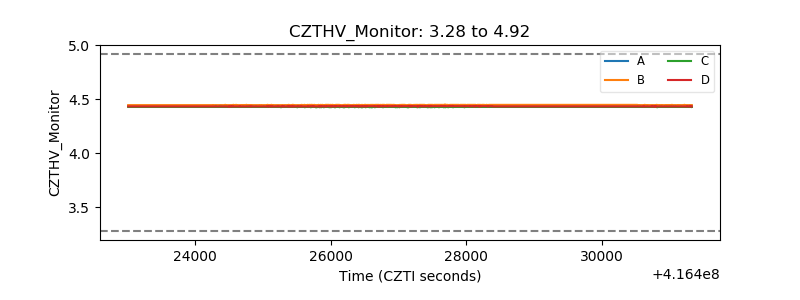 |
| D_VDD | 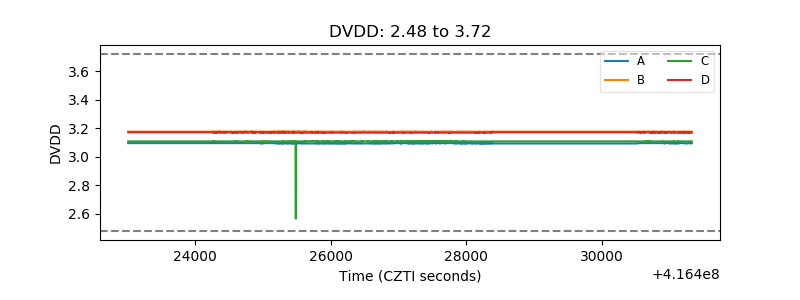 |
| Temperature 1 | 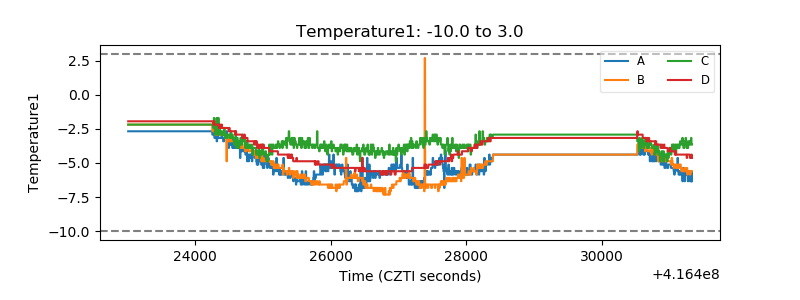 |
| Veto HV Monitor | 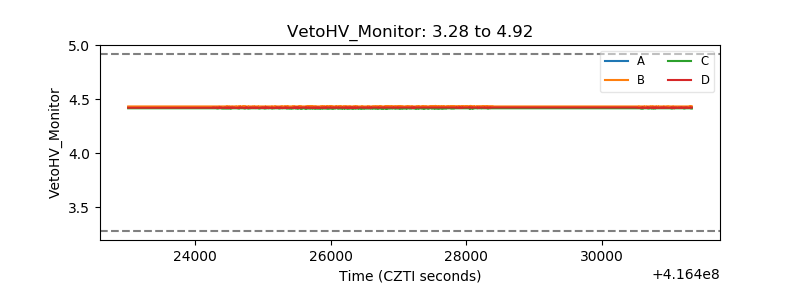 |
| Veto LLD | 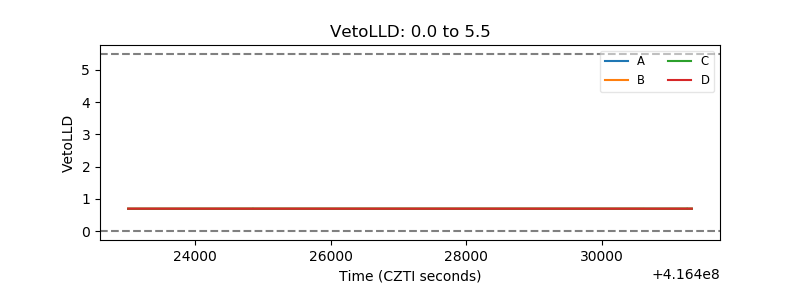 |
| Alpha Counter | 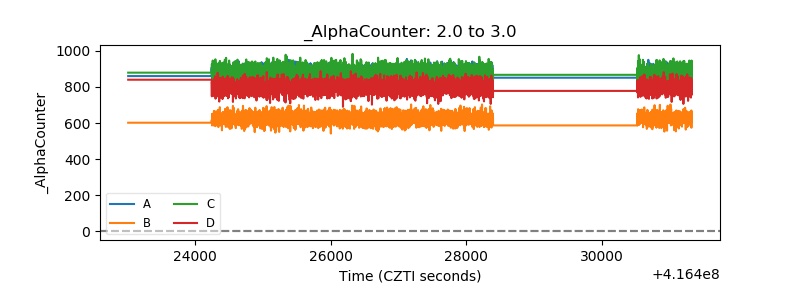 |
| _CPM_Rate | 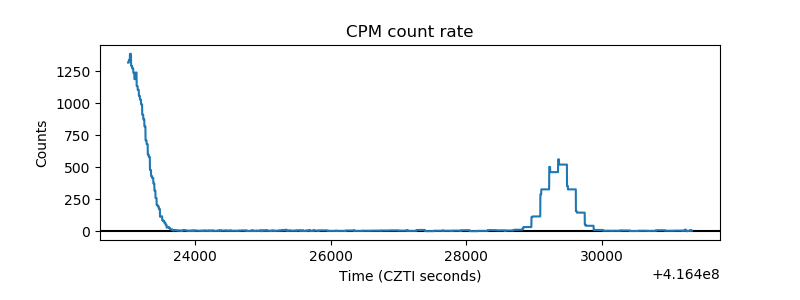 |
| CZT Counter | 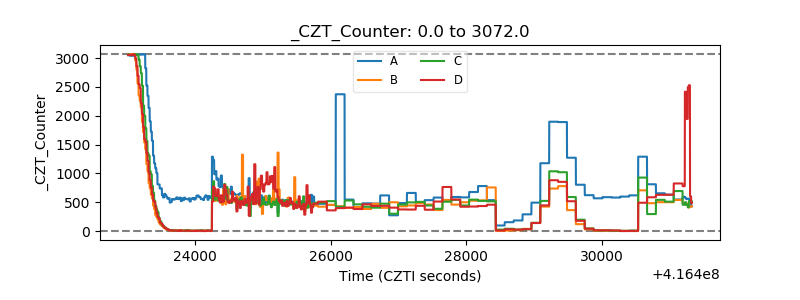 |
| +2.5 Volts monitor | 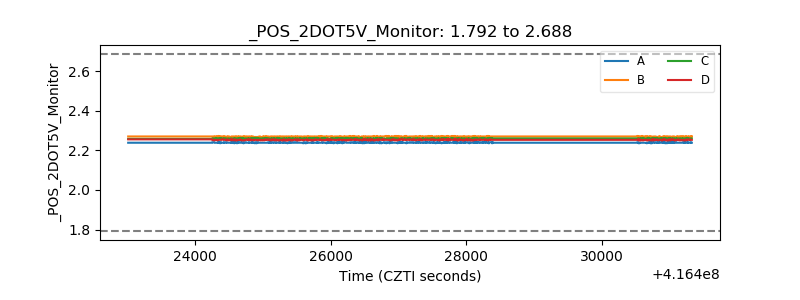 |
| +5 Volts monitor |  |
| _ROLL_ROT | 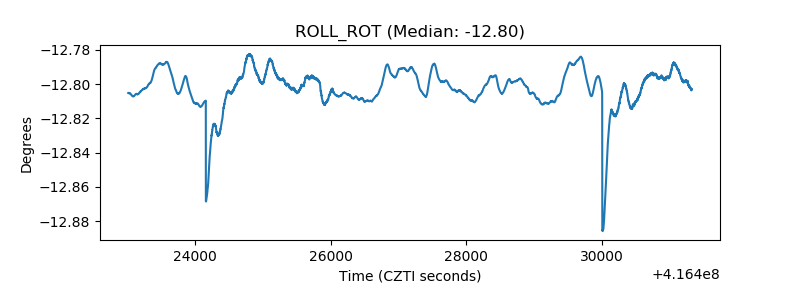 |
| _Roll_DEC | 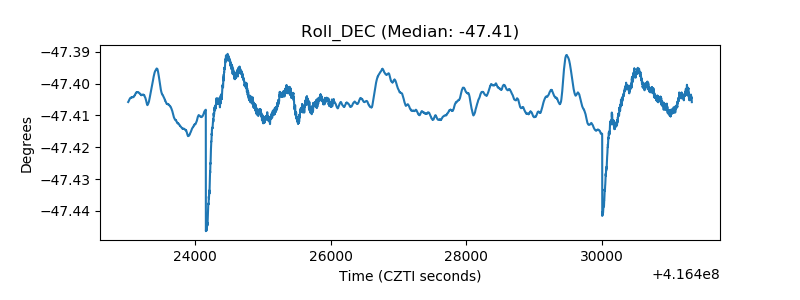 |
| _Roll_RA | 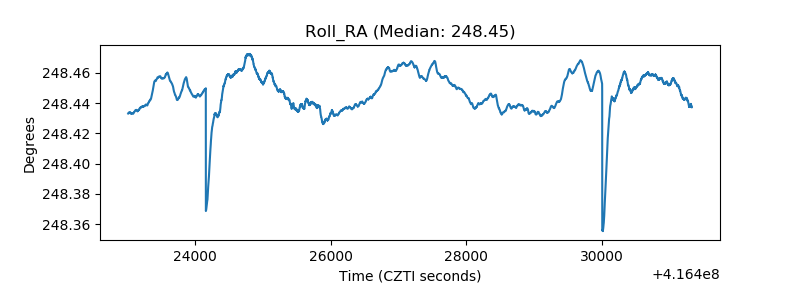 |
| Veto Counter | 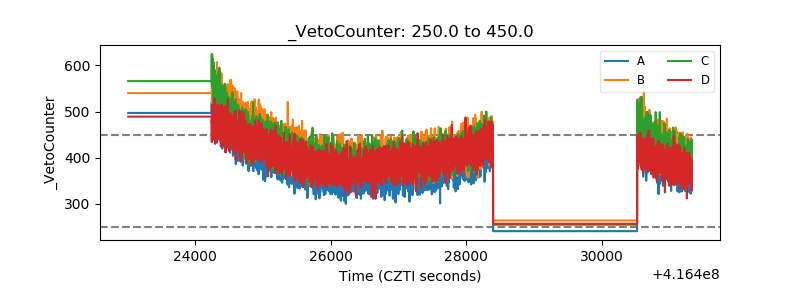 |