| Param | Original file | Final file |
|---|---|---|
| Filename | modeM0/AS1A12_056T02_9000005538_40318cztM0_level2.fits | modeM0/AS1A12_056T02_9000005538_40318cztM0_level2_quad_clean.evt |
| Size (bytes) | 307,627,200 | 91,471,680 |
| Size | 293.4 MB | 87.2 MB |
| Events in quadrant A | 2,971,396 | 628,075 |
| Events in quadrant B | 2,459,169 | 640,697 |
| Events in quadrant C | 2,653,142 | 600,550 |
| Events in quadrant D | 2,908,114 | 545,366 |
| Mode M0 | |||
|---|---|---|---|
| Quadrant | BADHDUFLAG | Total packets | Discarded packets |
| A | 0 | 11949 | 3 |
| B | 0 | 10630 | 2 |
| C | 0 | 10914 | 2 |
| D | 0 | 12264 | 2 |
| Mode M9 | |||
|---|---|---|---|
| Quadrant | BADHDUFLAG | Total packets | Discarded packets |
| A | 0 | 25 | 0 |
| B | 0 | 25 | 0 |
| C | 0 | 25 | 0 |
| D | 0 | 26 | 0 |
| Mode SS | |||
|---|---|---|---|
| Quadrant | BADHDUFLAG | Total packets | Discarded packets |
| A | 0 | 102 | 0 |
| B | 0 | 102 | 0 |
| C | 0 | 102 | 0 |
| D | 0 | 102 | 0 |
| Quadrant | Total seconds | Saturated seconds | Saturation percentage |
|---|---|---|---|
| A | 5075 | 36 | 0.709360% |
| B | 5075 | 25 | 0.492611% |
| C | 5075 | 45 | 0.886700% |
| D | 5075 | 114 | 2.246305% |
Noise dominated data is calculated using 1-second bins in cleaned event files. If a bin has >2000 counts, and if more than 50% of those come from <1% of pixels, then it is considered to be noise-dominated and hence unusable.
| Quadrant | # 1 sec bins | Bins with >0 counts | Bins with >2000 counts | High rate bins dominated by noise | Noise dominated (total time) | Noise dominated (detector-on time) | Marked lightcurve |
|---|---|---|---|---|---|---|---|
| A | 7078 | 5076 | 27 | 27 | 0.38% | 0.53% | 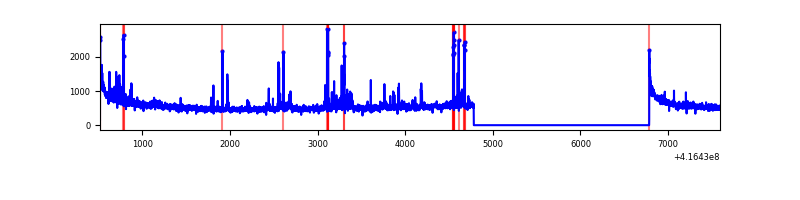 |
| B | 7078 | 5076 | 17 | 17 | 0.24% | 0.33% | 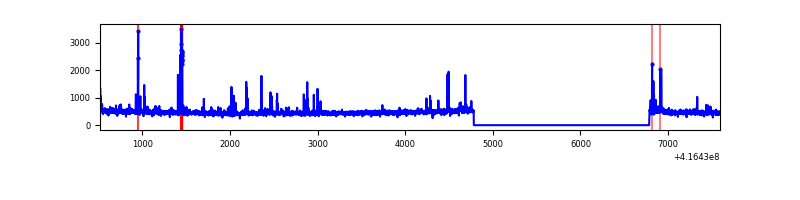 |
| C | 7078 | 5076 | 44 | 44 | 0.62% | 0.87% | 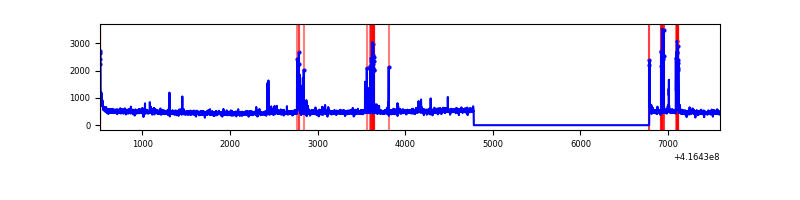 |
| D | 7078 | 5076 | 111 | 111 | 1.57% | 2.19% | 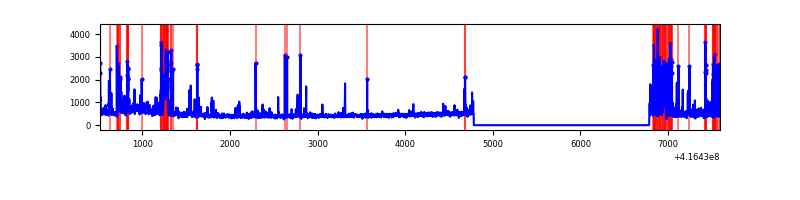 |
Top three noisy pixels from each quadrant. If the there are fewer than three noisy pixels in the level2.evt file, extra rows are filled as -1
| Pixel properties | Quadrant properties | ||||||
|---|---|---|---|---|---|---|---|
| Quadrant | DetID | PixID | Counts | Sigma | Mean | Median | Sigma |
| A | 10 | 83 | 463537 | 3925.4 | 575 | 566 | 117.9 |
| A | 13 | 248 | 158781 | 1341.46 | 575 | 566 | 117.9 |
| A | 12 | 189 | 32920 | 274.32 | 575 | 566 | 117.9 |
| B | 4 | 170 | 59940 | 533.57 | 577 | 563 | 111.3 |
| B | 0 | 229 | 51682 | 459.36 | 577 | 563 | 111.3 |
| B | 5 | 255 | 50246 | 446.46 | 577 | 563 | 111.3 |
| C | 15 | 214 | 218595 | 1649.16 | 561 | 566 | 132.2 |
| C | 14 | 254 | 155384 | 1171.03 | 561 | 566 | 132.2 |
| C | 9 | 187 | 53314 | 398.98 | 561 | 566 | 132.2 |
| D | 12 | 227 | 336764 | 2460.1 | 551 | 537 | 136.7 |
| D | 12 | 79 | 121665 | 886.27 | 551 | 537 | 136.7 |
| D | 1 | 47 | 108132 | 787.25 | 551 | 537 | 136.7 |
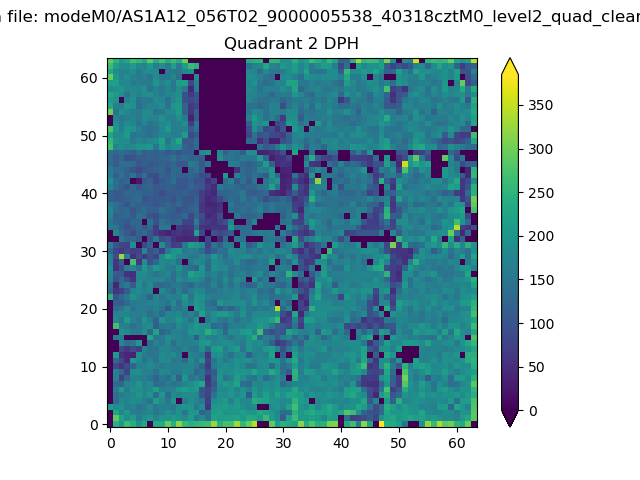
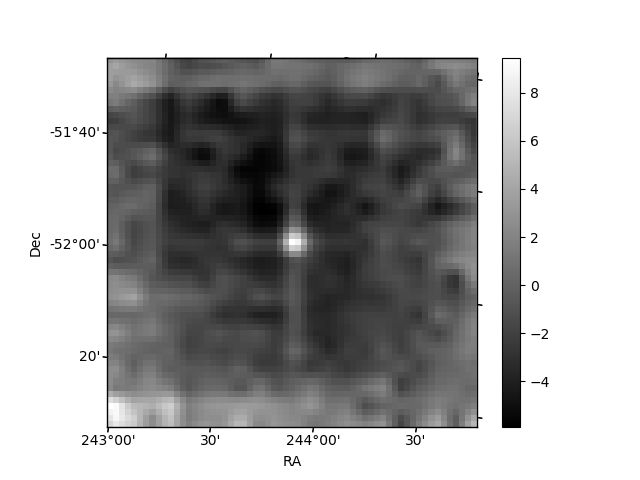
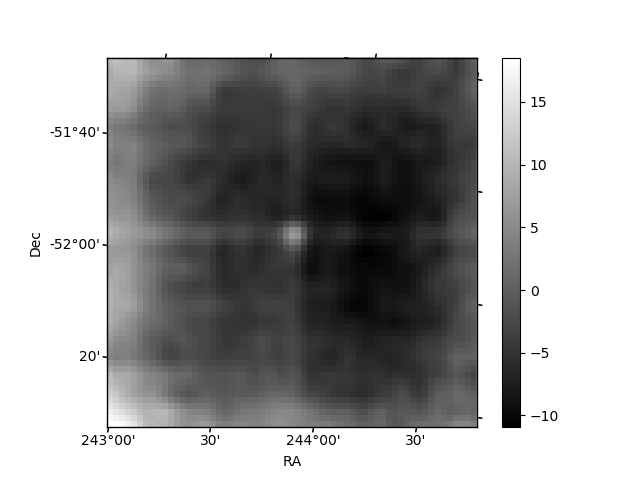
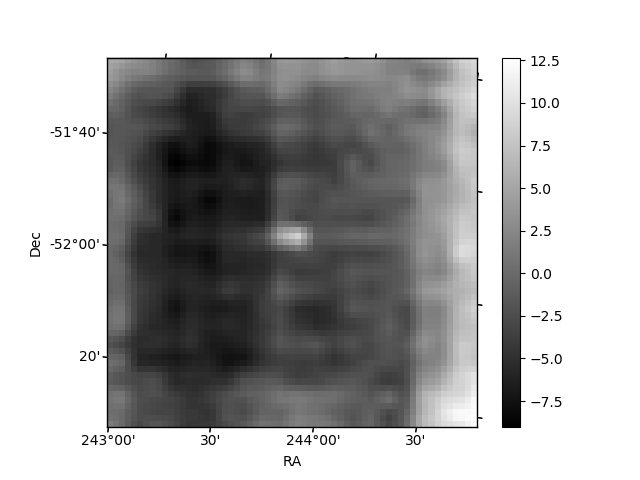
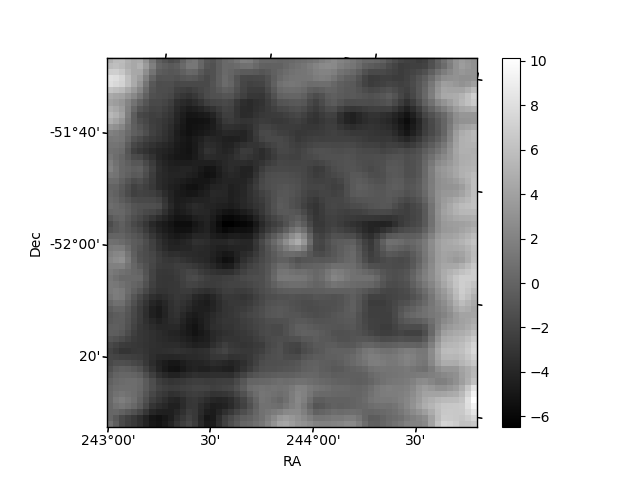
Histogram calculated using DETX and DETY for each event in the final _common_clean file
| Quadrant A | 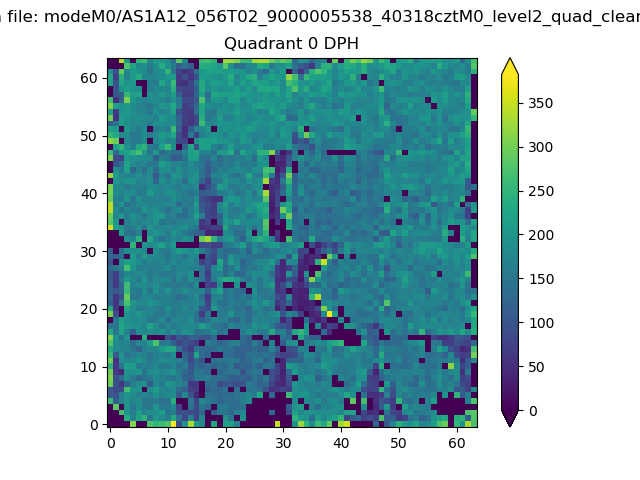 |
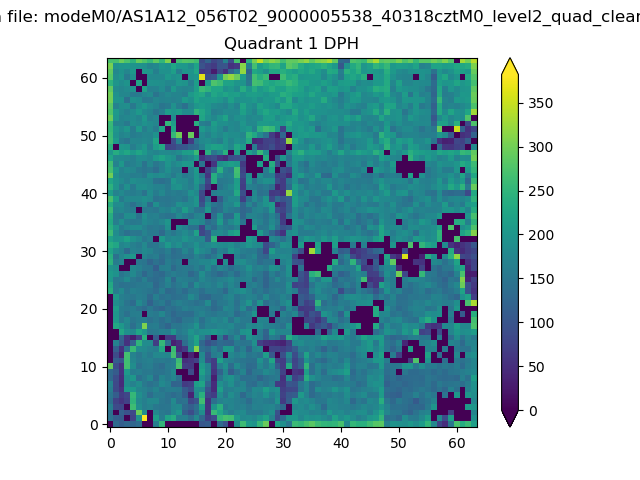 |
Quadrant B |
|---|---|---|---|
| Quadrant D | 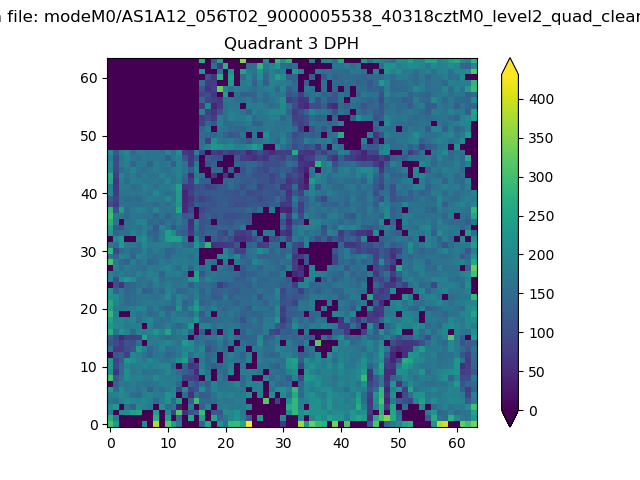 |
 |
Quadrant C |
| Plot type | Count rate plots | Images |
|---|---|---|
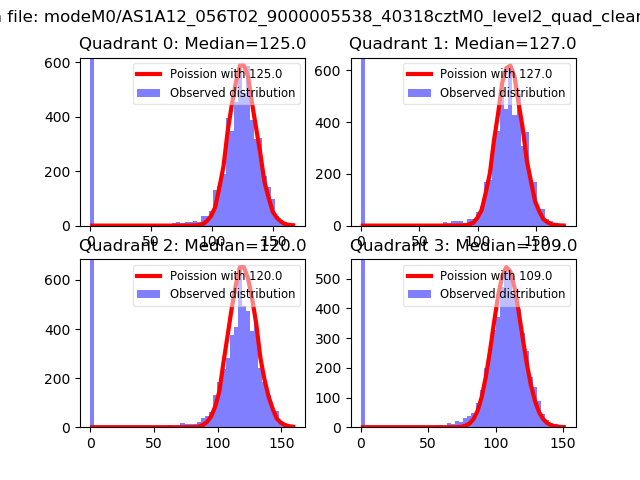
| Comparison with Poisson distribution Blue bars denote a histogram of data divided into 1 sec bins. Red curve is a Poisson curve with rate = median count rate of data. |
 |
 |
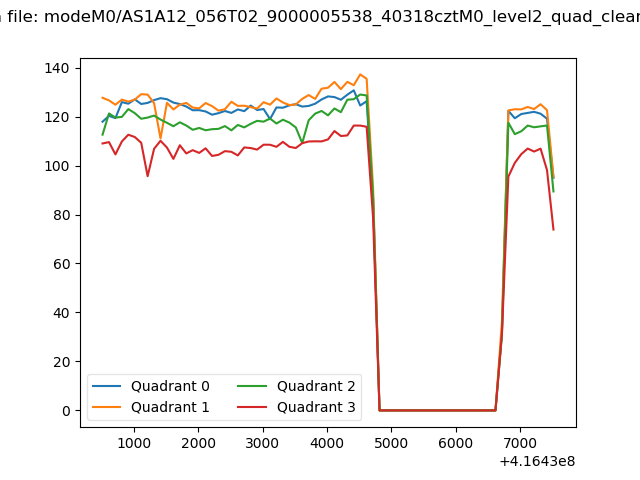
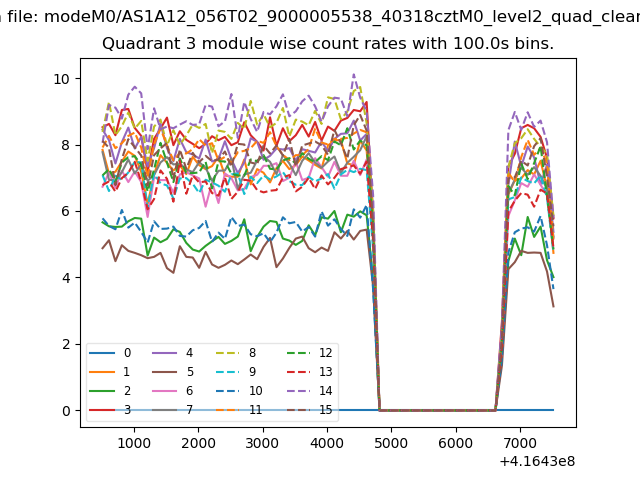
| Quadrant-wise count rates Data is divided into 100 sec bins |
 |
|
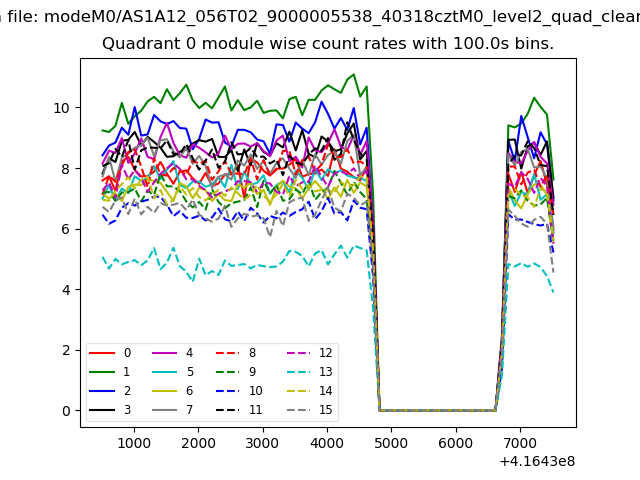
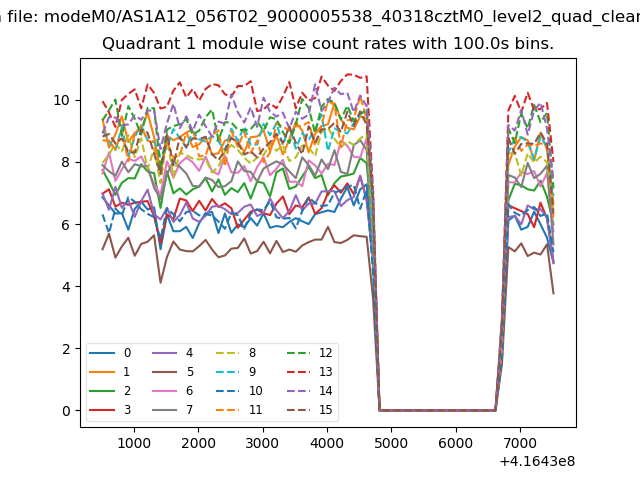
| Module-wise count rates for Quadrant A Data is divided into 100 sec bins |
 |
 |
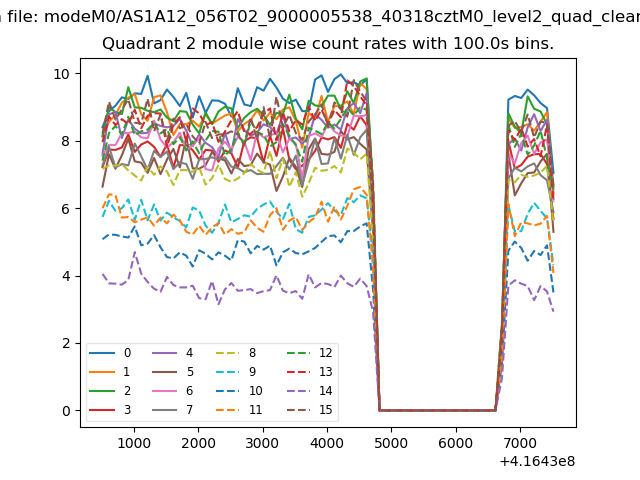
| Module-wise count rates for Quadrant B Data is divided into 100 sec bins |
 |
 |
| Module-wise count rates for Quadrant C Data is divided into 100 sec bins |
 |
 |
| Module-wise count rates for Quadrant D Data is divided into 100 sec bins |
 |
 |
| Parameter | Plot |
|---|---|
| CZT HV Monitor | 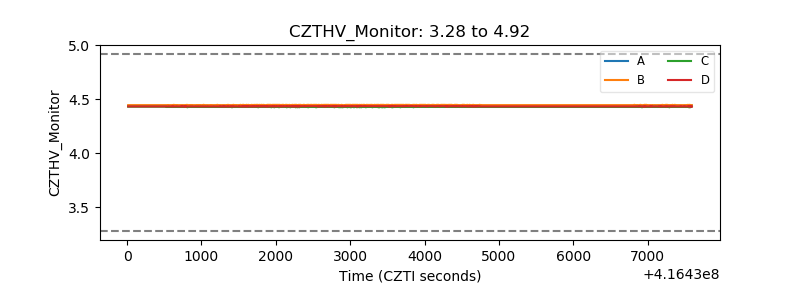 |
| D_VDD |  |
| Temperature 1 | 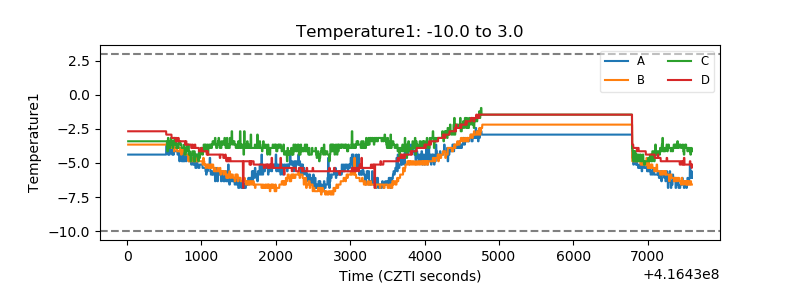 |
| Veto HV Monitor | 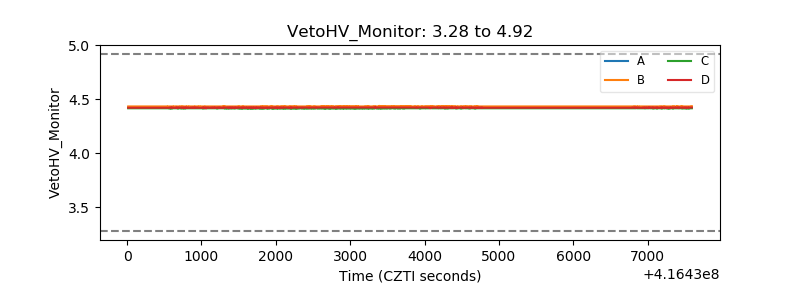 |
| Veto LLD | 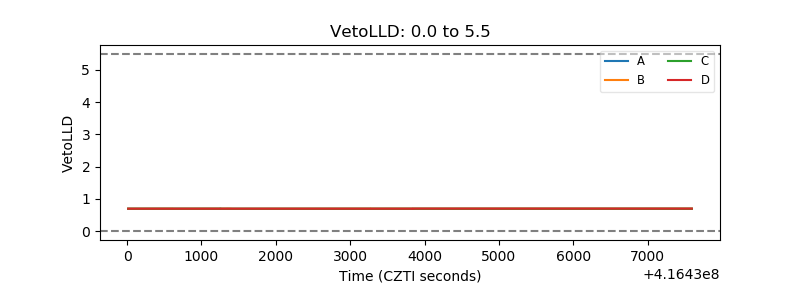 |
| Alpha Counter | 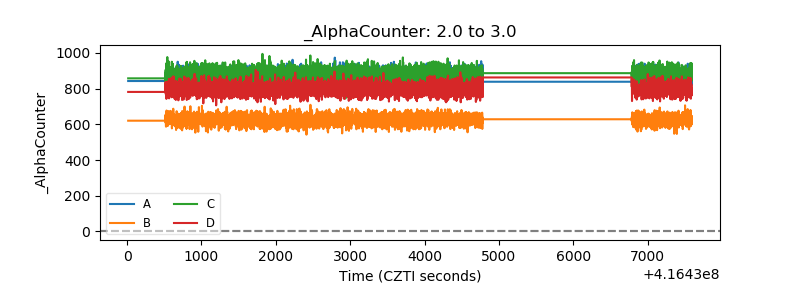 |
| _CPM_Rate |  |
| CZT Counter | 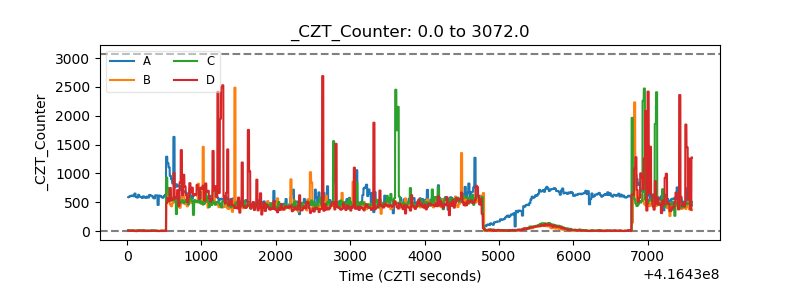 |
| +2.5 Volts monitor | 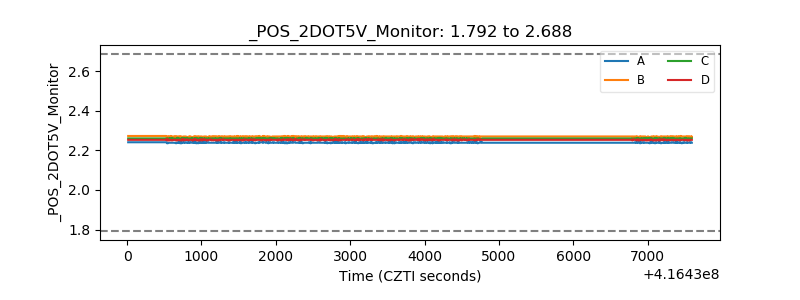 |
| +5 Volts monitor | 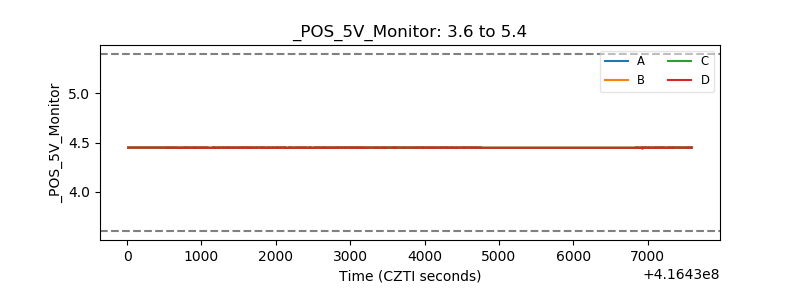 |
| _ROLL_ROT | 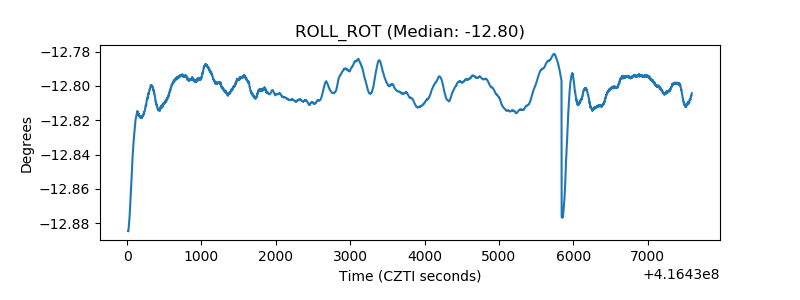 |
| _Roll_DEC | 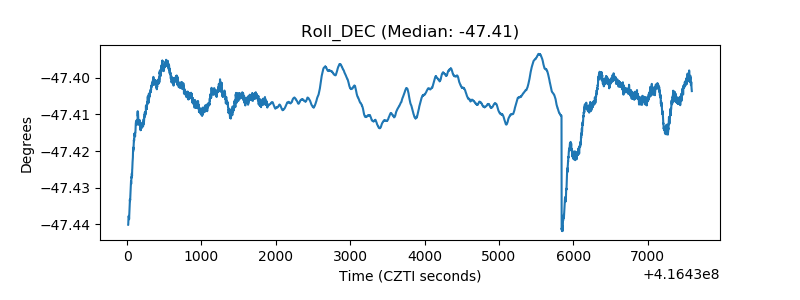 |
| _Roll_RA | 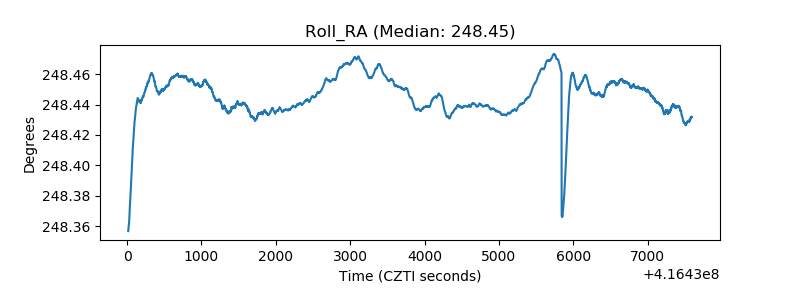 |
| Veto Counter | 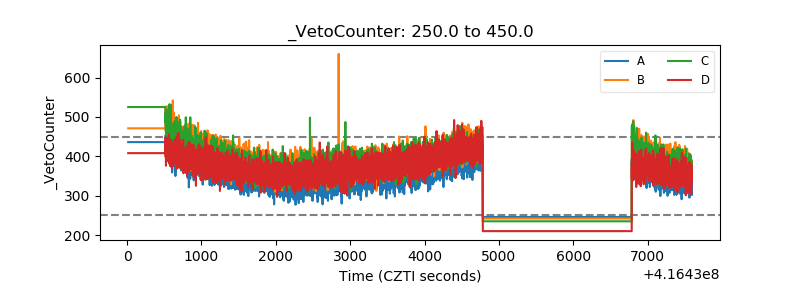 |