| Param | Original file | Final file |
|---|---|---|
| Filename | modeM0/AS1A12_056T02_9000005538_40319cztM0_level2.fits | modeM0/AS1A12_056T02_9000005538_40319cztM0_level2_quad_clean.evt |
| Size (bytes) | 367,669,440 | 92,851,200 |
| Size | 350.6 MB | 88.5 MB |
| Events in quadrant A | 3,089,269 | 636,817 |
| Events in quadrant B | 2,613,505 | 655,688 |
| Events in quadrant C | 3,700,497 | 592,968 |
| Events in quadrant D | 3,787,962 | 549,468 |
| Mode M0 | |||
|---|---|---|---|
| Quadrant | BADHDUFLAG | Total packets | Discarded packets |
| A | 0 | 12456 | 3 |
| B | 0 | 11376 | 2 |
| C | 0 | 14447 | 2 |
| D | 0 | 15167 | 2 |
| Mode M9 | |||
|---|---|---|---|
| Quadrant | BADHDUFLAG | Total packets | Discarded packets |
| A | 0 | 22 | 0 |
| B | 0 | 22 | 0 |
| C | 0 | 22 | 0 |
| D | 0 | 23 | 0 |
| Mode SS | |||
|---|---|---|---|
| Quadrant | BADHDUFLAG | Total packets | Discarded packets |
| A | 0 | 110 | 0 |
| B | 0 | 110 | 0 |
| C | 0 | 110 | 0 |
| D | 0 | 110 | 0 |
| Quadrant | Total seconds | Saturated seconds | Saturation percentage |
|---|---|---|---|
| A | 5380 | 64 | 1.189591% |
| B | 5380 | 38 | 0.706320% |
| C | 5380 | 296 | 5.501859% |
| D | 5380 | 265 | 4.925651% |
Noise dominated data is calculated using 1-second bins in cleaned event files. If a bin has >2000 counts, and if more than 50% of those come from <1% of pixels, then it is considered to be noise-dominated and hence unusable.
| Quadrant | # 1 sec bins | Bins with >0 counts | Bins with >2000 counts | High rate bins dominated by noise | Noise dominated (total time) | Noise dominated (detector-on time) | Marked lightcurve |
|---|---|---|---|---|---|---|---|
| A | 7113 | 5381 | 47 | 47 | 0.66% | 0.87% | 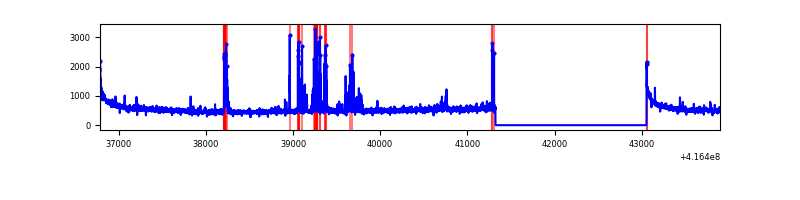 |
| B | 7113 | 5381 | 26 | 26 | 0.37% | 0.48% | 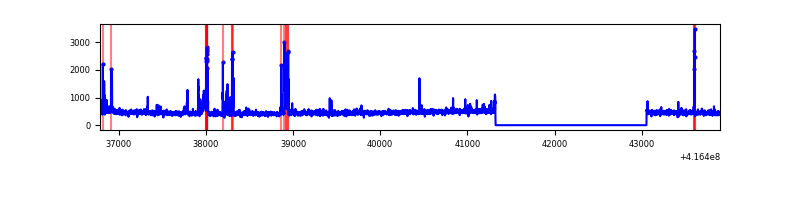 |
| C | 7113 | 5381 | 291 | 291 | 4.09% | 5.41% | 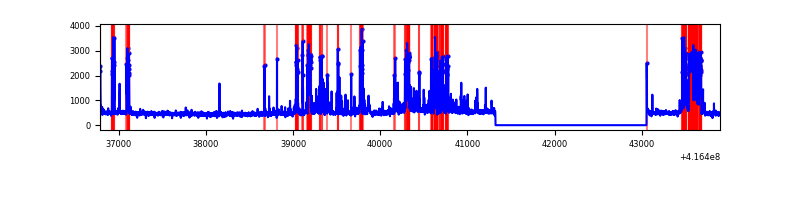 |
| D | 7113 | 5381 | 248 | 248 | 3.49% | 4.61% | 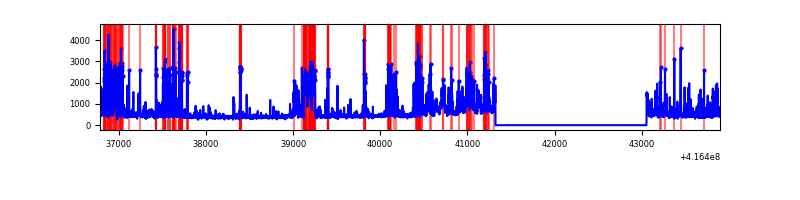 |
Top three noisy pixels from each quadrant. If the there are fewer than three noisy pixels in the level2.evt file, extra rows are filled as -1
| Pixel properties | Quadrant properties | ||||||
|---|---|---|---|---|---|---|---|
| Quadrant | DetID | PixID | Counts | Sigma | Mean | Median | Sigma |
| A | 10 | 83 | 466233 | 3786.07 | 599 | 589 | 123.0 |
| A | 13 | 248 | 171778 | 1391.91 | 599 | 589 | 123.0 |
| A | 14 | 250 | 61258 | 493.29 | 599 | 589 | 123.0 |
| B | 5 | 255 | 158656 | 1364.68 | 600 | 584 | 115.8 |
| B | 4 | 170 | 51034 | 435.55 | 600 | 584 | 115.8 |
| B | 0 | 229 | 19562 | 163.84 | 600 | 584 | 115.8 |
| C | 14 | 254 | 1190972 | 8780.6 | 575 | 580 | 135.6 |
| C | 15 | 214 | 224350 | 1650.57 | 575 | 580 | 135.6 |
| C | 0 | 10 | 19386 | 138.71 | 575 | 580 | 135.6 |
| D | 12 | 227 | 1019581 | 7166.38 | 574 | 559 | 142.2 |
| D | 2 | 250 | 124455 | 871.31 | 574 | 559 | 142.2 |
| D | 13 | 249 | 124320 | 870.36 | 574 | 559 | 142.2 |
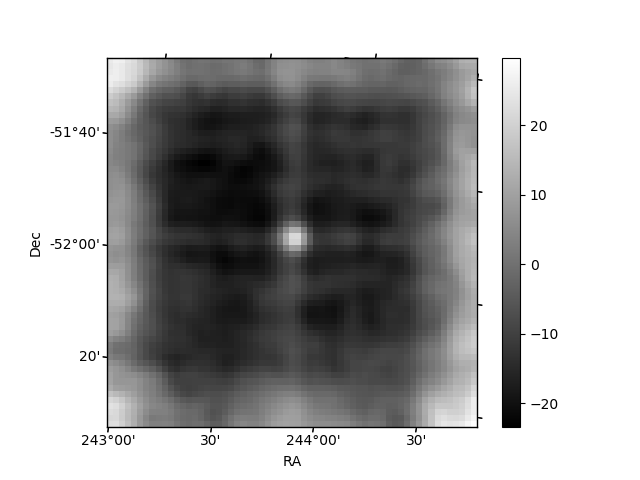
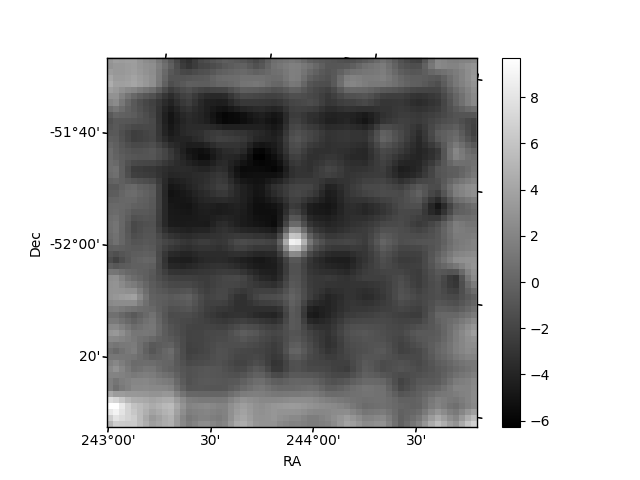
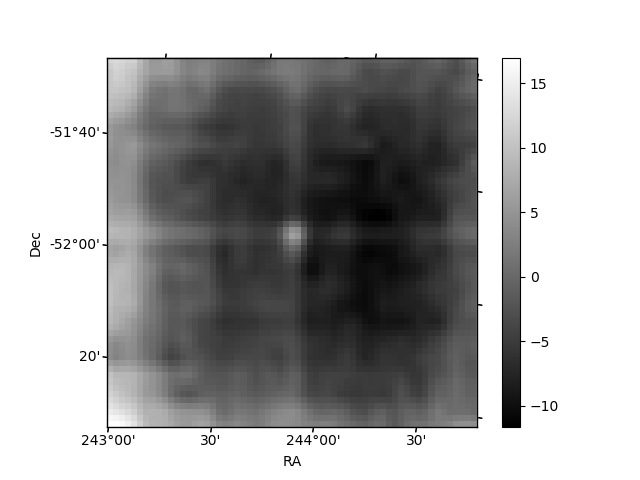
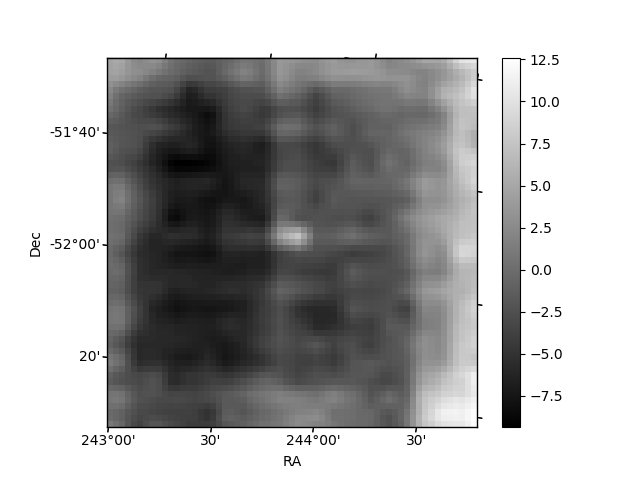
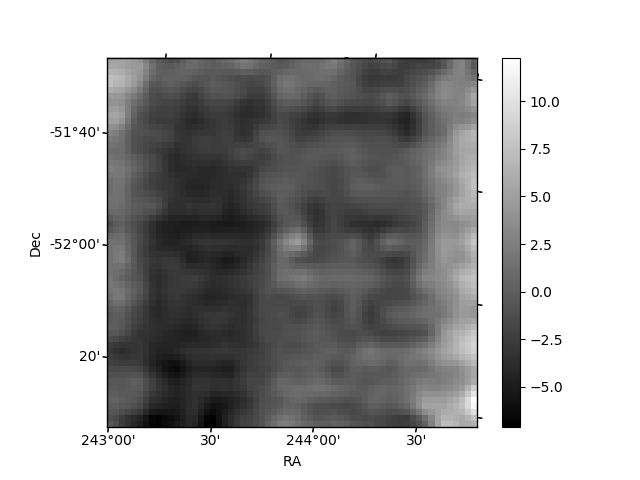
Histogram calculated using DETX and DETY for each event in the final _common_clean file
| Quadrant A | 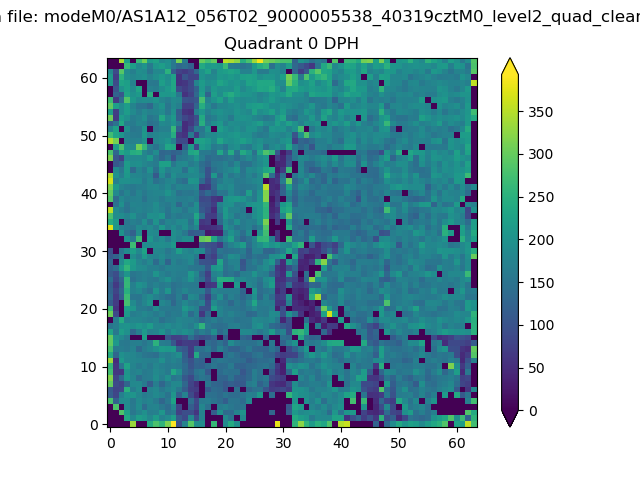 |
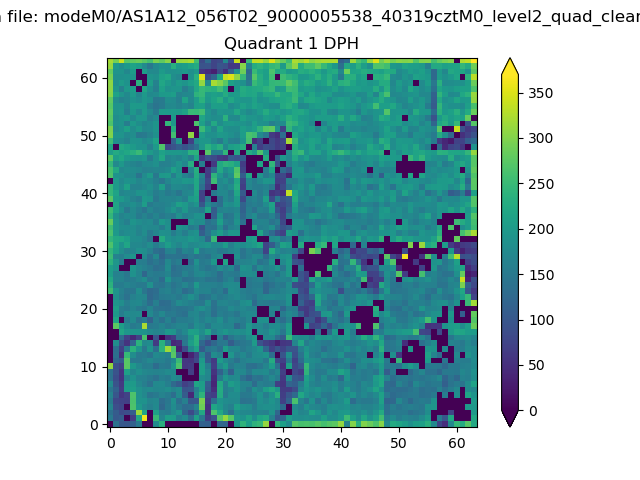 |
Quadrant B |
|---|---|---|---|
| Quadrant D | 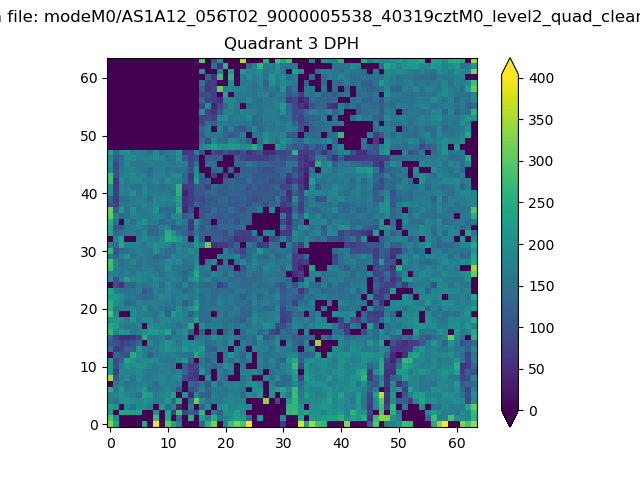 |
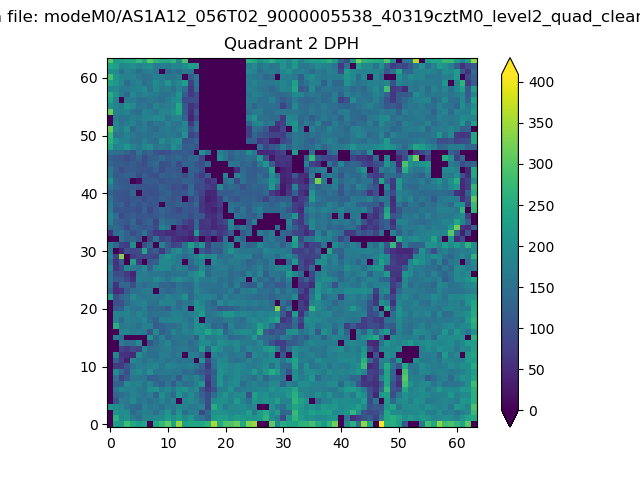 |
Quadrant C |
| Plot type | Count rate plots | Images |
|---|---|---|
| Comparison with Poisson distribution Blue bars denote a histogram of data divided into 1 sec bins. Red curve is a Poisson curve with rate = median count rate of data. |
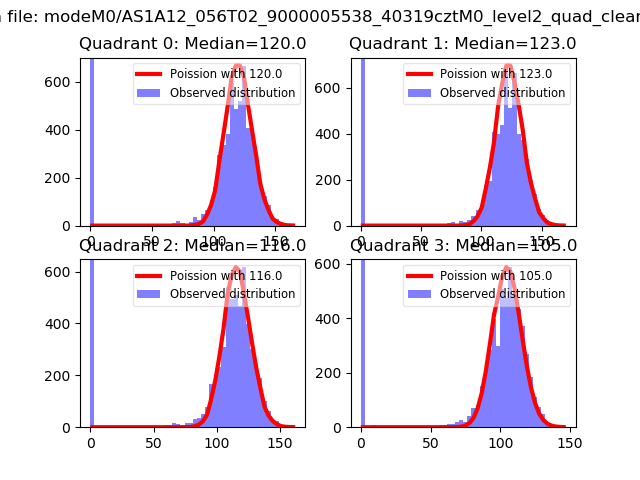 |
 |
| Quadrant-wise count rates Data is divided into 100 sec bins |
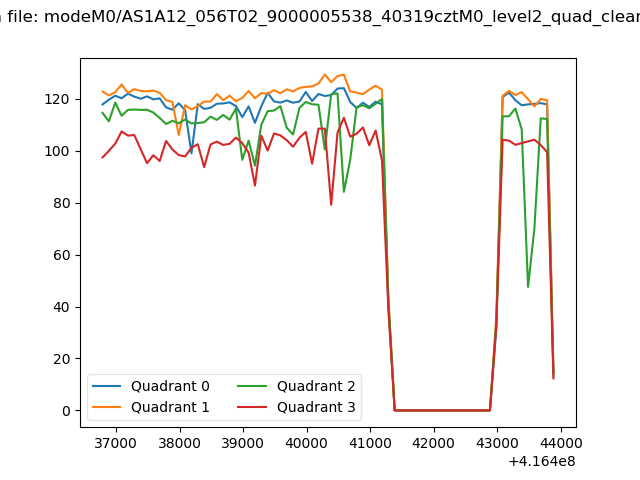 |
|
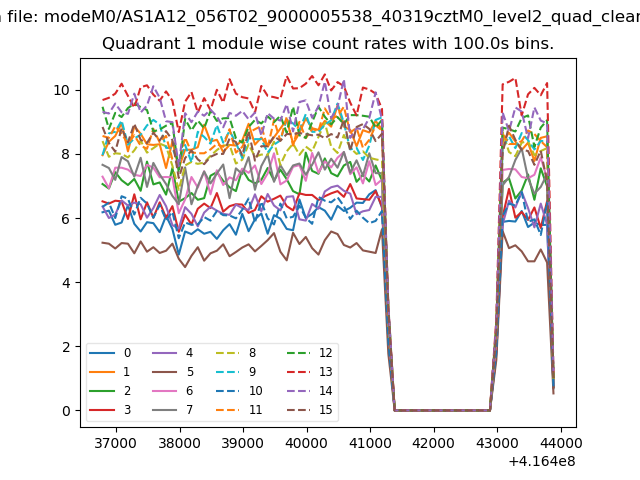
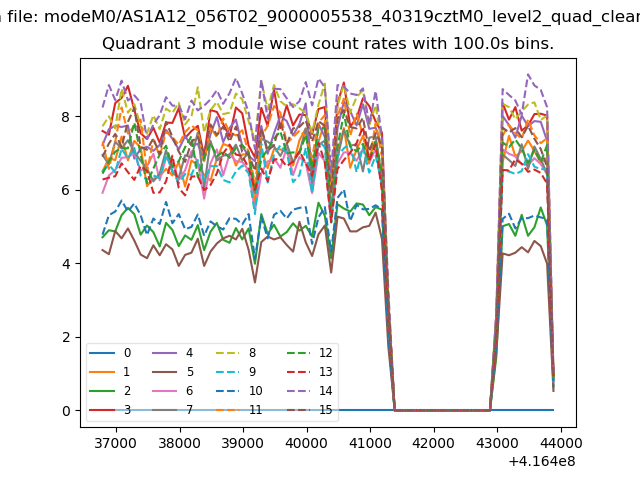
| Module-wise count rates for Quadrant A Data is divided into 100 sec bins |
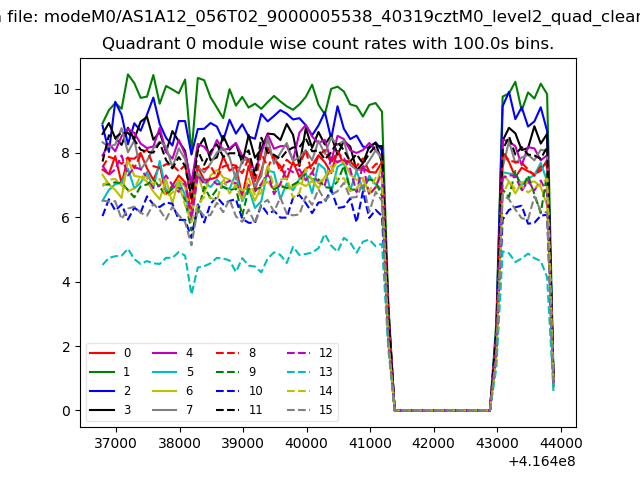 |
 |
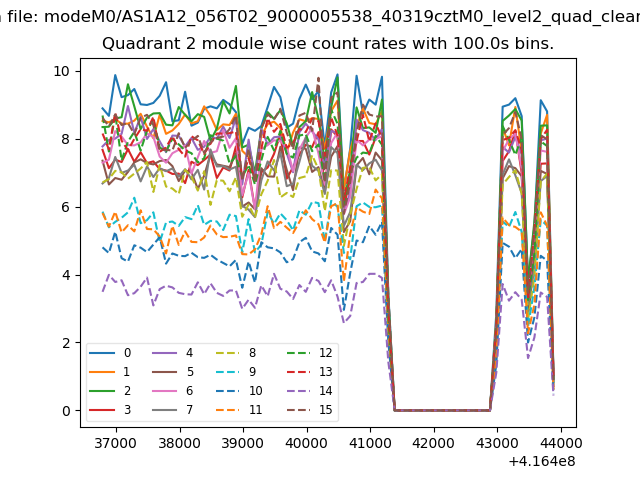
| Module-wise count rates for Quadrant B Data is divided into 100 sec bins |
 |
 |
| Module-wise count rates for Quadrant C Data is divided into 100 sec bins |
 |
 |
| Module-wise count rates for Quadrant D Data is divided into 100 sec bins |
 |
 |
| Parameter | Plot |
|---|---|
| CZT HV Monitor | 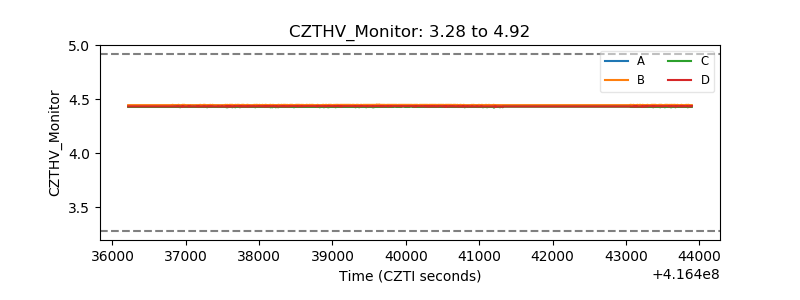 |
| D_VDD | 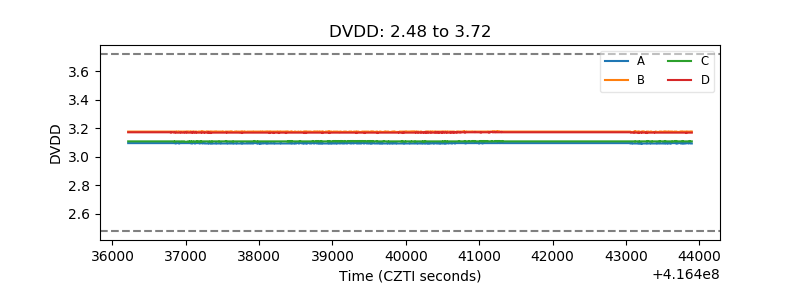 |
| Temperature 1 | 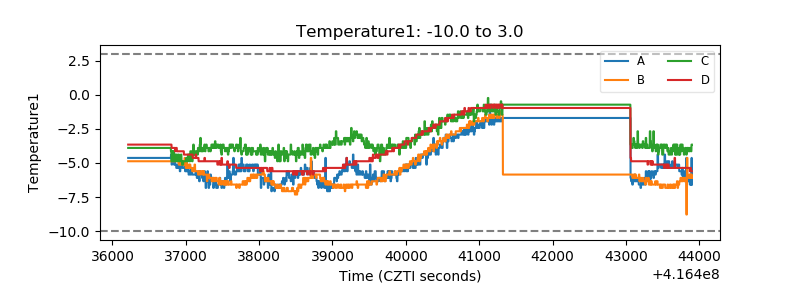 |
| Veto HV Monitor | 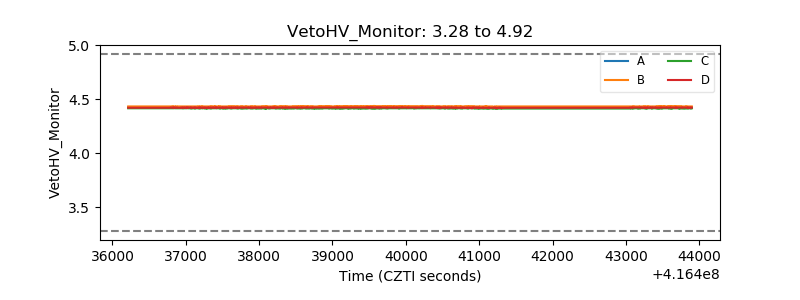 |
| Veto LLD | 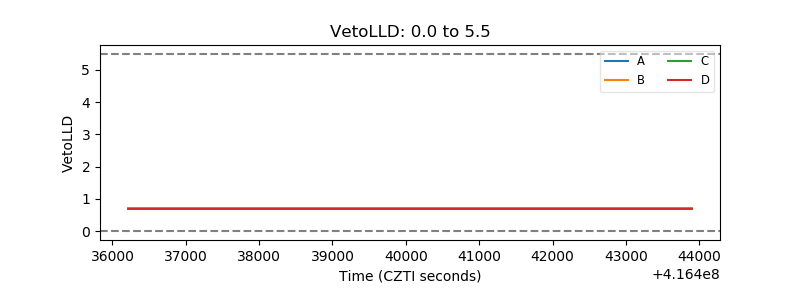 |
| Alpha Counter | 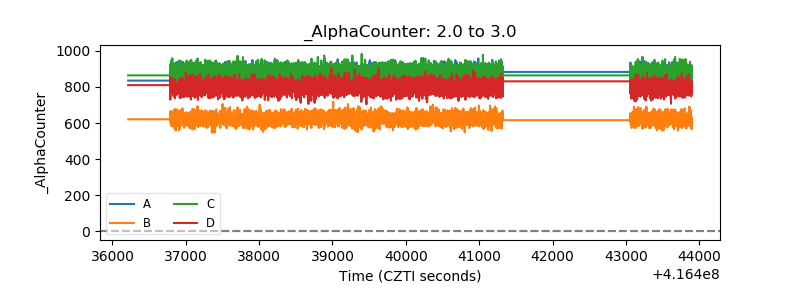 |
| _CPM_Rate | 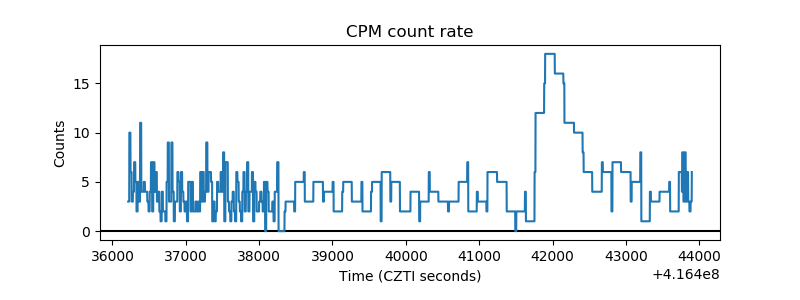 |
| CZT Counter | 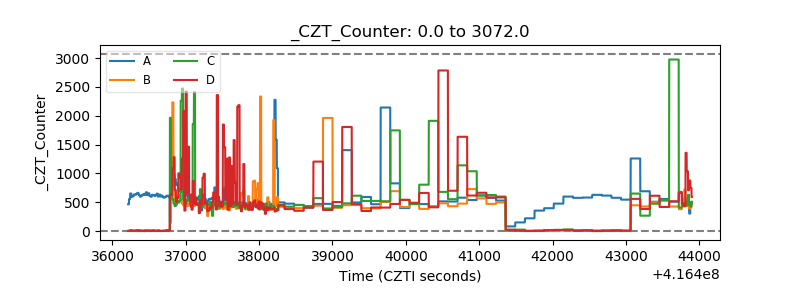 |
| +2.5 Volts monitor | 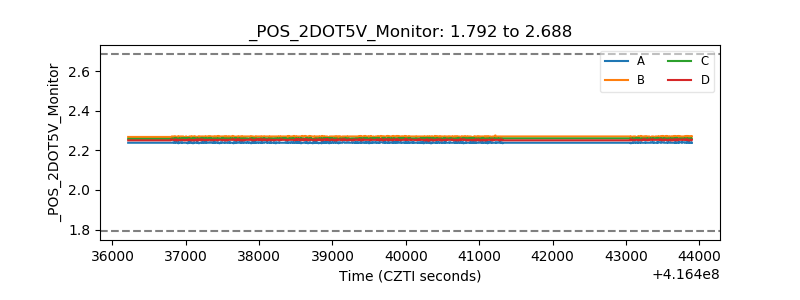 |
| +5 Volts monitor |  |
| _ROLL_ROT | 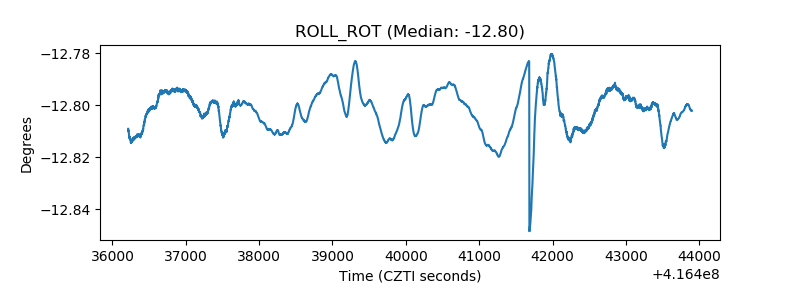 |
| _Roll_DEC | 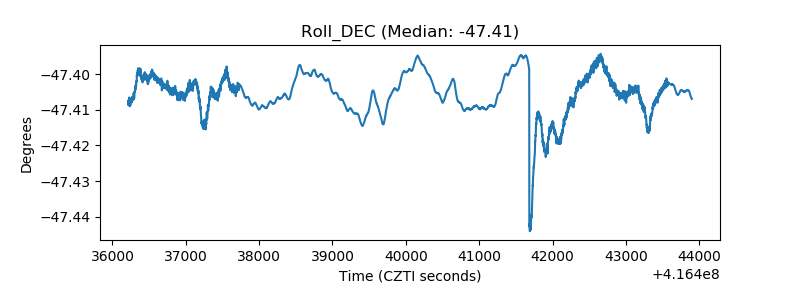 |
| _Roll_RA | 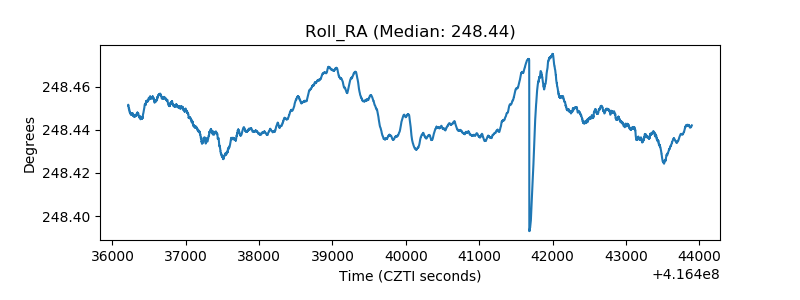 |
| Veto Counter | 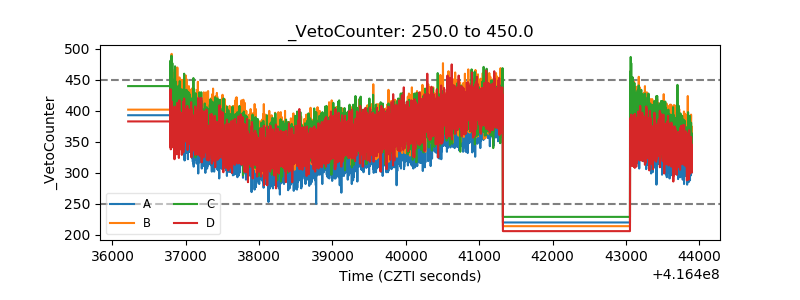 |