| Param | Original file | Final file |
|---|---|---|
| Filename | modeM0/AS1A12_056T02_9000005538_40320cztM0_level2.fits | modeM0/AS1A12_056T02_9000005538_40320cztM0_level2_quad_clean.evt |
| Size (bytes) | 389,088,000 | 98,035,200 |
| Size | 371.1 MB | 93.5 MB |
| Events in quadrant A | 3,408,443 | 669,685 |
| Events in quadrant B | 2,888,110 | 687,304 |
| Events in quadrant C | 3,178,595 | 640,022 |
| Events in quadrant D | 4,479,597 | 568,899 |
| Mode M0 | |||
|---|---|---|---|
| Quadrant | BADHDUFLAG | Total packets | Discarded packets |
| A | 0 | 13798 | 3 |
| B | 0 | 12512 | 2 |
| C | 0 | 12899 | 2 |
| D | 0 | 17414 | 2 |
| Mode M9 | |||
|---|---|---|---|
| Quadrant | BADHDUFLAG | Total packets | Discarded packets |
| A | 0 | 21 | 0 |
| B | 0 | 21 | 0 |
| C | 0 | 21 | 0 |
| D | 0 | 22 | 0 |
| Mode SS | |||
|---|---|---|---|
| Quadrant | BADHDUFLAG | Total packets | Discarded packets |
| A | 0 | 118 | 0 |
| B | 0 | 118 | 0 |
| C | 0 | 118 | 0 |
| D | 0 | 118 | 0 |
| Quadrant | Total seconds | Saturated seconds | Saturation percentage |
|---|---|---|---|
| A | 5757 | 56 | 0.972729% |
| B | 5757 | 23 | 0.399514% |
| C | 5757 | 134 | 2.327601% |
| D | 5757 | 385 | 6.687511% |
Noise dominated data is calculated using 1-second bins in cleaned event files. If a bin has >2000 counts, and if more than 50% of those come from <1% of pixels, then it is considered to be noise-dominated and hence unusable.
| Quadrant | # 1 sec bins | Bins with >0 counts | Bins with >2000 counts | High rate bins dominated by noise | Noise dominated (total time) | Noise dominated (detector-on time) | Marked lightcurve |
|---|---|---|---|---|---|---|---|
| A | 7160 | 5758 | 38 | 38 | 0.53% | 0.66% | 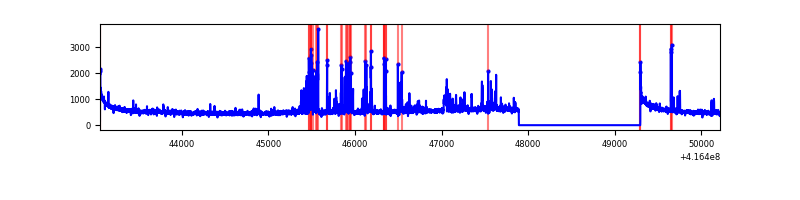 |
| B | 7160 | 5758 | 8 | 8 | 0.11% | 0.14% | 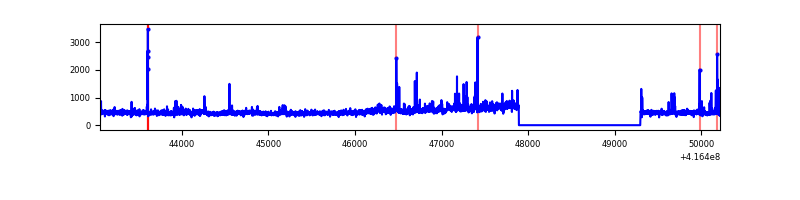 |
| C | 7160 | 5758 | 132 | 132 | 1.84% | 2.29% | 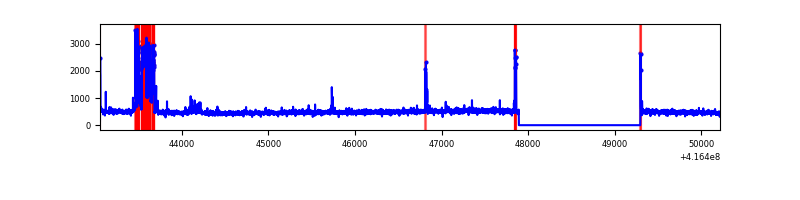 |
| D | 7160 | 5758 | 353 | 353 | 4.93% | 6.13% | 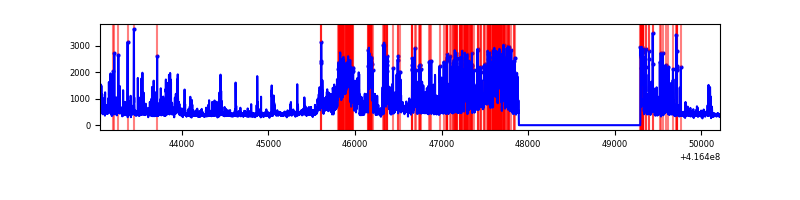 |
Top three noisy pixels from each quadrant. If the there are fewer than three noisy pixels in the level2.evt file, extra rows are filled as -1
| Pixel properties | Quadrant properties | ||||||
|---|---|---|---|---|---|---|---|
| Quadrant | DetID | PixID | Counts | Sigma | Mean | Median | Sigma |
| A | 10 | 83 | 498880 | 3762.88 | 643 | 631 | 132.4 |
| A | 13 | 248 | 248800 | 1874.23 | 643 | 631 | 132.4 |
| A | 6 | 10 | 79172 | 593.16 | 643 | 631 | 132.4 |
| B | 7 | 202 | 116674 | 929.79 | 643 | 626 | 124.8 |
| B | 0 | 245 | 68744 | 545.77 | 643 | 626 | 124.8 |
| B | 5 | 255 | 49173 | 388.96 | 643 | 626 | 124.8 |
| C | 14 | 254 | 452848 | 3092.98 | 627 | 631 | 146.2 |
| C | 15 | 214 | 243714 | 1662.59 | 627 | 631 | 146.2 |
| C | 0 | 10 | 19701 | 130.43 | 627 | 631 | 146.2 |
| D | 12 | 227 | 1091379 | 7138.74 | 615 | 598 | 152.8 |
| D | 12 | 233 | 501933 | 3281.05 | 615 | 598 | 152.8 |
| D | 1 | 47 | 127727 | 832.01 | 615 | 598 | 152.8 |
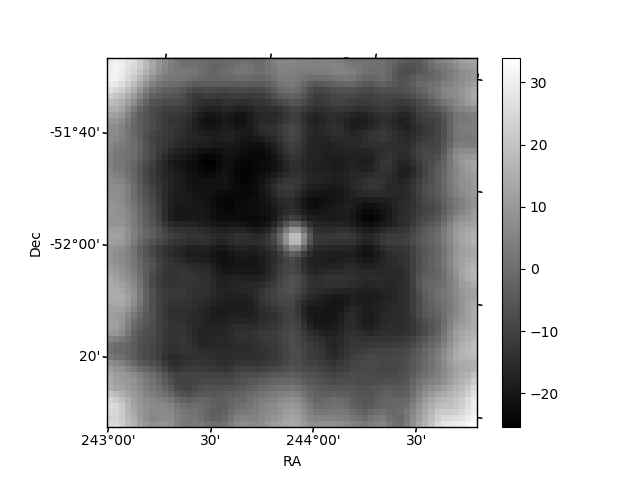
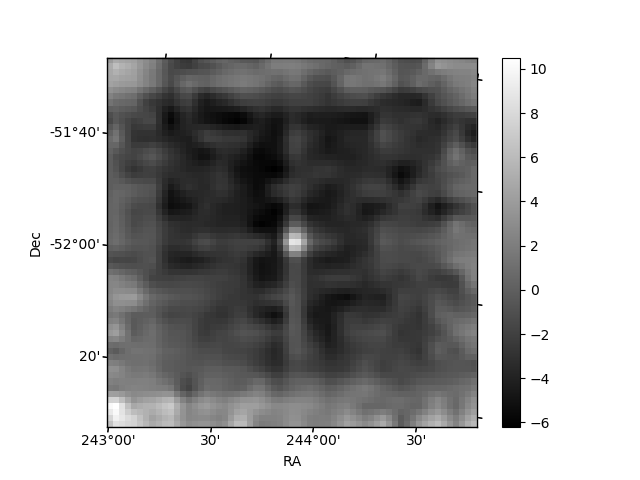
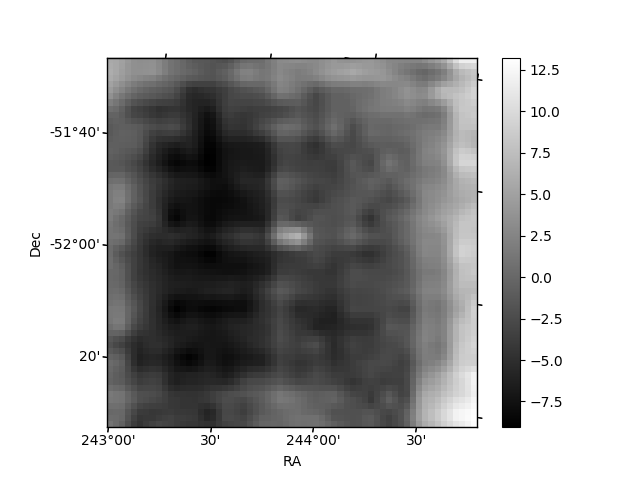
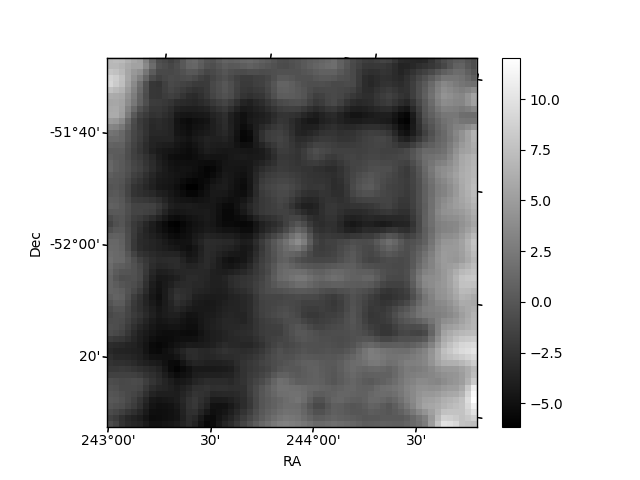
Histogram calculated using DETX and DETY for each event in the final _common_clean file
| Quadrant A | 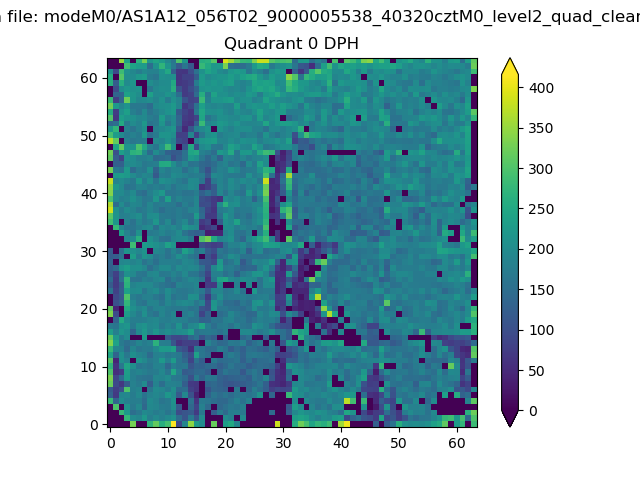 |
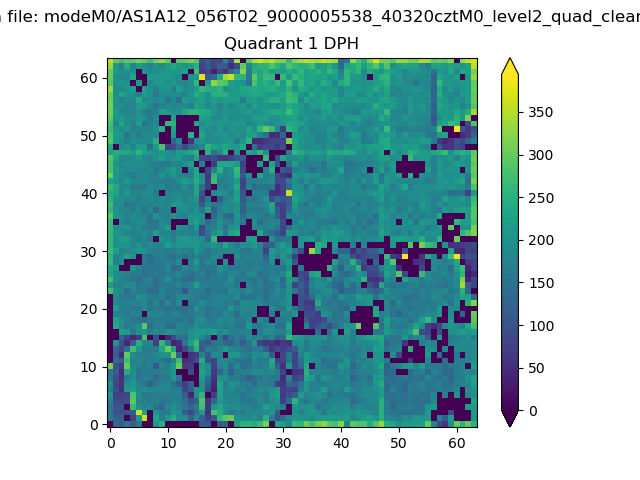 |
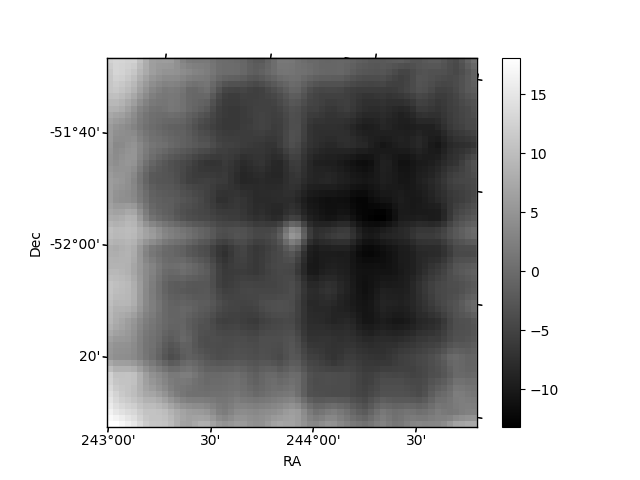
Quadrant B |
|---|---|---|---|
| Quadrant D | 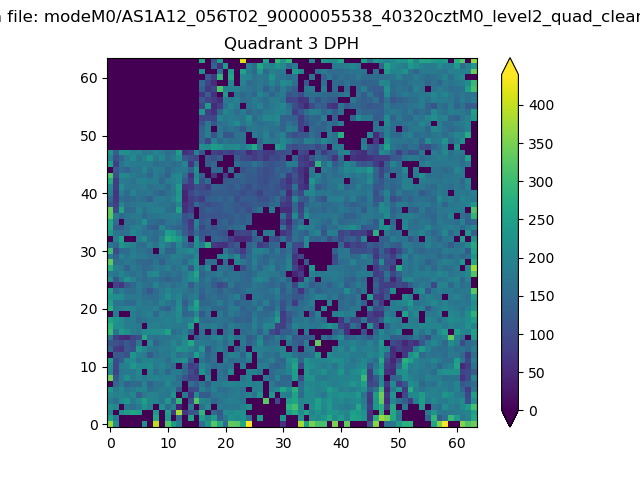 |
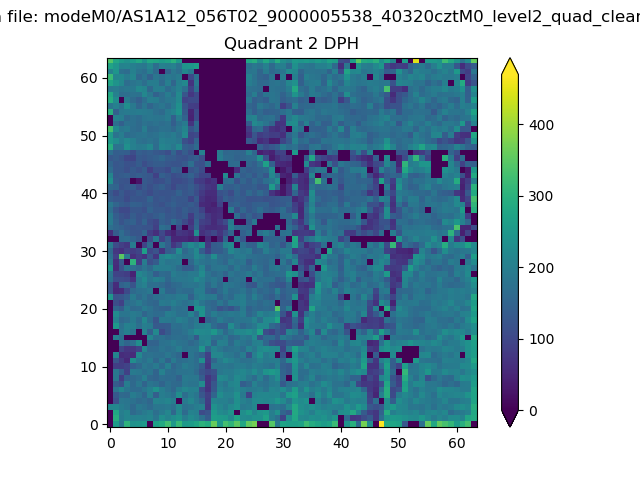 |
Quadrant C |
| Plot type | Count rate plots | Images |
|---|---|---|
| Comparison with Poisson distribution Blue bars denote a histogram of data divided into 1 sec bins. Red curve is a Poisson curve with rate = median count rate of data. |
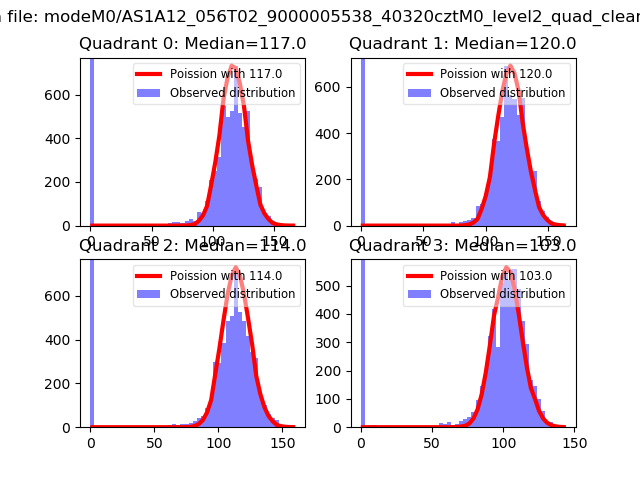 |
 |
| Quadrant-wise count rates Data is divided into 100 sec bins |
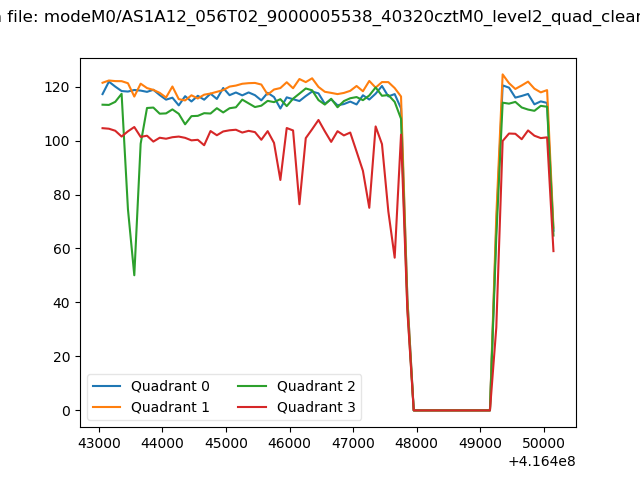 |
|
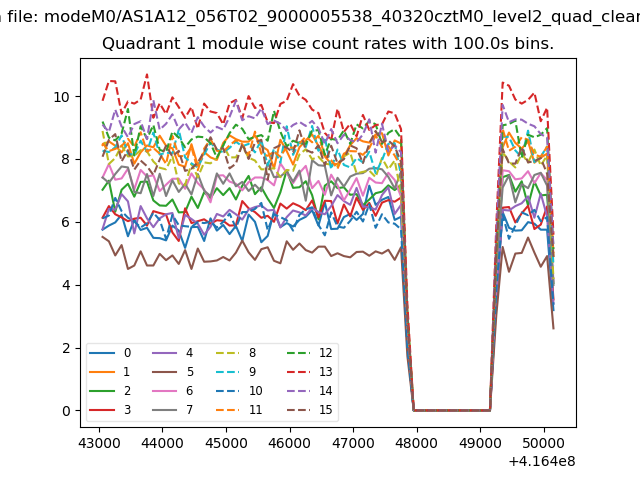
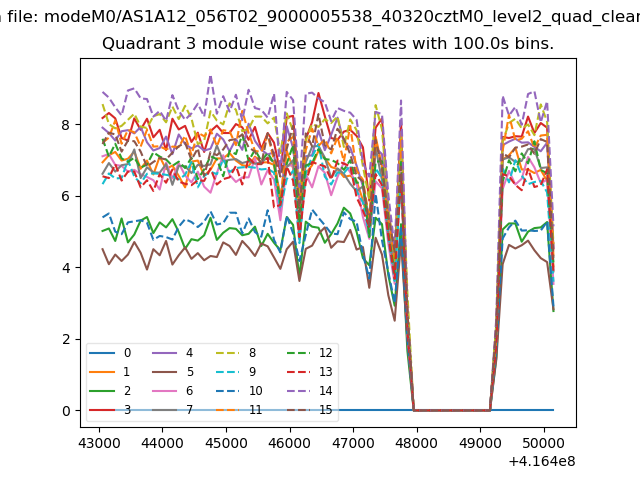
| Module-wise count rates for Quadrant A Data is divided into 100 sec bins |
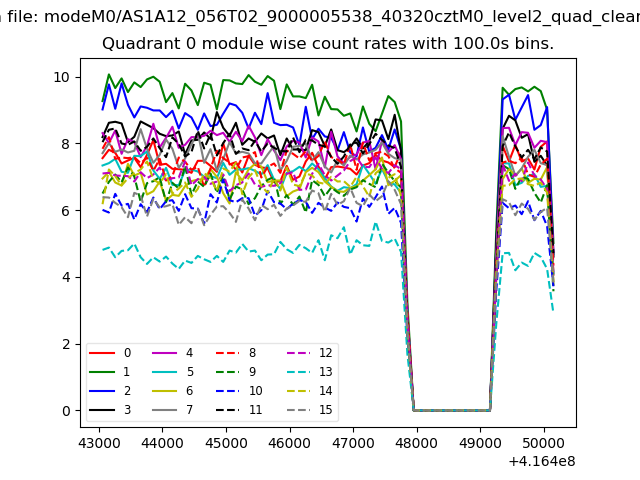 |
 |
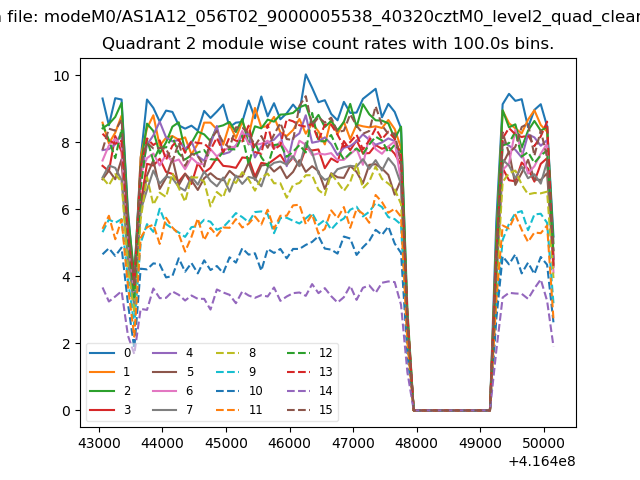
| Module-wise count rates for Quadrant B Data is divided into 100 sec bins |
 |
 |
| Module-wise count rates for Quadrant C Data is divided into 100 sec bins |
 |
 |
| Module-wise count rates for Quadrant D Data is divided into 100 sec bins |
 |
 |
| Parameter | Plot |
|---|---|
| CZT HV Monitor | 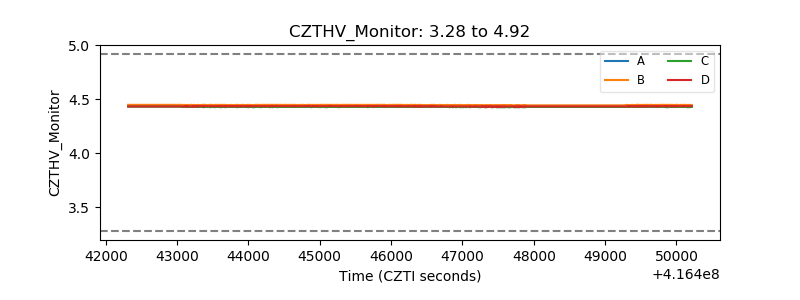 |
| D_VDD | 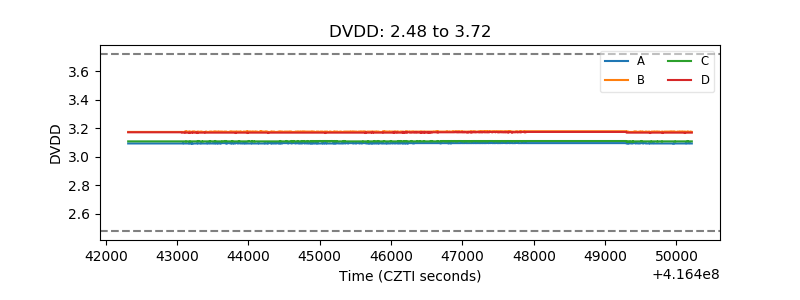 |
| Temperature 1 | 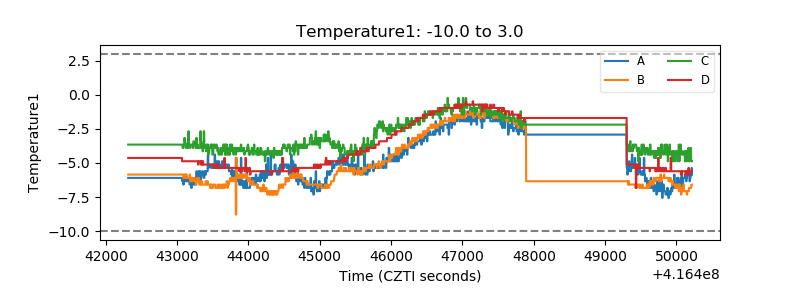 |
| Veto HV Monitor | 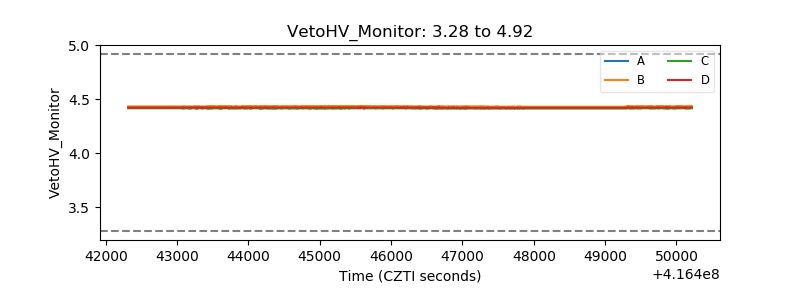 |
| Veto LLD | 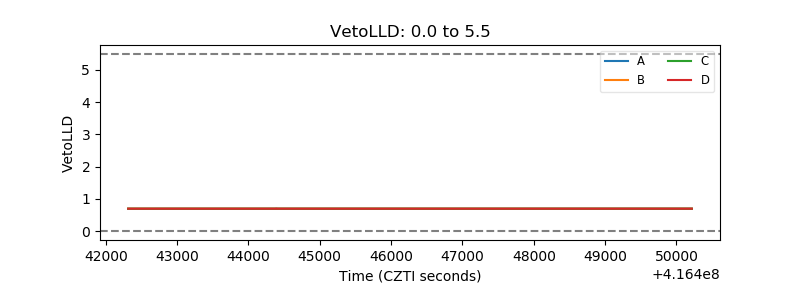 |
| Alpha Counter | 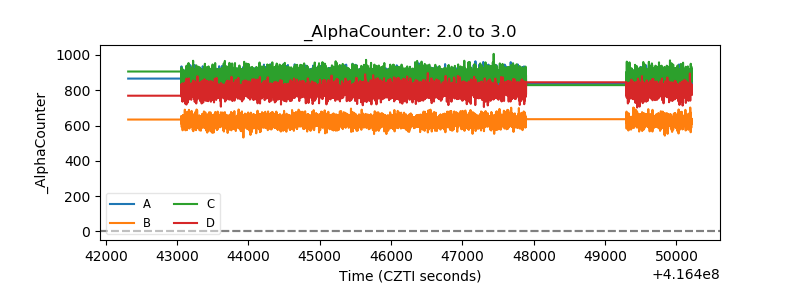 |
| _CPM_Rate | 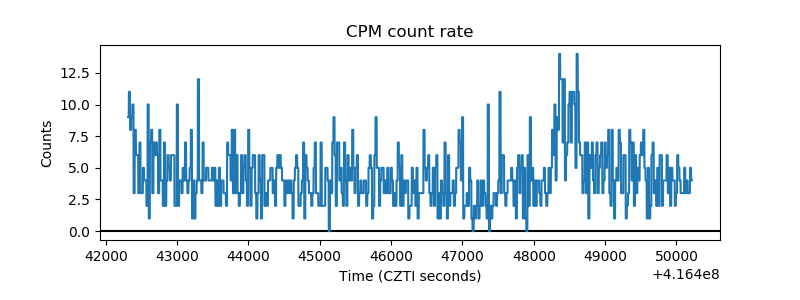 |
| CZT Counter | 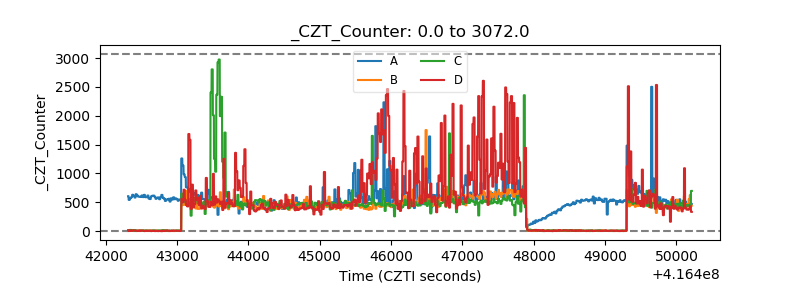 |
| +2.5 Volts monitor | 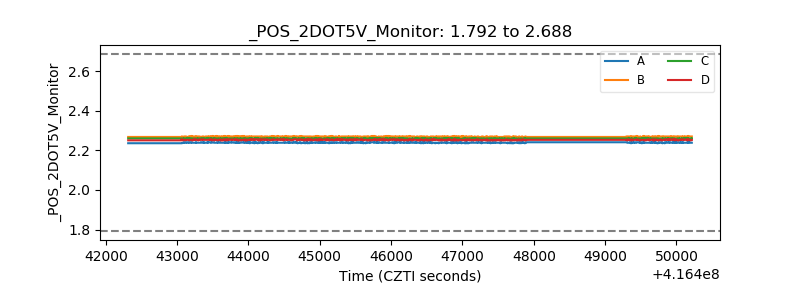 |
| +5 Volts monitor | 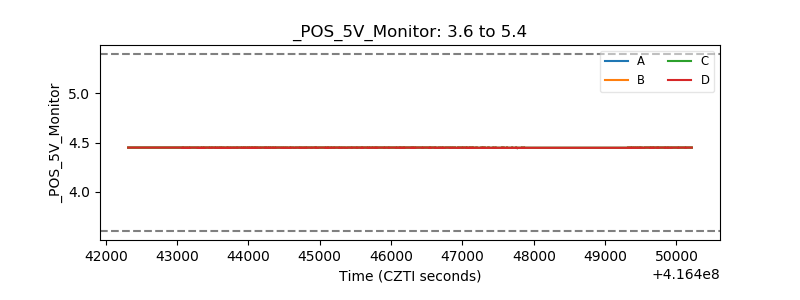 |
| _ROLL_ROT | 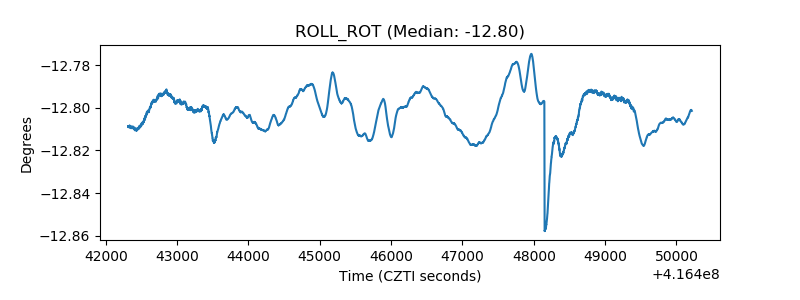 |
| _Roll_DEC | 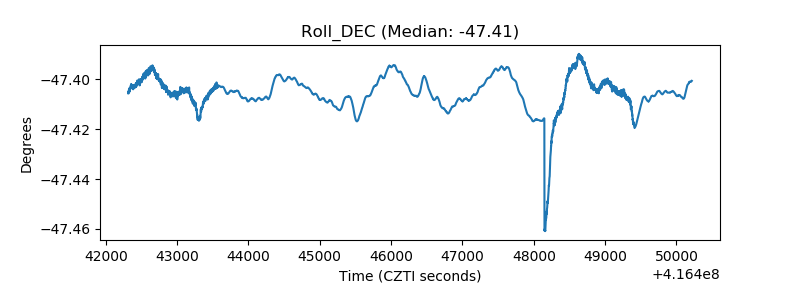 |
| _Roll_RA | 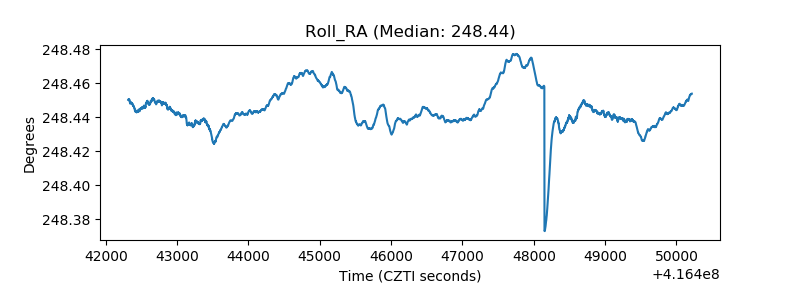 |
| Veto Counter | 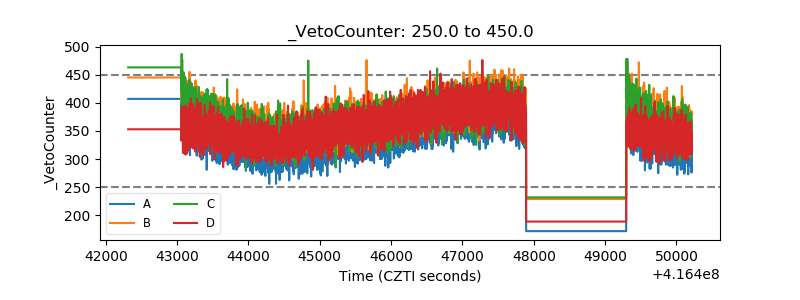 |