| Param | Original file | Final file |
|---|---|---|
| Filename | modeM0/AS1A12_056T02_9000005538_40325cztM0_level2.fits | modeM0/AS1A12_056T02_9000005538_40325cztM0_level2_quad_clean.evt |
| Size (bytes) | 467,910,720 | 112,259,520 |
| Size | 446.2 MB | 107.1 MB |
| Events in quadrant A | 3,905,119 | 765,344 |
| Events in quadrant B | 3,475,457 | 788,967 |
| Events in quadrant C | 3,345,504 | 754,947 |
| Events in quadrant D | 6,070,551 | 619,714 |
| Mode M0 | |||
|---|---|---|---|
| Quadrant | BADHDUFLAG | Total packets | Discarded packets |
| A | 0 | 15777 | 7 |
| B | 0 | 14759 | 3 |
| C | 0 | 14088 | 2 |
| D | 0 | 22743 | 2 |
| Mode M9 | |||
|---|---|---|---|
| Quadrant | BADHDUFLAG | Total packets | Discarded packets |
| A | 0 | 23 | 0 |
| B | 0 | 23 | 0 |
| C | 0 | 23 | 0 |
| D | 0 | 24 | 0 |
| Mode SS | |||
|---|---|---|---|
| Quadrant | BADHDUFLAG | Total packets | Discarded packets |
| A | 0 | 138 | 0 |
| B | 0 | 138 | 0 |
| C | 0 | 138 | 0 |
| D | 0 | 138 | 0 |
| Quadrant | Total seconds | Saturated seconds | Saturation percentage |
|---|---|---|---|
| A | 6740 | 90 | 1.335312% |
| B | 6741 | 37 | 0.548880% |
| C | 6742 | 26 | 0.385642% |
| D | 6742 | 856 | 12.696529% |
Noise dominated data is calculated using 1-second bins in cleaned event files. If a bin has >2000 counts, and if more than 50% of those come from <1% of pixels, then it is considered to be noise-dominated and hence unusable.
| Quadrant | # 1 sec bins | Bins with >0 counts | Bins with >2000 counts | High rate bins dominated by noise | Noise dominated (total time) | Noise dominated (detector-on time) | Marked lightcurve |
|---|---|---|---|---|---|---|---|
| A | 8025 | 6742 | 60 | 60 | 0.75% | 0.89% | 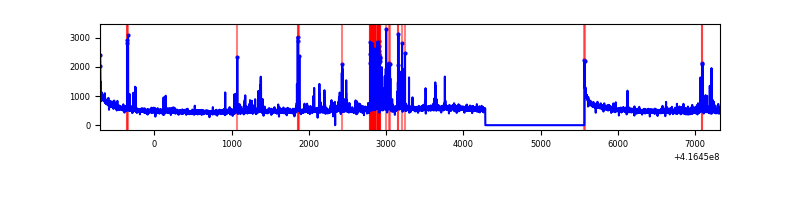 |
| B | 8025 | 6743 | 21 | 21 | 0.26% | 0.31% | 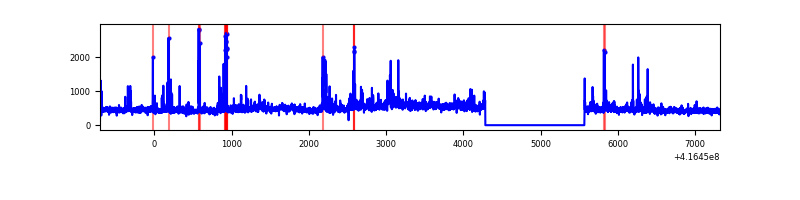 |
| C | 8025 | 6743 | 18 | 18 | 0.22% | 0.27% | 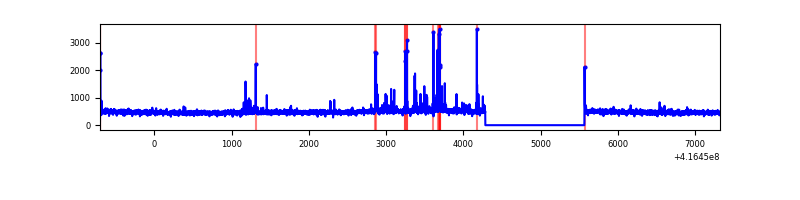 |
| D | 8024 | 6742 | 867 | 867 | 10.81% | 12.86% | 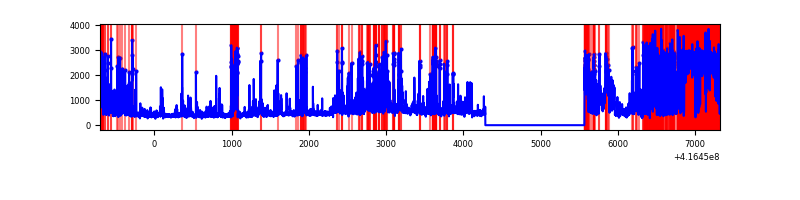 |
Top three noisy pixels from each quadrant. If the there are fewer than three noisy pixels in the level2.evt file, extra rows are filled as -1
| Pixel properties | Quadrant properties | ||||||
|---|---|---|---|---|---|---|---|
| Quadrant | DetID | PixID | Counts | Sigma | Mean | Median | Sigma |
| A | 10 | 83 | 559147 | 3663.66 | 747 | 732 | 152.4 |
| A | 13 | 248 | 378510 | 2478.53 | 747 | 732 | 152.4 |
| A | 6 | 10 | 25390 | 161.78 | 747 | 732 | 152.4 |
| B | 5 | 255 | 184029 | 1268.41 | 748 | 728 | 144.5 |
| B | 0 | 245 | 116941 | 804.17 | 748 | 728 | 144.5 |
| B | 7 | 202 | 74812 | 512.65 | 748 | 728 | 144.5 |
| C | 15 | 214 | 286117 | 1639.97 | 741 | 746 | 174.0 |
| C | 14 | 254 | 145366 | 831.1 | 741 | 746 | 174.0 |
| C | 0 | 10 | 19956 | 110.4 | 741 | 746 | 174.0 |
| D | 12 | 227 | 2738981 | 15990.04 | 695 | 676 | 171.3 |
| D | 12 | 233 | 225317 | 1311.77 | 695 | 676 | 171.3 |
| D | 1 | 47 | 191468 | 1114.11 | 695 | 676 | 171.3 |
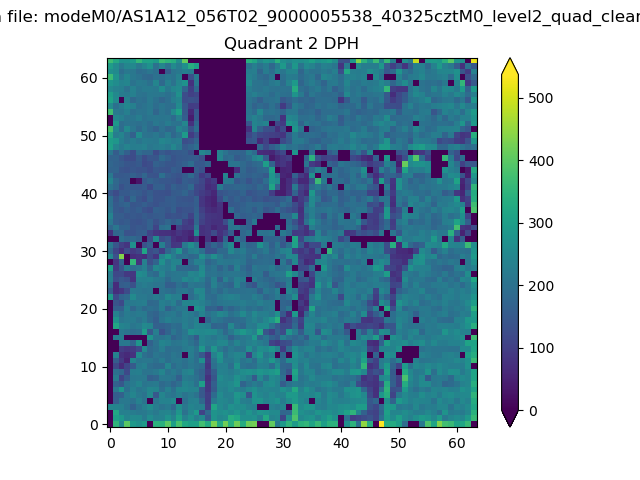
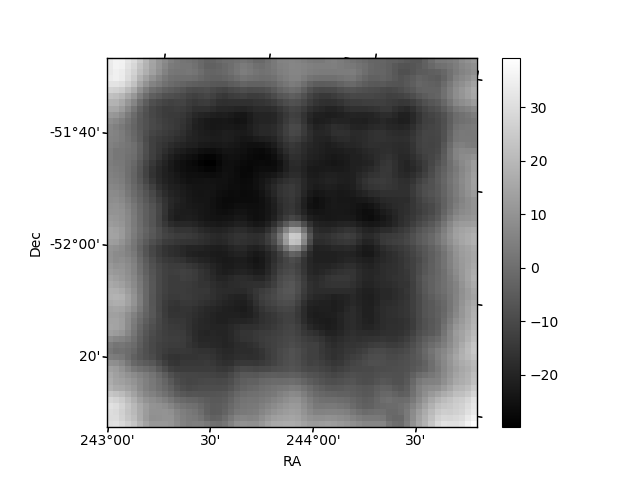
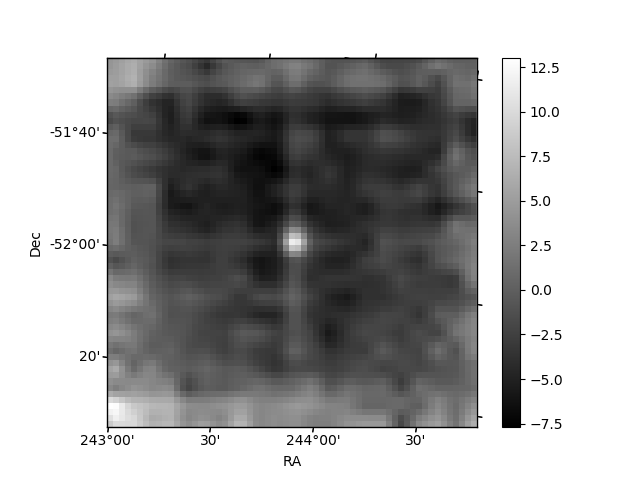
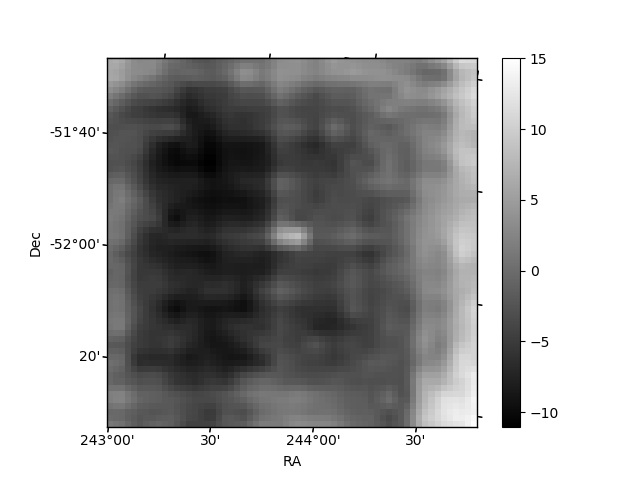
Histogram calculated using DETX and DETY for each event in the final _common_clean file
| Quadrant A | 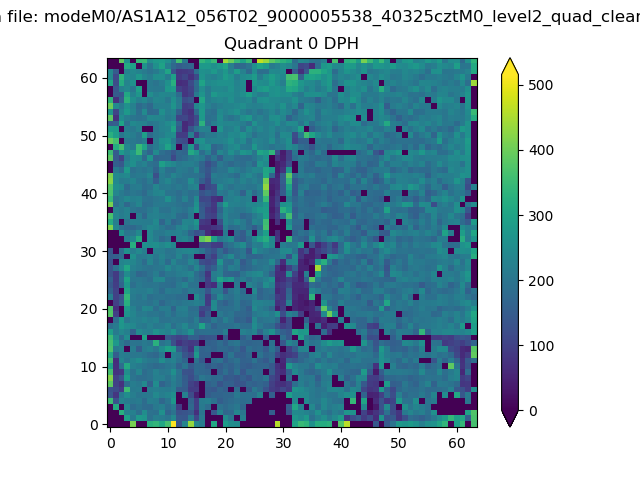 |
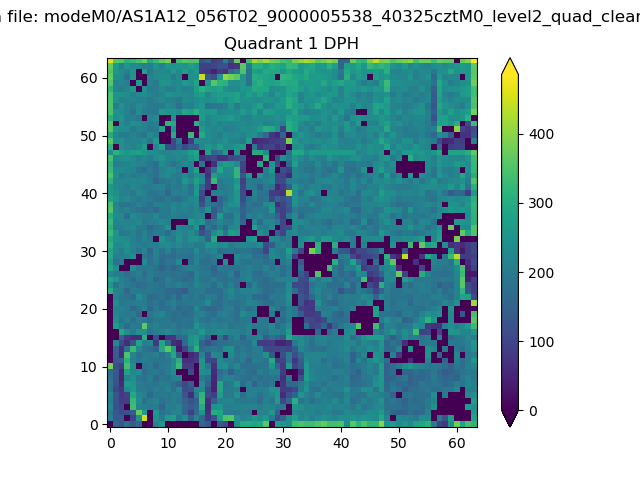 |
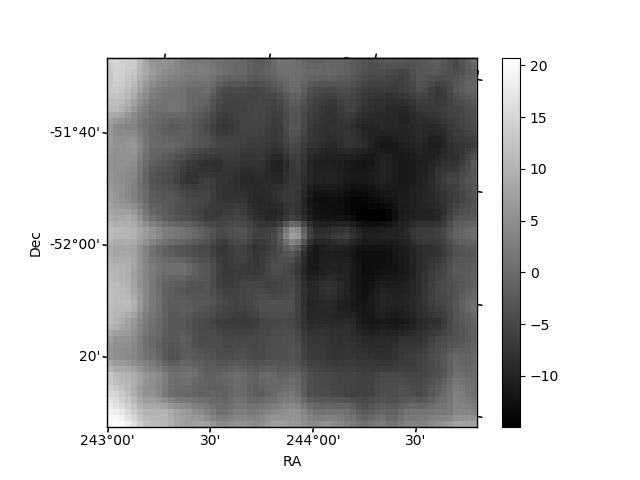
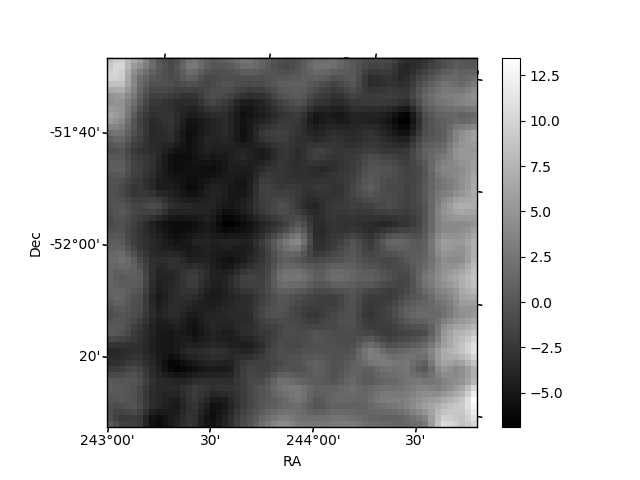
Quadrant B |
|---|---|---|---|
| Quadrant D | 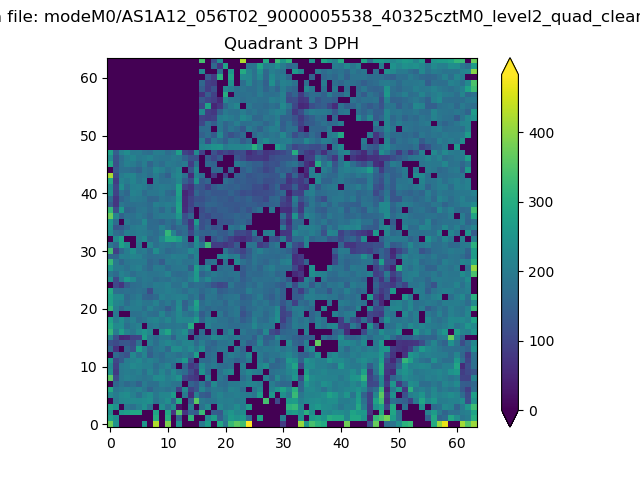 |
 |
Quadrant C |
| Plot type | Count rate plots | Images |
|---|---|---|
| Comparison with Poisson distribution Blue bars denote a histogram of data divided into 1 sec bins. Red curve is a Poisson curve with rate = median count rate of data. |
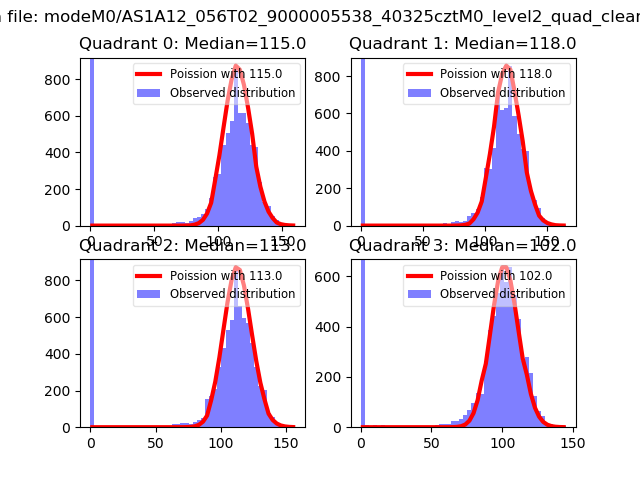 |
 |
| Quadrant-wise count rates Data is divided into 100 sec bins |
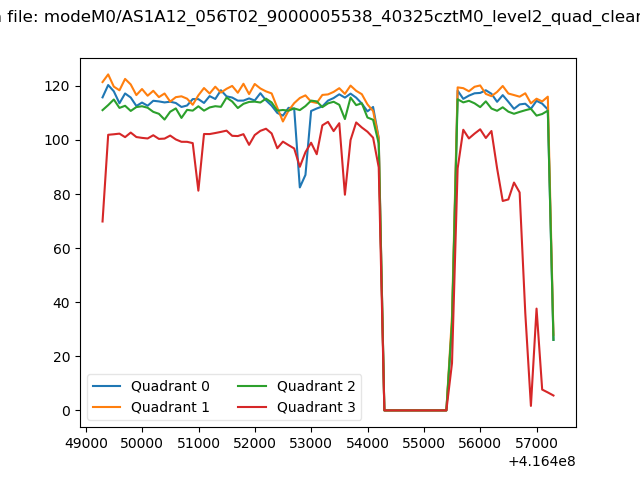 |
|
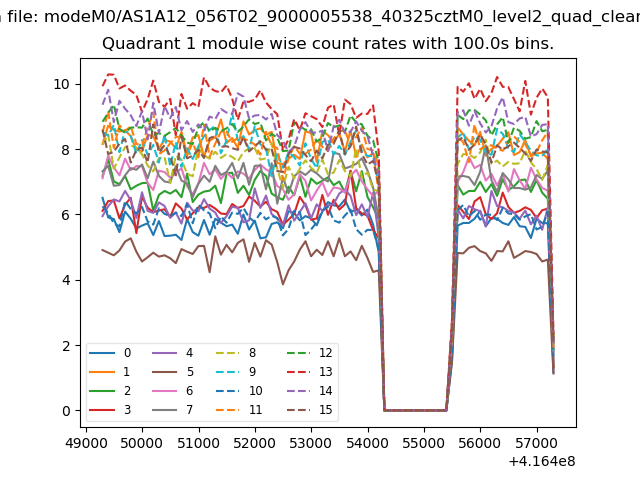
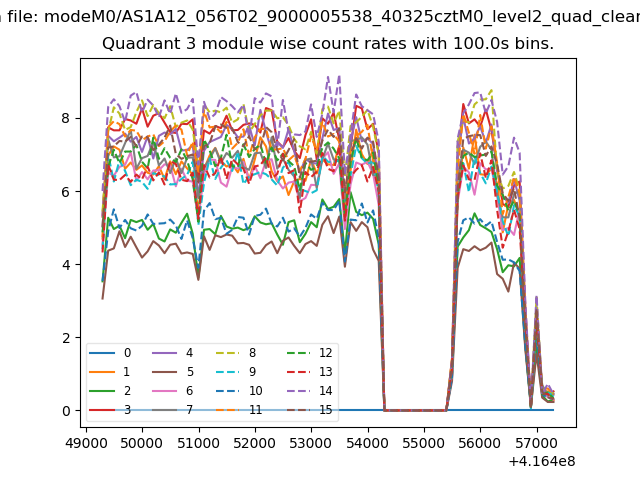
| Module-wise count rates for Quadrant A Data is divided into 100 sec bins |
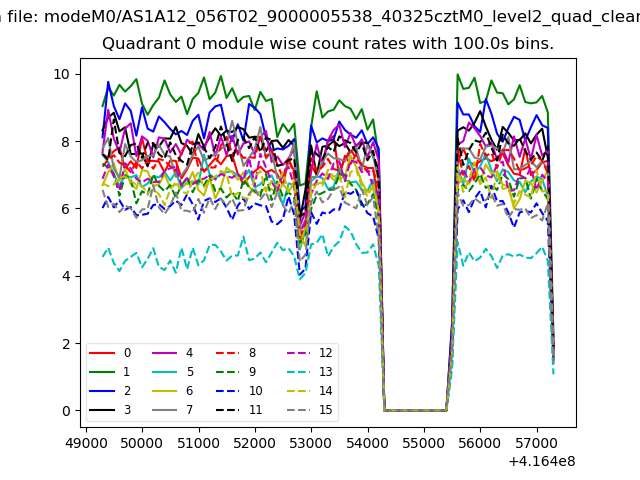 |
 |
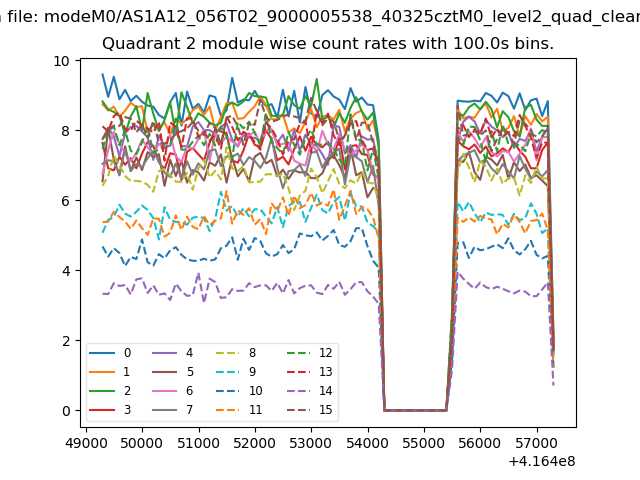
| Module-wise count rates for Quadrant B Data is divided into 100 sec bins |
 |
 |
| Module-wise count rates for Quadrant C Data is divided into 100 sec bins |
 |
 |
| Module-wise count rates for Quadrant D Data is divided into 100 sec bins |
 |
 |
| Parameter | Plot |
|---|---|
| CZT HV Monitor | 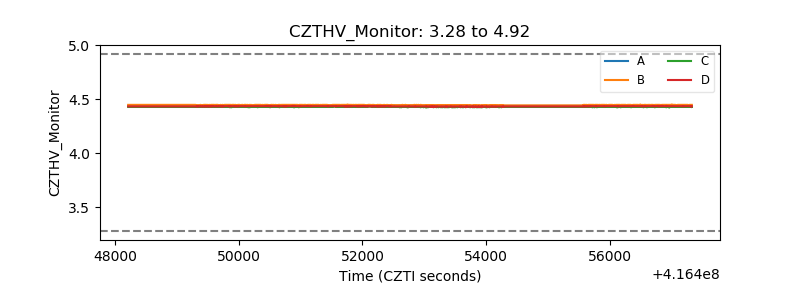 |
| D_VDD | 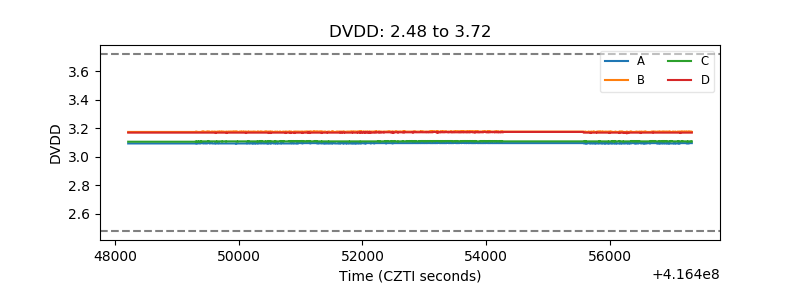 |
| Temperature 1 |  |
| Veto HV Monitor | 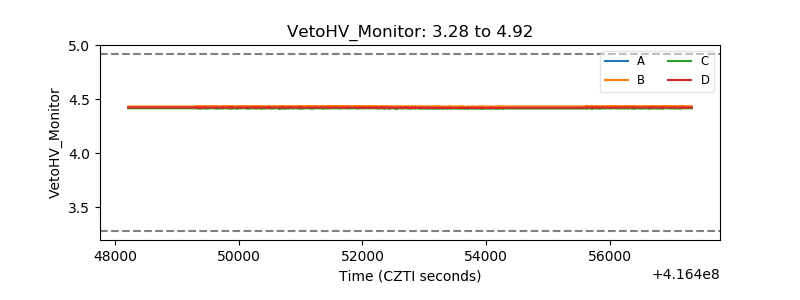 |
| Veto LLD | 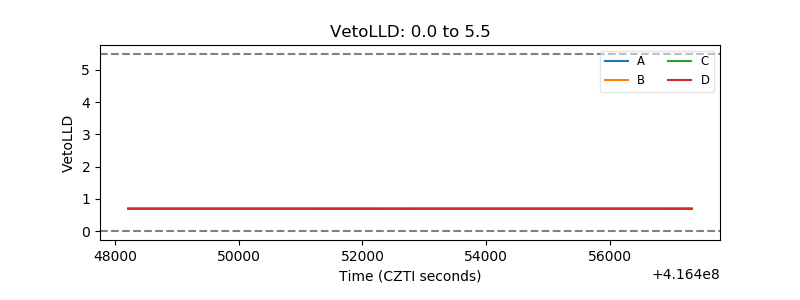 |
| Alpha Counter | 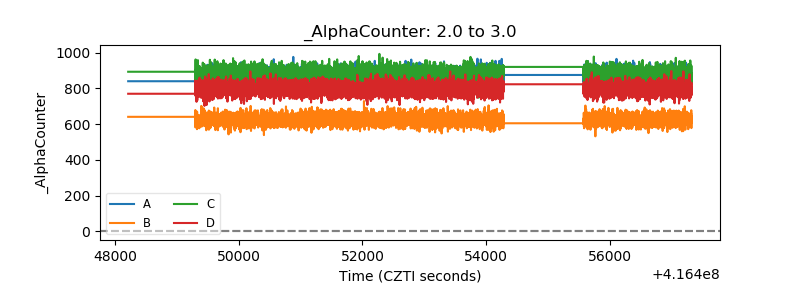 |
| _CPM_Rate | 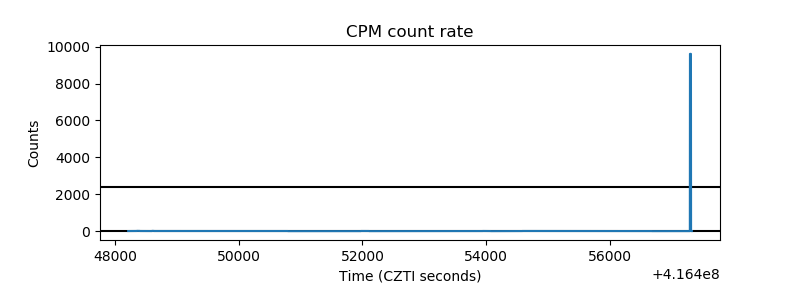 |
| CZT Counter | 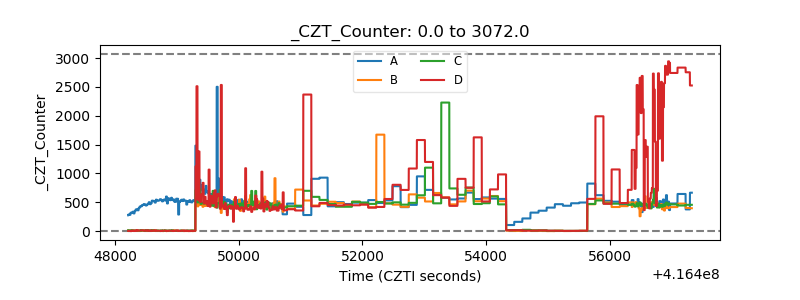 |
| +2.5 Volts monitor | 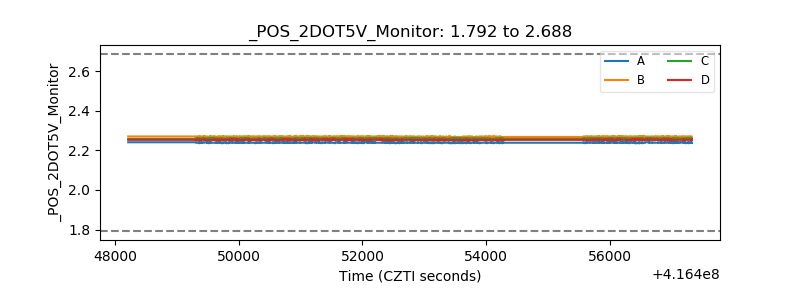 |
| +5 Volts monitor | 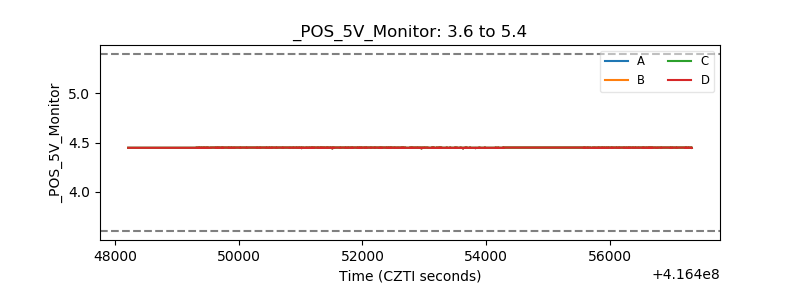 |
| _ROLL_ROT | 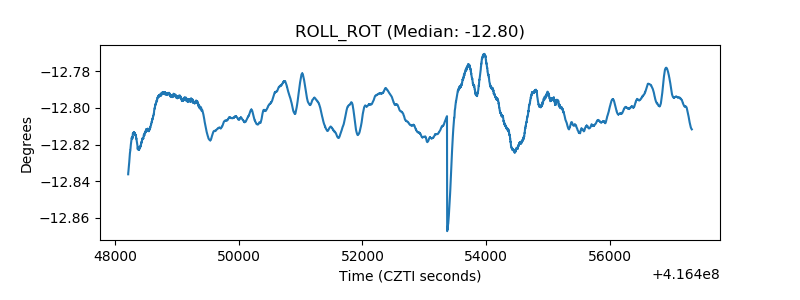 |
| _Roll_DEC | 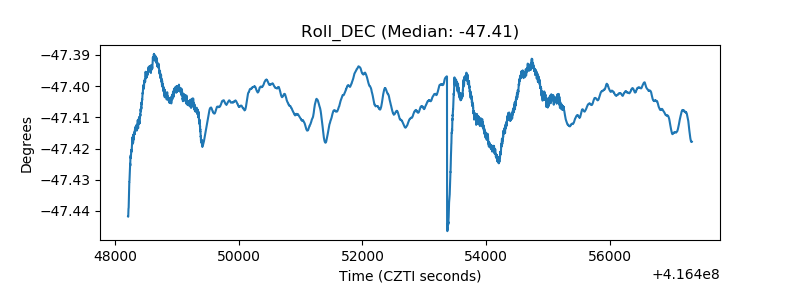 |
| _Roll_RA | 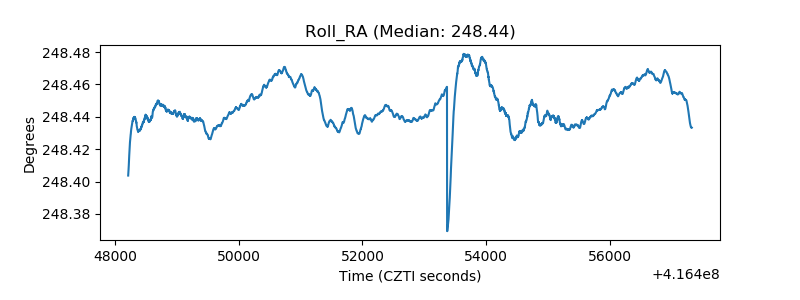 |
| Veto Counter | 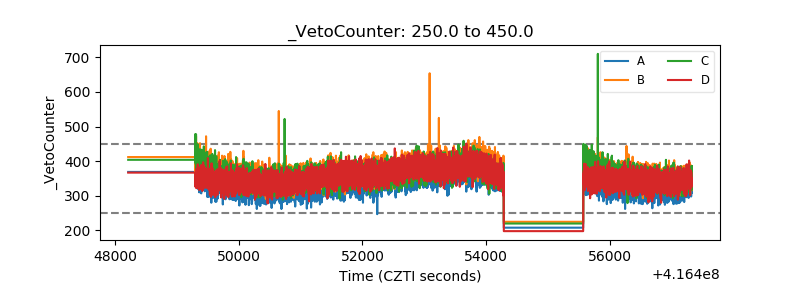 |