| Param | Original file | Final file |
|---|---|---|
| Filename | modeM0/AS1A12_056T02_9000005538_40327cztM0_level2.fits | modeM0/AS1A12_056T02_9000005538_40327cztM0_level2_quad_clean.evt |
| Size (bytes) | 1,928,321,280 | 381,375,360 |
| Size | 1.8 GB | 363.7 MB |
| Events in quadrant A | 14,549,295 | 2,679,065 |
| Events in quadrant B | 12,184,460 | 2,769,428 |
| Events in quadrant C | 11,979,234 | 2,673,092 |
| Events in quadrant D | 30,835,591 | 1,793,725 |
| Mode M0 | |||
|---|---|---|---|
| Quadrant | BADHDUFLAG | Total packets | Discarded packets |
| A | 0 | 57292 | 6 |
| B | 0 | 51416 | 5 |
| C | 0 | 49776 | 5 |
| D | 0 | 107871 | 5 |
| Mode M9 | |||
|---|---|---|---|
| Quadrant | BADHDUFLAG | Total packets | Discarded packets |
| A | 0 | 76 | 0 |
| B | 0 | 76 | 0 |
| C | 0 | 76 | 0 |
| D | 0 | 76 | 0 |
| Mode SS | |||
|---|---|---|---|
| Quadrant | BADHDUFLAG | Total packets | Discarded packets |
| A | 0 | 484 | 0 |
| B | 0 | 484 | 0 |
| C | 0 | 484 | 0 |
| D | 0 | 484 | 0 |
| Quadrant | Total seconds | Saturated seconds | Saturation percentage |
|---|---|---|---|
| A | 23709 | 507 | 2.138428% |
| B | 23709 | 213 | 0.898393% |
| C | 23709 | 194 | 0.818255% |
| D | 23709 | 6124 | 25.829854% |
Noise dominated data is calculated using 1-second bins in cleaned event files. If a bin has >2000 counts, and if more than 50% of those come from <1% of pixels, then it is considered to be noise-dominated and hence unusable.
| Quadrant | # 1 sec bins | Bins with >0 counts | Bins with >2000 counts | High rate bins dominated by noise | Noise dominated (total time) | Noise dominated (detector-on time) | Marked lightcurve |
|---|---|---|---|---|---|---|---|
| A | 31295 | 23714 | 427 | 427 | 1.36% | 1.80% | 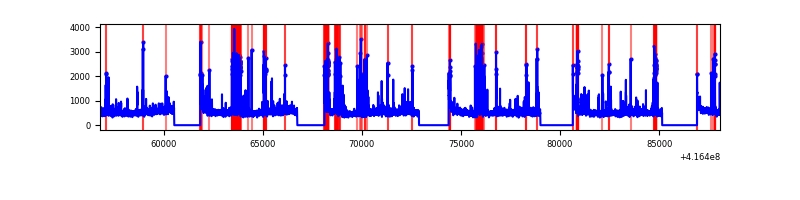 |
| B | 31295 | 23714 | 151 | 151 | 0.48% | 0.64% | 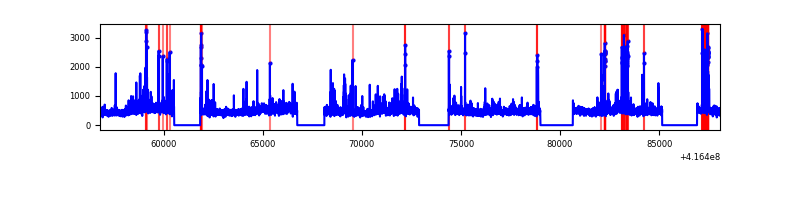 |
| C | 31295 | 23714 | 175 | 175 | 0.56% | 0.74% | 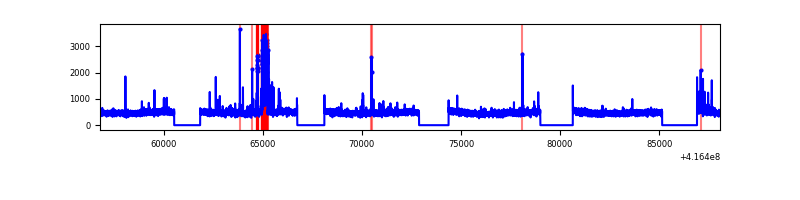 |
| D | 31295 | 23714 | 5924 | 5924 | 18.93% | 24.98% | 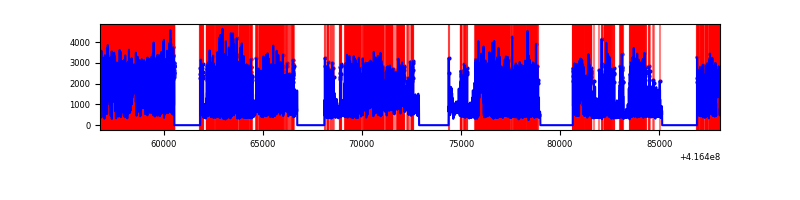 |
Top three noisy pixels from each quadrant. If the there are fewer than three noisy pixels in the level2.evt file, extra rows are filled as -1
| Pixel properties | Quadrant properties | ||||||
|---|---|---|---|---|---|---|---|
| Quadrant | DetID | PixID | Counts | Sigma | Mean | Median | Sigma |
| A | 10 | 83 | 1815349 | 3353.99 | 2676 | 2628 | 540.5 |
| A | 13 | 248 | 1792363 | 3311.47 | 2676 | 2628 | 540.5 |
| A | 12 | 189 | 220112 | 402.4 | 2676 | 2628 | 540.5 |
| B | 5 | 255 | 541586 | 1063.15 | 2667 | 2596 | 507.0 |
| B | 7 | 202 | 264031 | 515.68 | 2667 | 2596 | 507.0 |
| B | 4 | 170 | 237856 | 464.05 | 2667 | 2596 | 507.0 |
| C | 15 | 214 | 1029262 | 1679.26 | 2625 | 2641 | 611.4 |
| C | 14 | 254 | 685679 | 1117.25 | 2625 | 2641 | 611.4 |
| C | 12 | 249 | 17979 | 25.09 | 2625 | 2641 | 611.4 |
| D | 12 | 227 | 18066011 | 31766.2 | 2312 | 2243 | 568.6 |
| D | 12 | 79 | 1293892 | 2271.44 | 2312 | 2243 | 568.6 |
| D | 1 | 47 | 1032740 | 1812.19 | 2312 | 2243 | 568.6 |
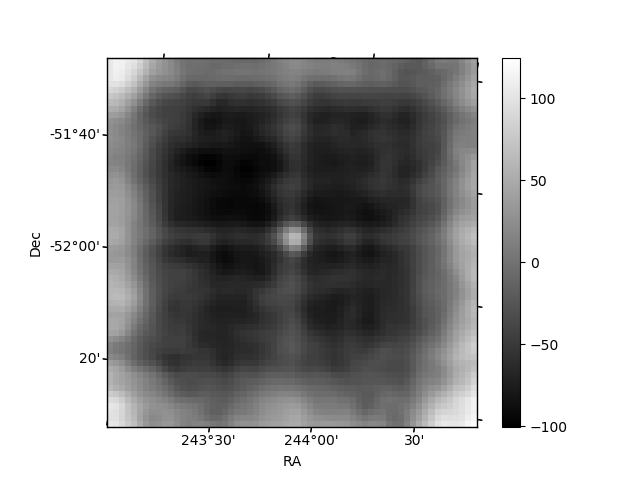
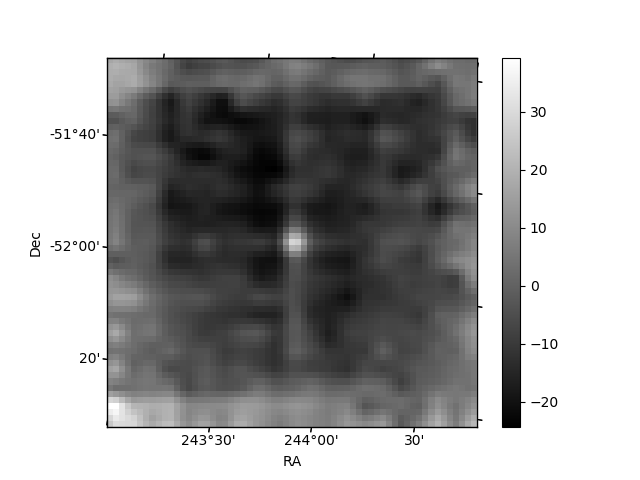
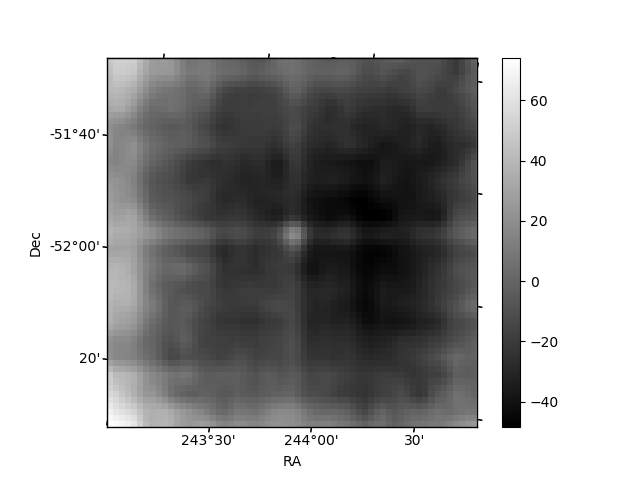
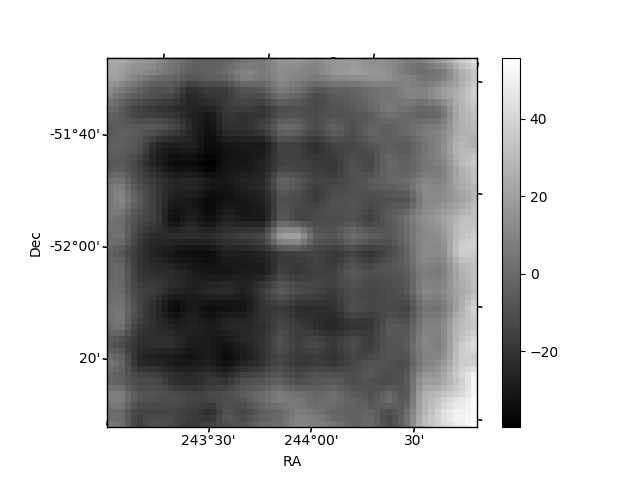
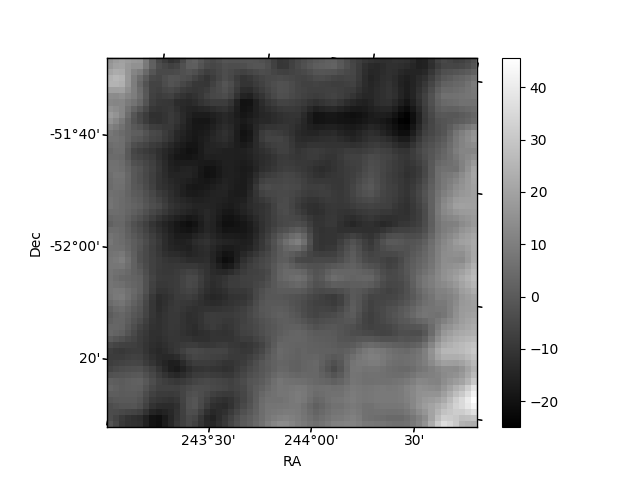
Histogram calculated using DETX and DETY for each event in the final _common_clean file
| Quadrant A | 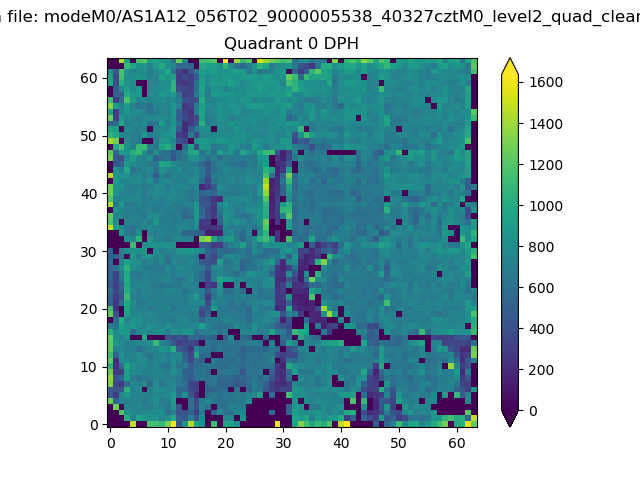 |
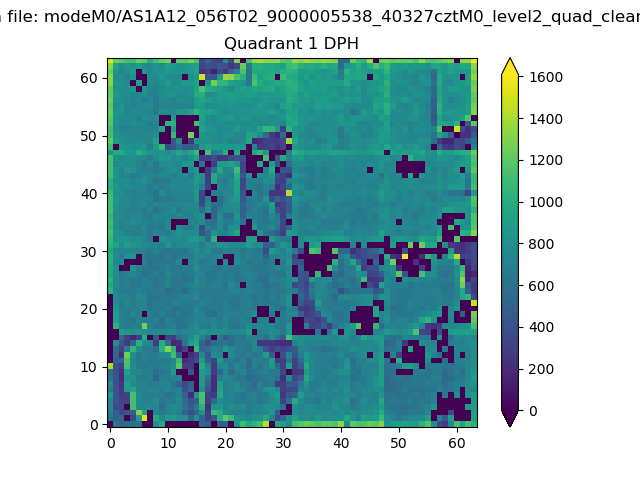 |
Quadrant B |
|---|---|---|---|
| Quadrant D | 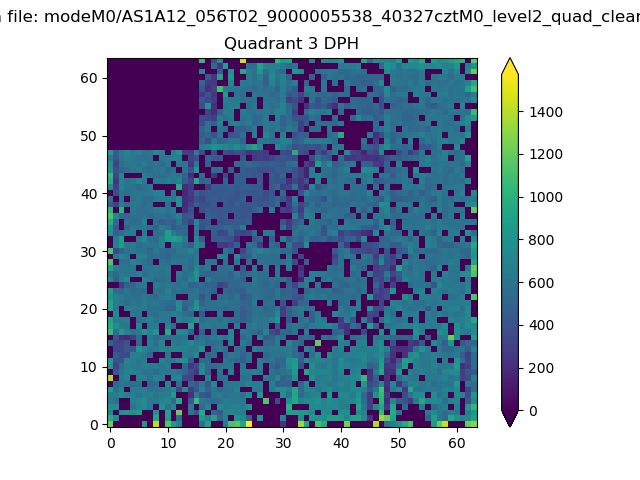 |
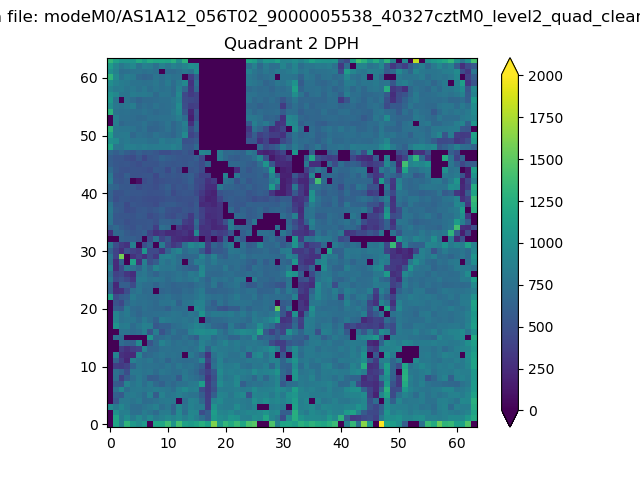 |
Quadrant C |
| Plot type | Count rate plots | Images |
|---|---|---|
| Comparison with Poisson distribution Blue bars denote a histogram of data divided into 1 sec bins. Red curve is a Poisson curve with rate = median count rate of data. |
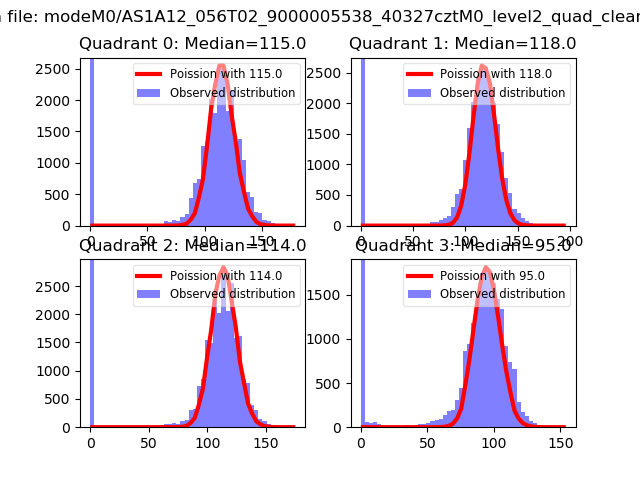 |
 |
| Quadrant-wise count rates Data is divided into 100 sec bins |
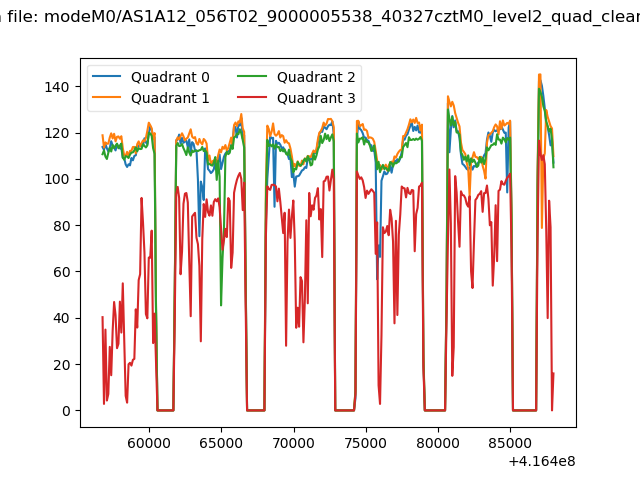 |
|
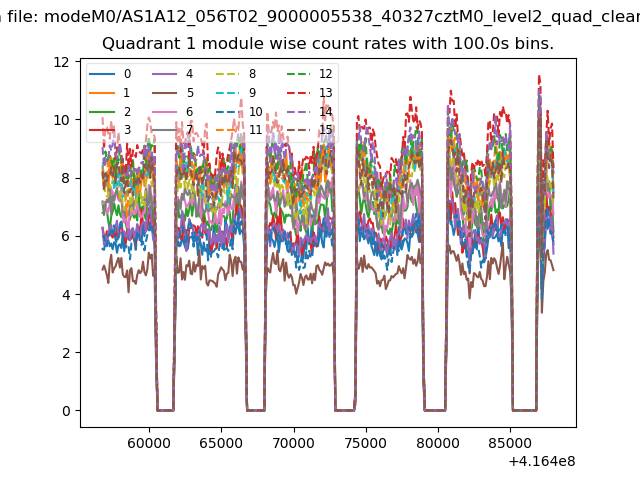
| Module-wise count rates for Quadrant A Data is divided into 100 sec bins |
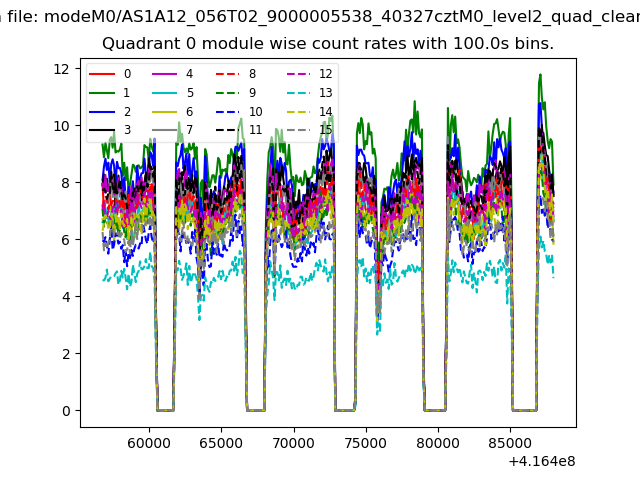 |
 |
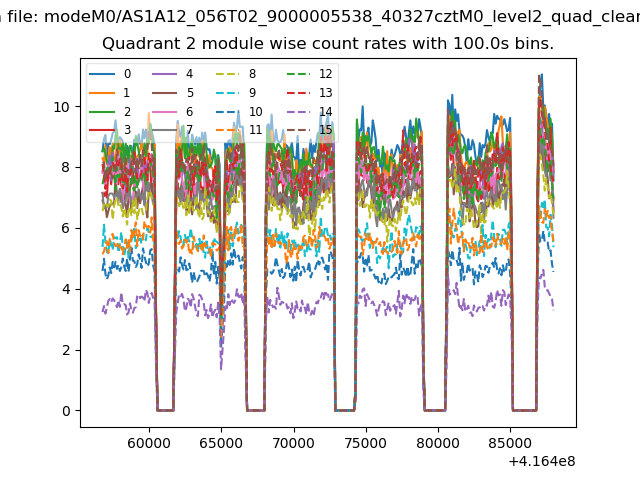
| Module-wise count rates for Quadrant B Data is divided into 100 sec bins |
 |
 |
| Module-wise count rates for Quadrant C Data is divided into 100 sec bins |
 |
 |
| Module-wise count rates for Quadrant D Data is divided into 100 sec bins |
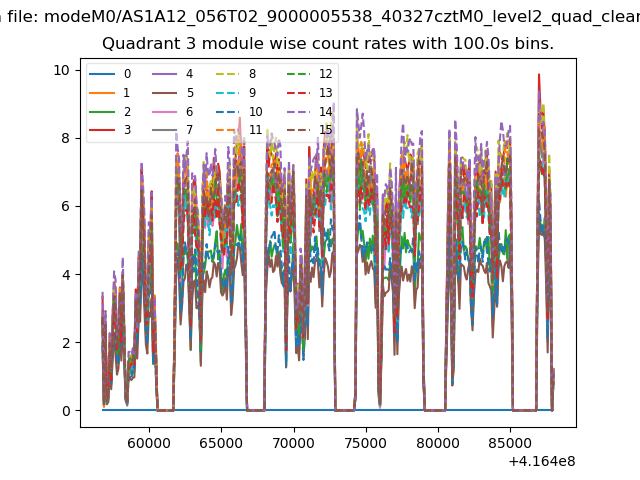 |
 |
| Parameter | Plot |
|---|---|
| CZT HV Monitor | 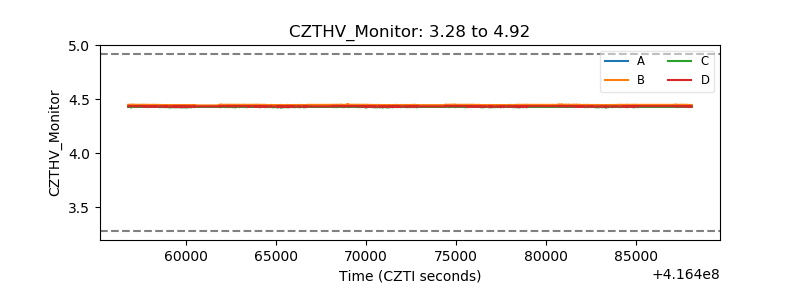 |
| D_VDD | 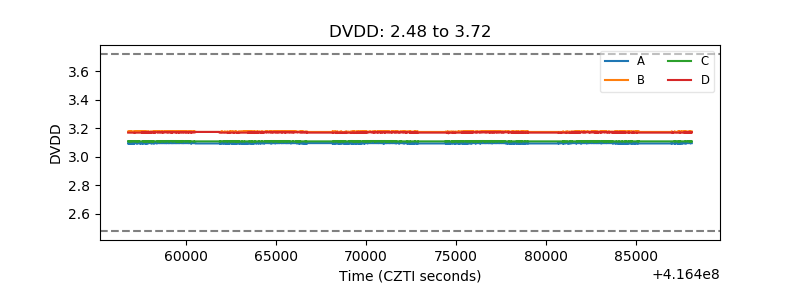 |
| Temperature 1 | 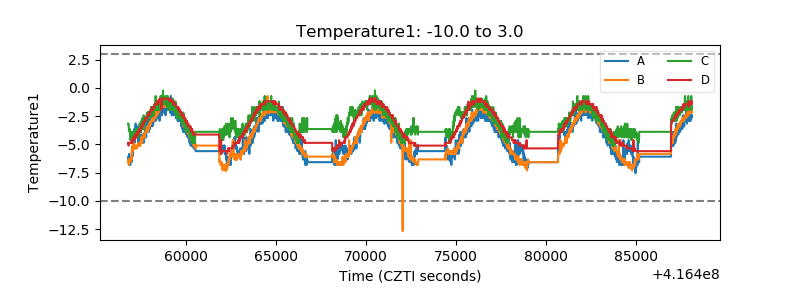 |
| Veto HV Monitor | 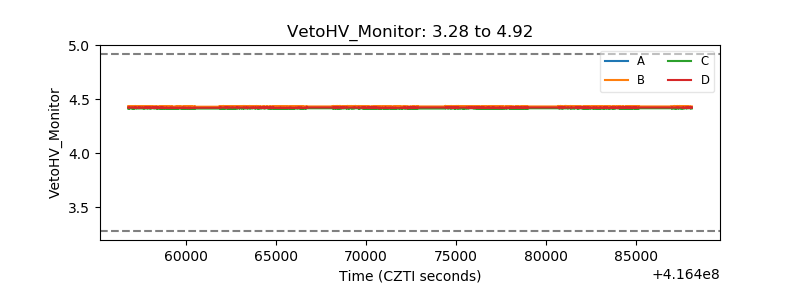 |
| Veto LLD | 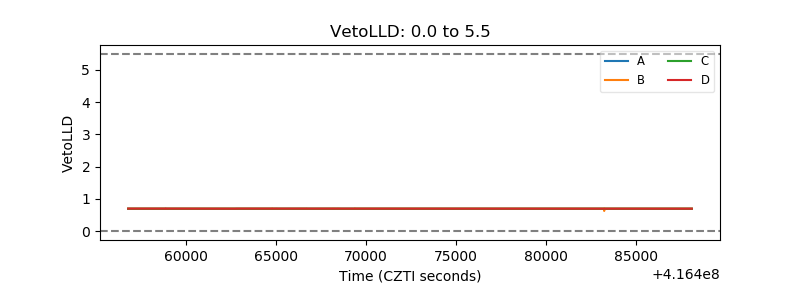 |
| Alpha Counter | 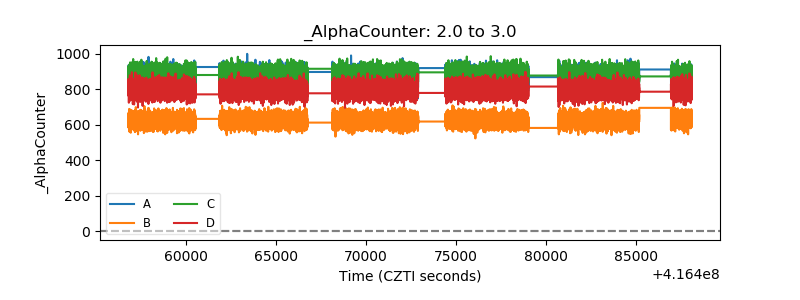 |
| _CPM_Rate | 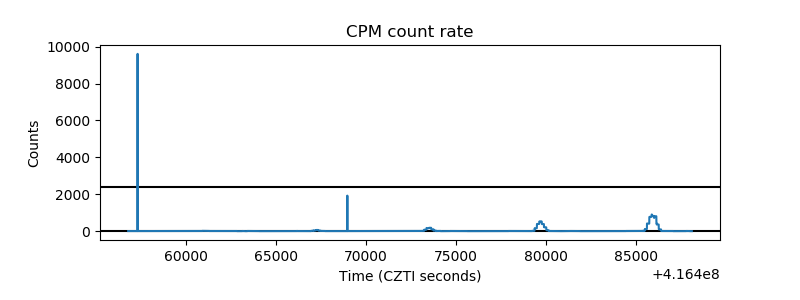 |
| CZT Counter | 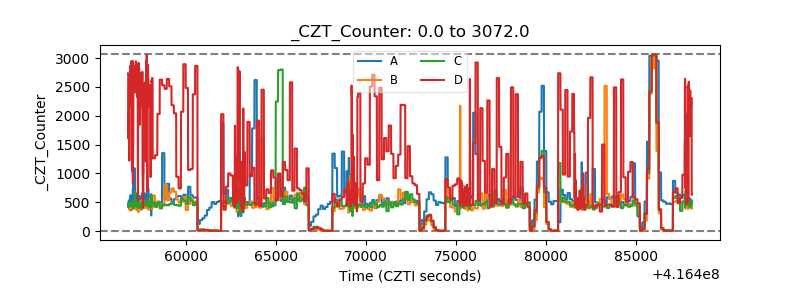 |
| +2.5 Volts monitor |  |
| +5 Volts monitor | 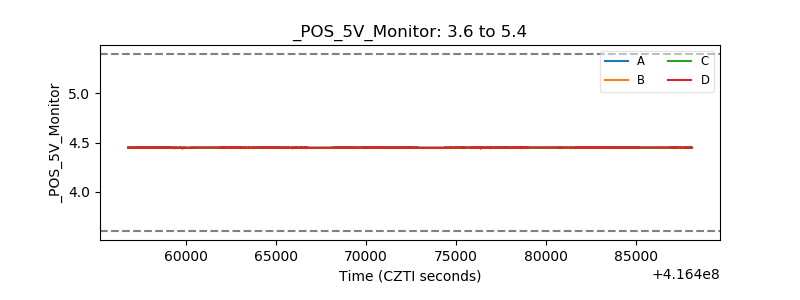 |
| _ROLL_ROT | 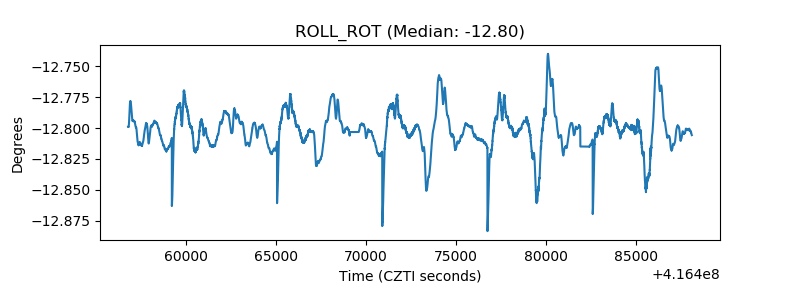 |
| _Roll_DEC | 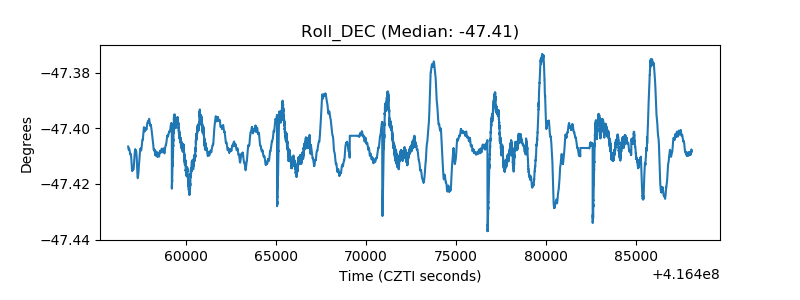 |
| _Roll_RA | 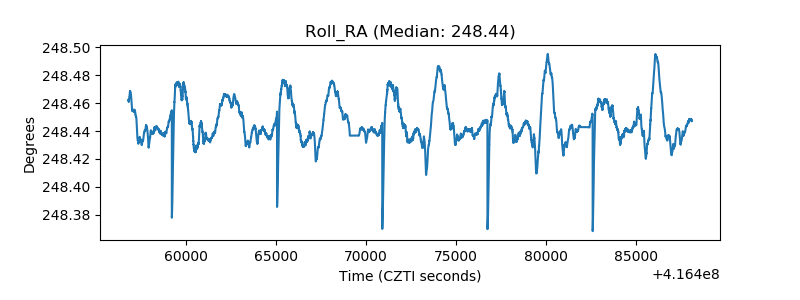 |
| Veto Counter | 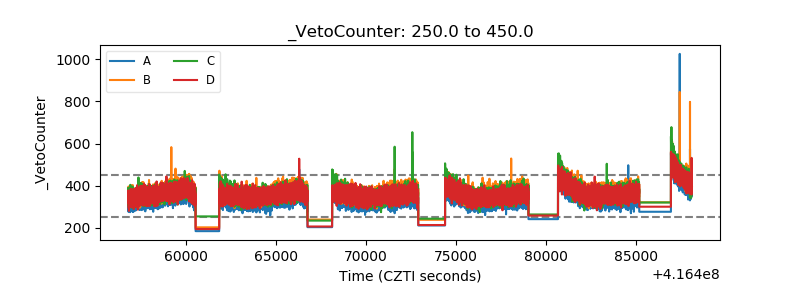 |