| Param | Original file | Final file |
|---|---|---|
| Filename | modeM0/AS1A12_056T02_9000005538_40328cztM0_level2.fits | modeM0/AS1A12_056T02_9000005538_40328cztM0_level2_quad_clean.evt |
| Size (bytes) | 482,826,240 | 90,552,960 |
| Size | 460.5 MB | 86.4 MB |
| Events in quadrant A | 3,390,230 | 667,024 |
| Events in quadrant B | 2,993,717 | 670,862 |
| Events in quadrant C | 2,725,028 | 658,601 |
| Events in quadrant D | 8,344,205 | 368,334 |
| Mode M0 | |||
|---|---|---|---|
| Quadrant | BADHDUFLAG | Total packets | Discarded packets |
| A | 0 | 13255 | 3 |
| B | 0 | 12240 | 2 |
| C | 0 | 11262 | 2 |
| D | 0 | 28459 | 2 |
| Mode M9 | |||
|---|---|---|---|
| Quadrant | BADHDUFLAG | Total packets | Discarded packets |
| A | 0 | 19 | 0 |
| B | 0 | 19 | 0 |
| C | 0 | 19 | 0 |
| D | 0 | 19 | 0 |
| Mode SS | |||
|---|---|---|---|
| Quadrant | BADHDUFLAG | Total packets | Discarded packets |
| A | 0 | 110 | 0 |
| B | 0 | 110 | 0 |
| C | 0 | 110 | 0 |
| D | 0 | 110 | 0 |
| Quadrant | Total seconds | Saturated seconds | Saturation percentage |
|---|---|---|---|
| A | 5391 | 96 | 1.780746% |
| B | 5391 | 150 | 2.782415% |
| C | 5391 | 7 | 0.129846% |
| D | 5391 | 2296 | 42.589501% |
Noise dominated data is calculated using 1-second bins in cleaned event files. If a bin has >2000 counts, and if more than 50% of those come from <1% of pixels, then it is considered to be noise-dominated and hence unusable.
| Quadrant | # 1 sec bins | Bins with >0 counts | Bins with >2000 counts | High rate bins dominated by noise | Noise dominated (total time) | Noise dominated (detector-on time) | Marked lightcurve |
|---|---|---|---|---|---|---|---|
| A | 7273 | 5392 | 73 | 73 | 1.00% | 1.35% | 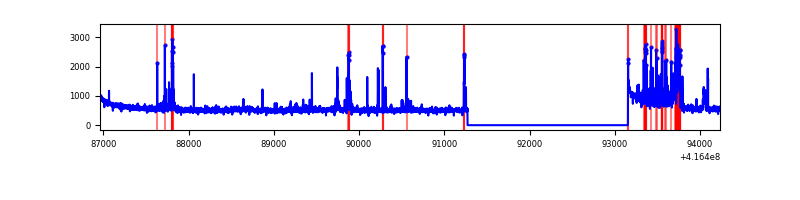 |
| B | 7273 | 5392 | 129 | 129 | 1.77% | 2.39% | 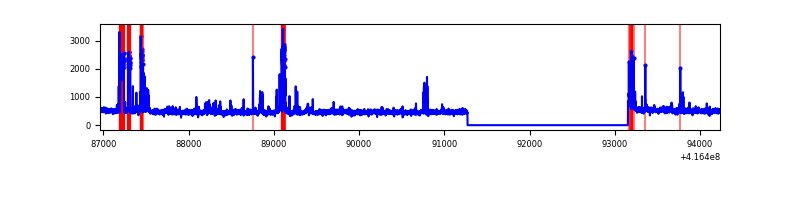 |
| C | 7273 | 5392 | 6 | 6 | 0.08% | 0.11% | 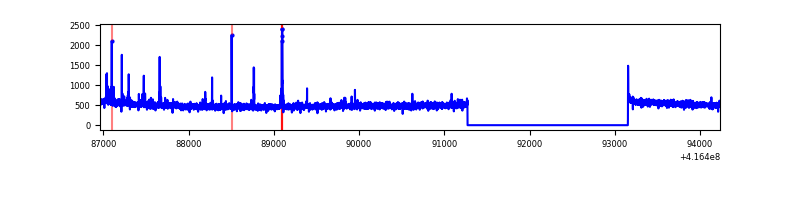 |
| D | 7273 | 5391 | 2194 | 2194 | 30.17% | 40.70% | 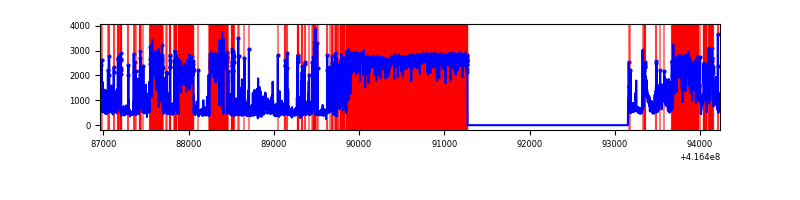 |
Top three noisy pixels from each quadrant. If the there are fewer than three noisy pixels in the level2.evt file, extra rows are filled as -1
| Pixel properties | Quadrant properties | ||||||
|---|---|---|---|---|---|---|---|
| Quadrant | DetID | PixID | Counts | Sigma | Mean | Median | Sigma |
| A | 10 | 83 | 452855 | 3517.53 | 635 | 623 | 128.6 |
| A | 13 | 248 | 313246 | 2431.63 | 635 | 623 | 128.6 |
| A | 12 | 189 | 67690 | 521.66 | 635 | 623 | 128.6 |
| B | 5 | 255 | 203414 | 1727.76 | 622 | 606 | 117.4 |
| B | 4 | 170 | 119831 | 1015.7 | 622 | 606 | 117.4 |
| B | 3 | 112 | 114329 | 968.83 | 622 | 606 | 117.4 |
| C | 15 | 214 | 245111 | 1706.68 | 617 | 623 | 143.3 |
| C | 14 | 254 | 69821 | 483.05 | 617 | 623 | 143.3 |
| C | 0 | 10 | 4285 | 25.56 | 617 | 623 | 143.3 |
| D | 12 | 227 | 3315791 | 29942.39 | 447 | 434 | 110.7 |
| D | 1 | 47 | 3192235 | 28826.5 | 447 | 434 | 110.7 |
| D | 2 | 250 | 32171 | 286.63 | 447 | 434 | 110.7 |
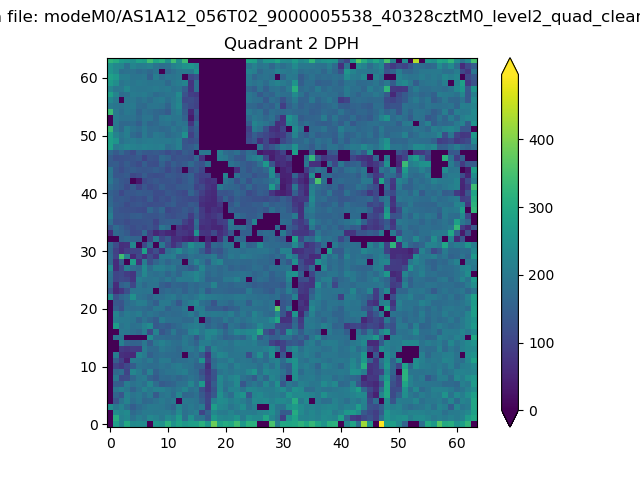
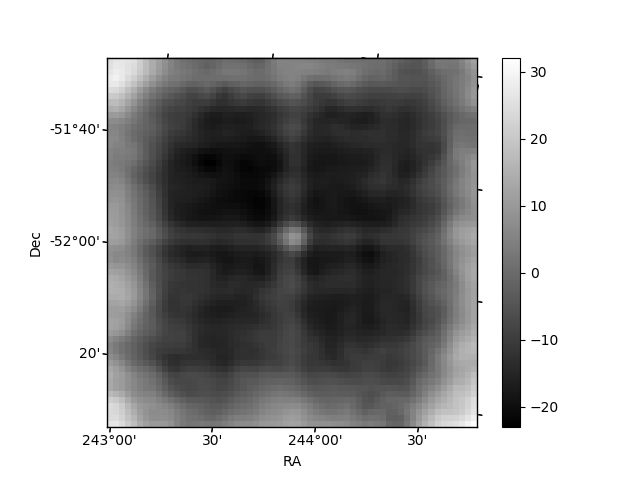
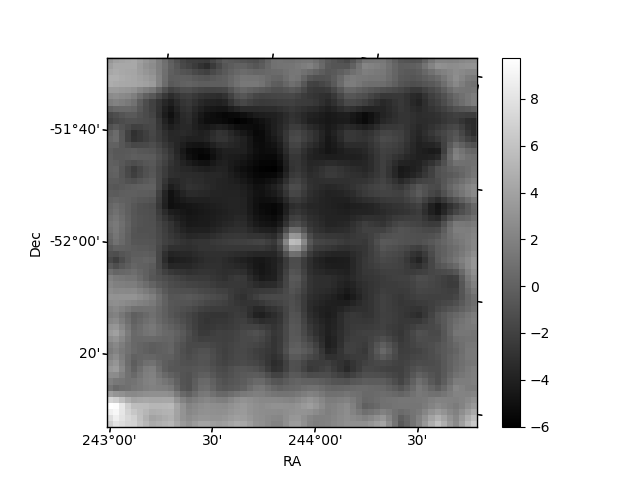
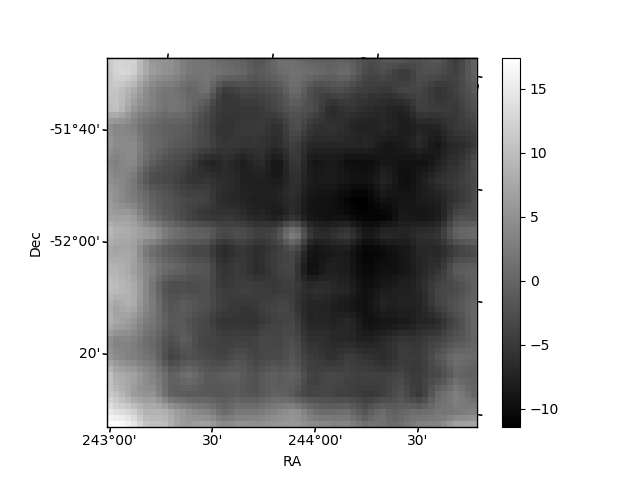
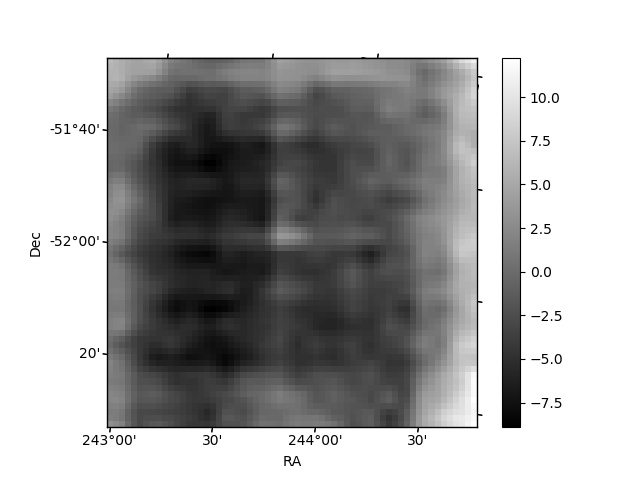
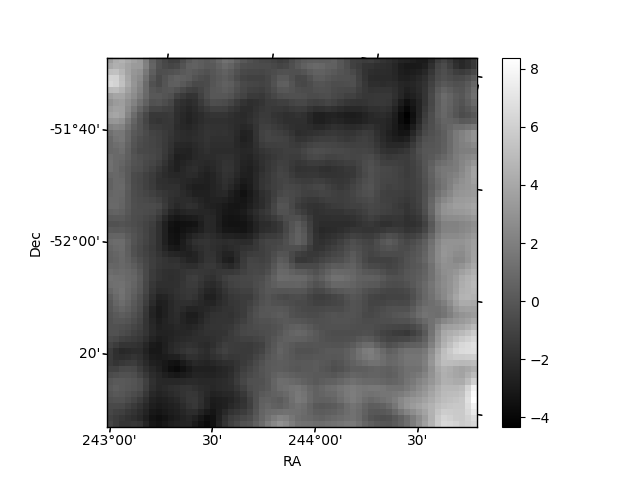
Histogram calculated using DETX and DETY for each event in the final _common_clean file
| Quadrant A | 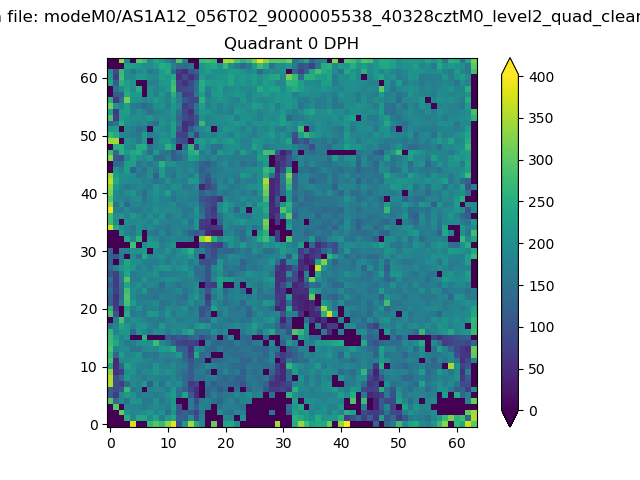 |
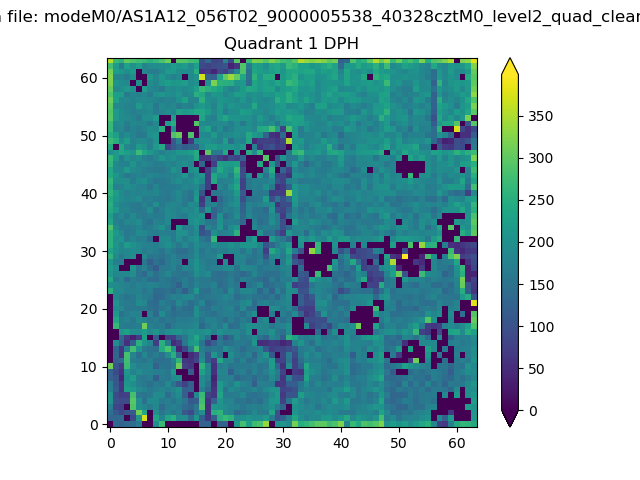 |
Quadrant B |
|---|---|---|---|
| Quadrant D | 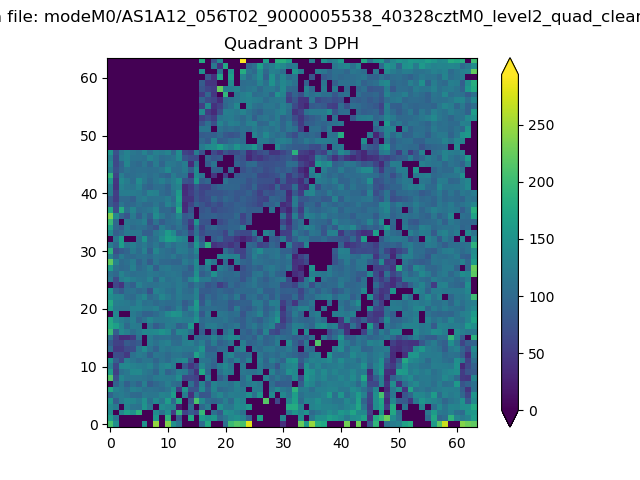 |
 |
Quadrant C |
| Plot type | Count rate plots | Images |
|---|---|---|
| Comparison with Poisson distribution Blue bars denote a histogram of data divided into 1 sec bins. Red curve is a Poisson curve with rate = median count rate of data. |
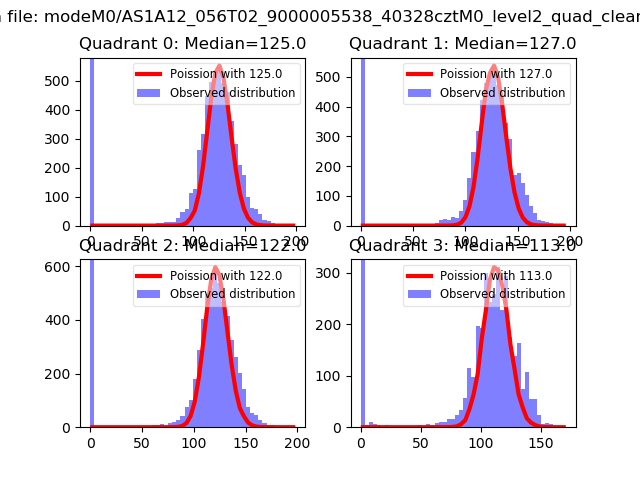 |
 |
| Quadrant-wise count rates Data is divided into 100 sec bins |
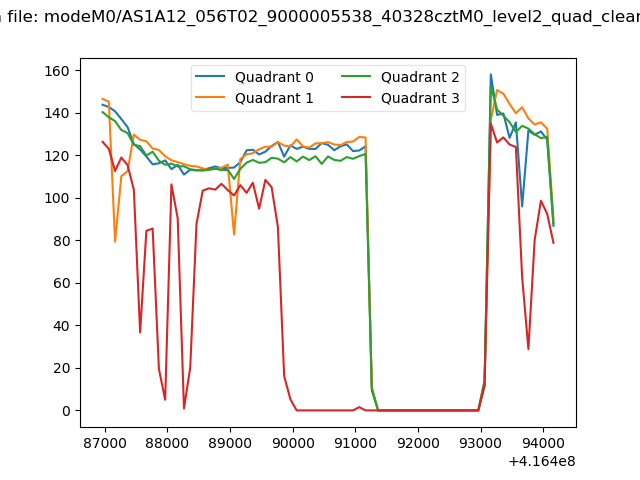 |
|
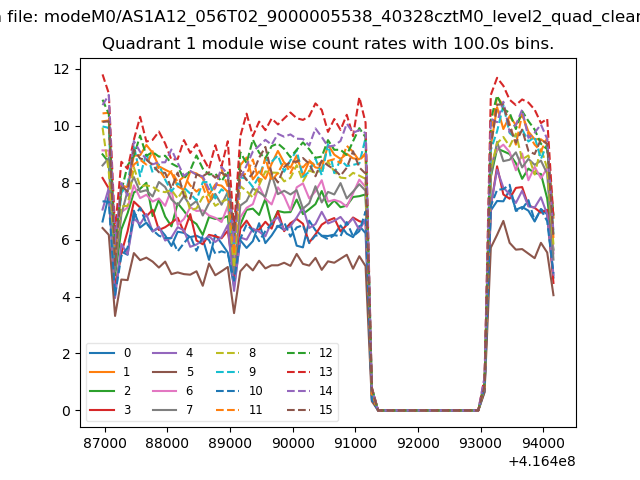
| Module-wise count rates for Quadrant A Data is divided into 100 sec bins |
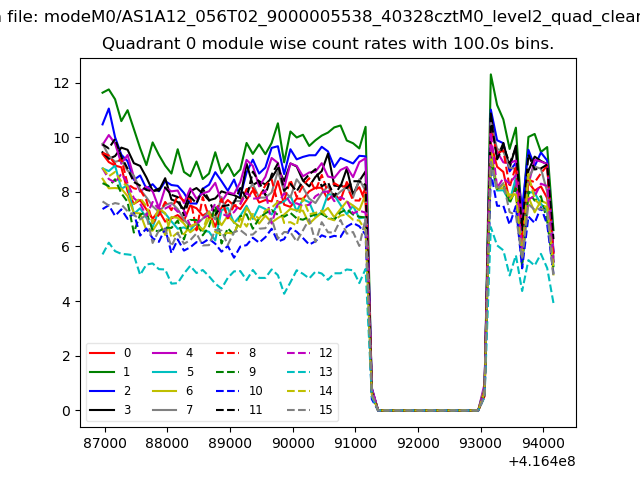 |
 |
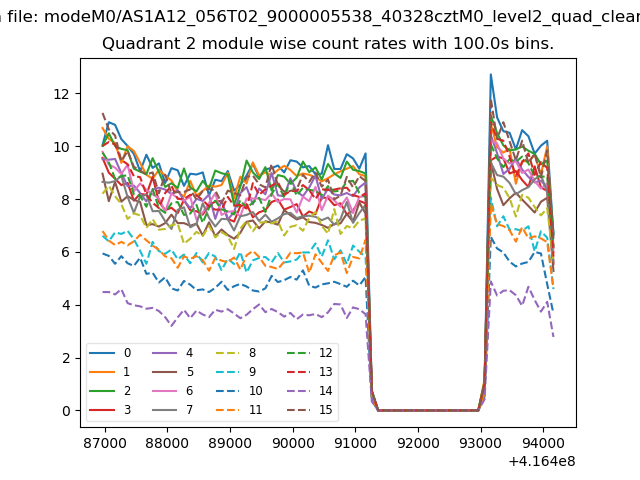
| Module-wise count rates for Quadrant B Data is divided into 100 sec bins |
 |
 |
| Module-wise count rates for Quadrant C Data is divided into 100 sec bins |
 |
 |
| Module-wise count rates for Quadrant D Data is divided into 100 sec bins |
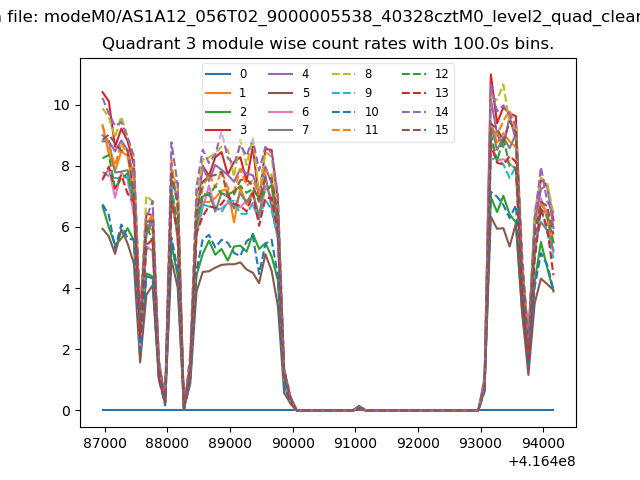 |
 |
| Parameter | Plot |
|---|---|
| CZT HV Monitor | 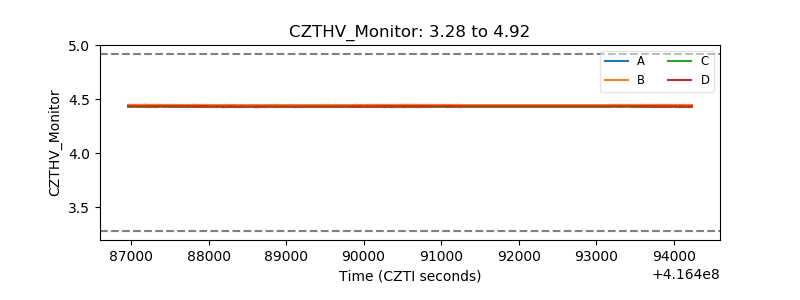 |
| D_VDD | 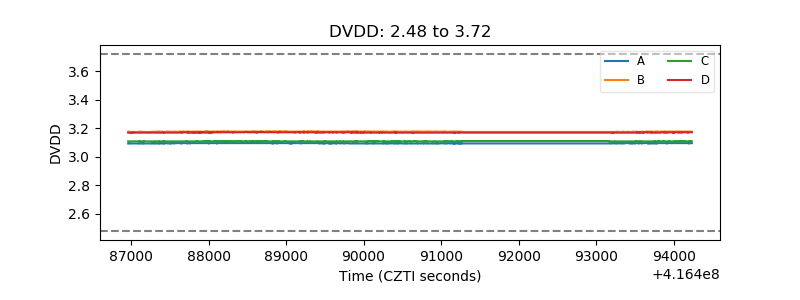 |
| Temperature 1 | 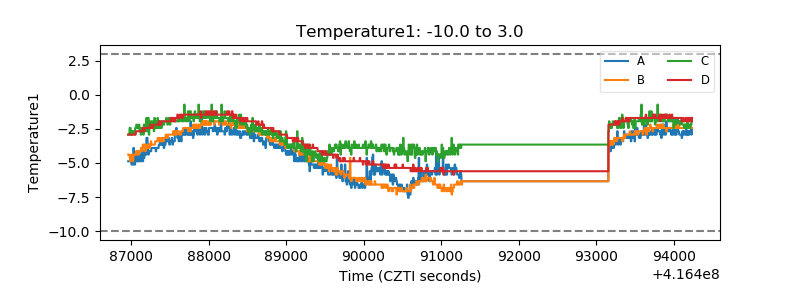 |
| Veto HV Monitor | 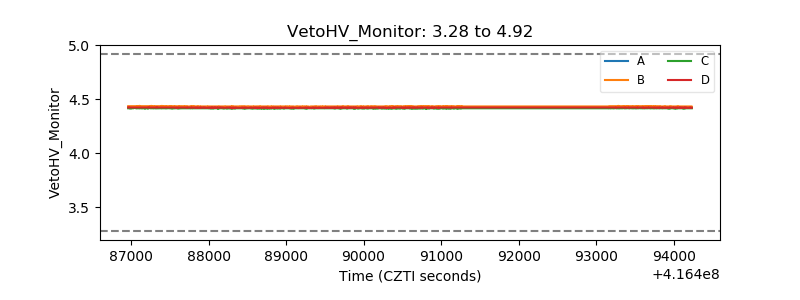 |
| Veto LLD |  |
| Alpha Counter | 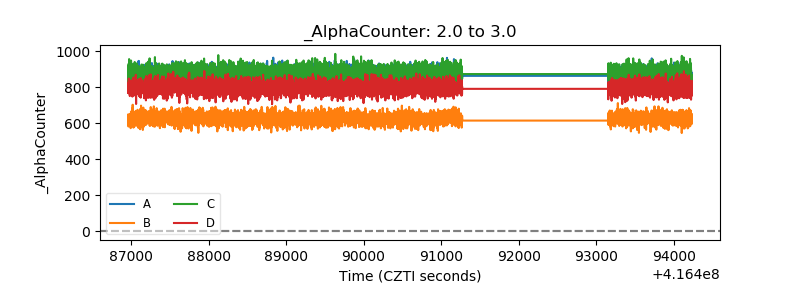 |
| _CPM_Rate | 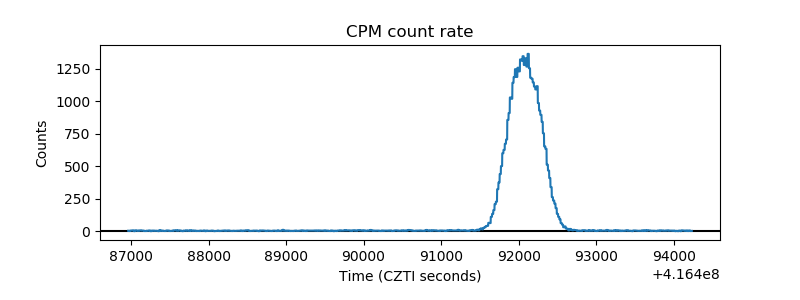 |
| CZT Counter | 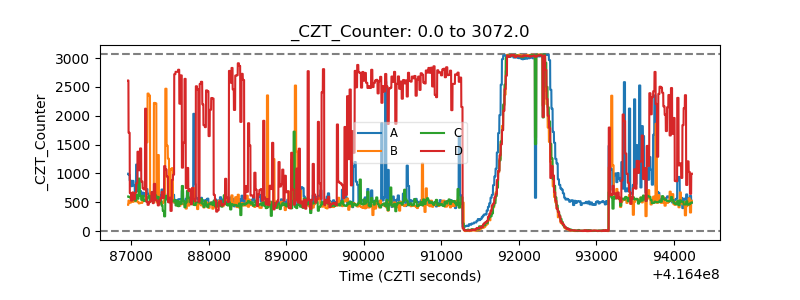 |
| +2.5 Volts monitor | 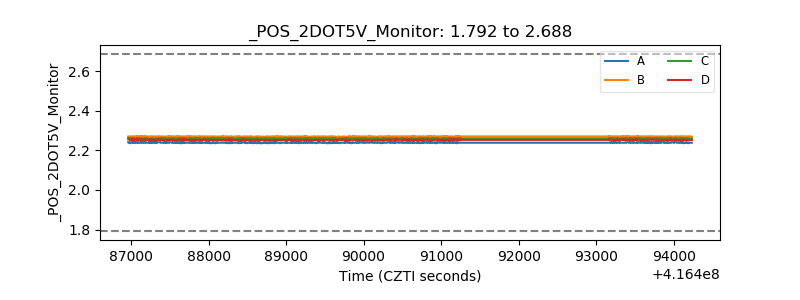 |
| +5 Volts monitor | 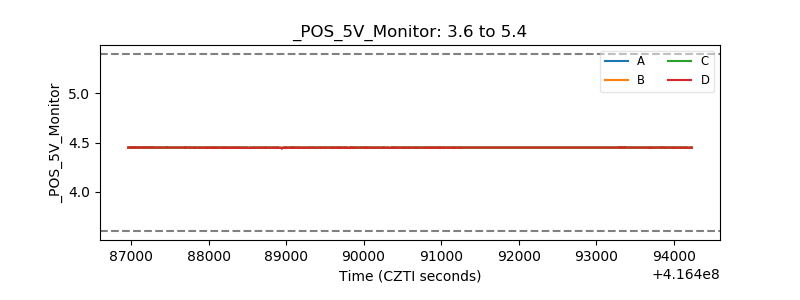 |
| _ROLL_ROT | 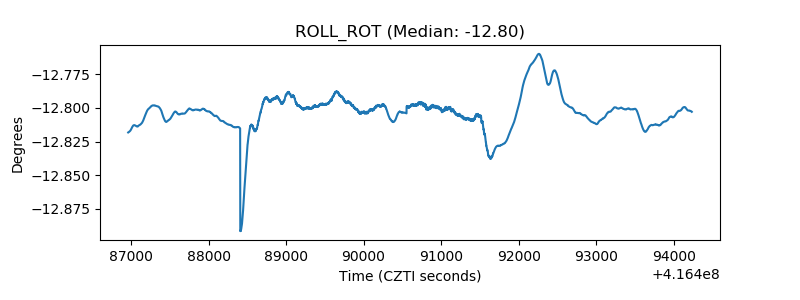 |
| _Roll_DEC | 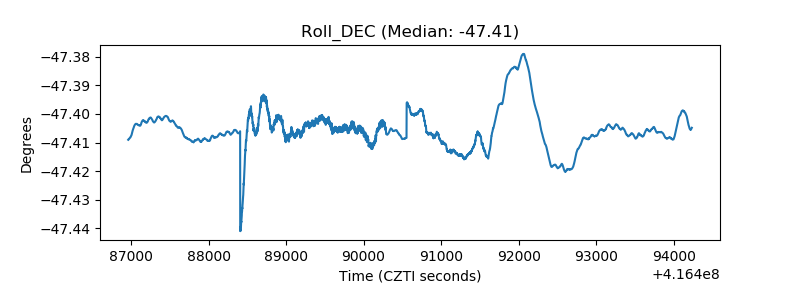 |
| _Roll_RA | 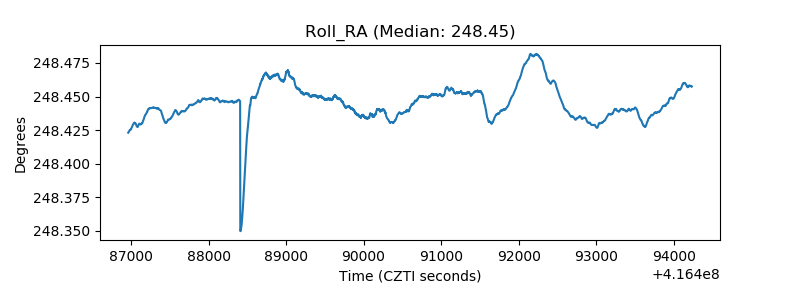 |
| Veto Counter | 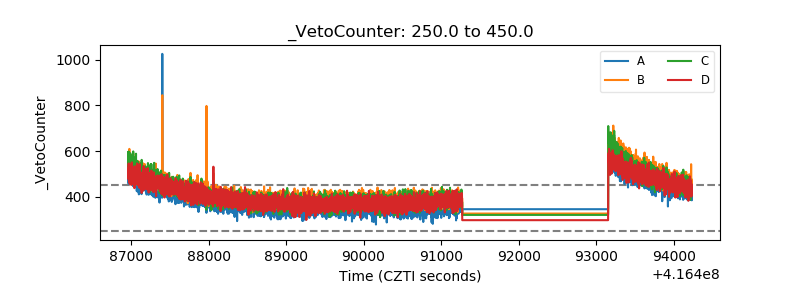 |