| Param | Original file | Final file |
|---|---|---|
| Filename | modeM0/AS1A12_056T02_9000005538_40330cztM0_level2.fits | modeM0/AS1A12_056T02_9000005538_40330cztM0_level2_quad_clean.evt |
| Size (bytes) | 373,746,240 | 98,778,240 |
| Size | 356.4 MB | 94.2 MB |
| Events in quadrant A | 3,338,243 | 678,827 |
| Events in quadrant B | 3,283,707 | 693,047 |
| Events in quadrant C | 2,732,026 | 659,989 |
| Events in quadrant D | 4,079,031 | 597,693 |
| Mode M0 | |||
|---|---|---|---|
| Quadrant | BADHDUFLAG | Total packets | Discarded packets |
| A | 0 | 13134 | 3 |
| B | 0 | 13029 | 2 |
| C | 0 | 11013 | 2 |
| D | 0 | 15537 | 2 |
| Mode M9 | |||
|---|---|---|---|
| Quadrant | BADHDUFLAG | Total packets | Discarded packets |
| A | 0 | 28 | 0 |
| B | 0 | 28 | 0 |
| C | 0 | 28 | 0 |
| D | 0 | 29 | 0 |
| Mode SS | |||
|---|---|---|---|
| Quadrant | BADHDUFLAG | Total packets | Discarded packets |
| A | 0 | 104 | 0 |
| B | 0 | 104 | 0 |
| C | 0 | 104 | 0 |
| D | 0 | 104 | 0 |
| Quadrant | Total seconds | Saturated seconds | Saturation percentage |
|---|---|---|---|
| A | 5167 | 141 | 2.728856% |
| B | 5167 | 136 | 2.632088% |
| C | 5167 | 20 | 0.387072% |
| D | 5167 | 188 | 3.638475% |
Noise dominated data is calculated using 1-second bins in cleaned event files. If a bin has >2000 counts, and if more than 50% of those come from <1% of pixels, then it is considered to be noise-dominated and hence unusable.
| Quadrant | # 1 sec bins | Bins with >0 counts | Bins with >2000 counts | High rate bins dominated by noise | Noise dominated (total time) | Noise dominated (detector-on time) | Marked lightcurve |
|---|---|---|---|---|---|---|---|
| A | 7259 | 5168 | 116 | 116 | 1.60% | 2.24% | 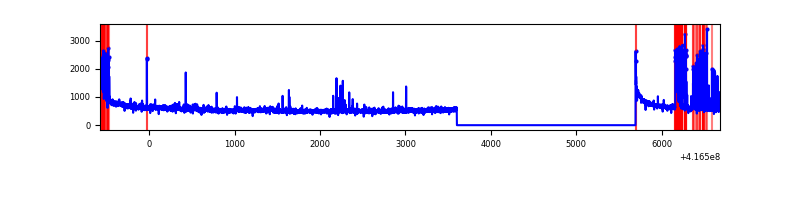 |
| B | 7259 | 5168 | 105 | 105 | 1.45% | 2.03% | 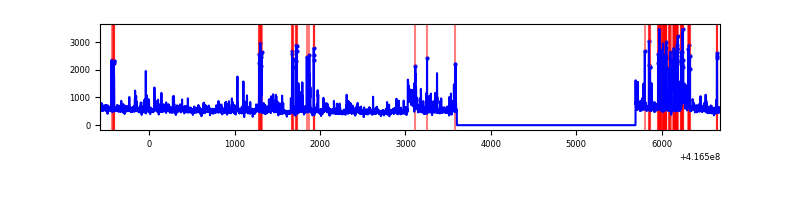 |
| C | 7259 | 5168 | 15 | 15 | 0.21% | 0.29% | 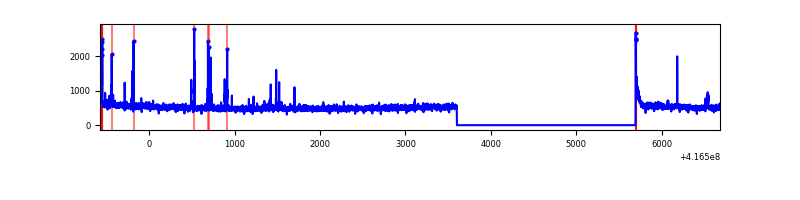 |
| D | 7259 | 5168 | 195 | 195 | 2.69% | 3.77% | 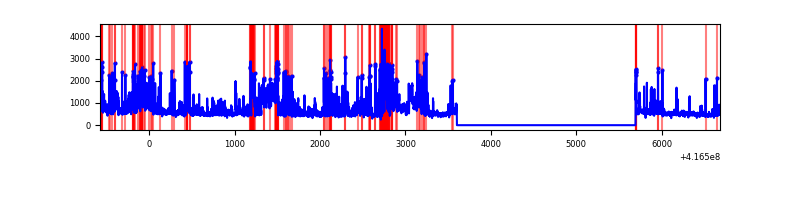 |
Top three noisy pixels from each quadrant. If the there are fewer than three noisy pixels in the level2.evt file, extra rows are filled as -1
| Pixel properties | Quadrant properties | ||||||
|---|---|---|---|---|---|---|---|
| Quadrant | DetID | PixID | Counts | Sigma | Mean | Median | Sigma |
| A | 10 | 83 | 470106 | 3713.34 | 625 | 615 | 126.4 |
| A | 13 | 248 | 331379 | 2616.11 | 625 | 615 | 126.4 |
| A | 12 | 189 | 50627 | 395.56 | 625 | 615 | 126.4 |
| B | 3 | 112 | 411368 | 3492.52 | 624 | 609 | 117.6 |
| B | 4 | 171 | 183262 | 1553.03 | 624 | 609 | 117.6 |
| B | 5 | 255 | 114594 | 969.17 | 624 | 609 | 117.6 |
| C | 15 | 214 | 237767 | 1684.23 | 608 | 612 | 140.8 |
| C | 14 | 254 | 85554 | 603.24 | 608 | 612 | 140.8 |
| C | 0 | 10 | 36590 | 255.51 | 608 | 612 | 140.8 |
| D | 12 | 227 | 1561947 | 10652.36 | 601 | 585 | 146.6 |
| D | 12 | 128 | 63155 | 426.88 | 601 | 585 | 146.6 |
| D | 9 | 19 | 56439 | 381.06 | 601 | 585 | 146.6 |
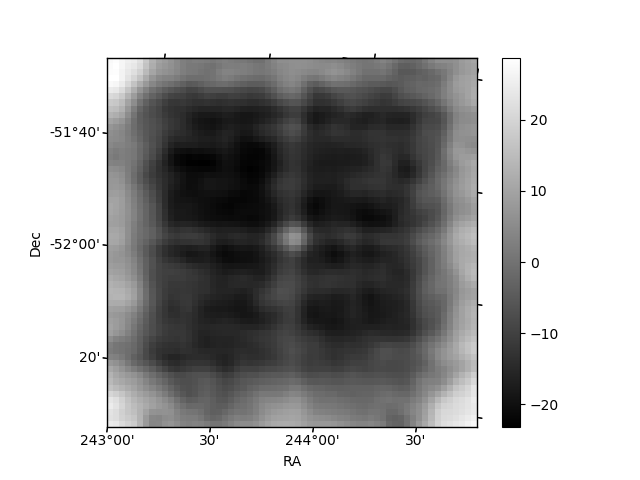
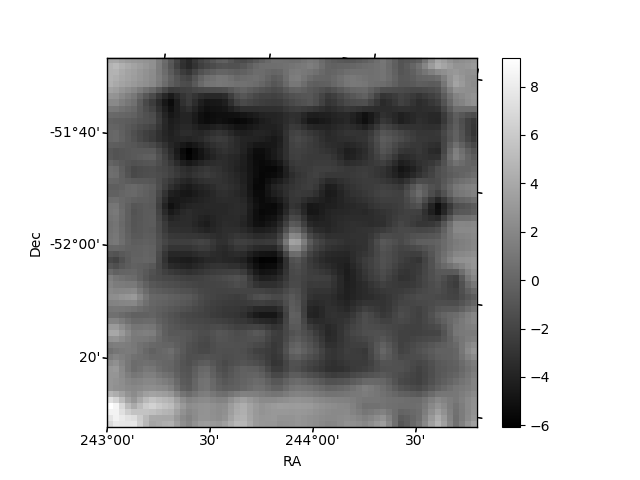
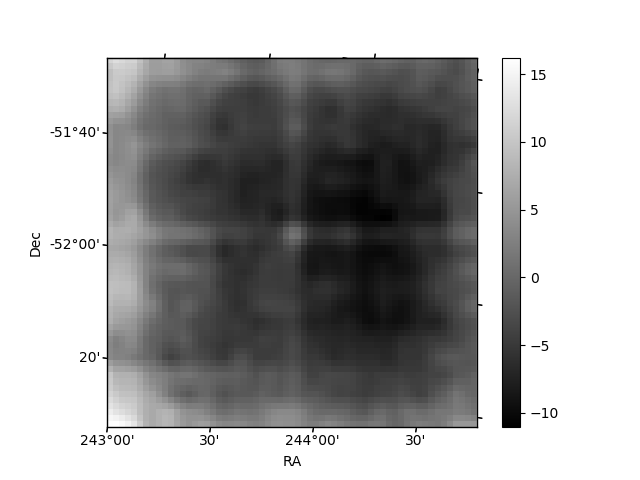
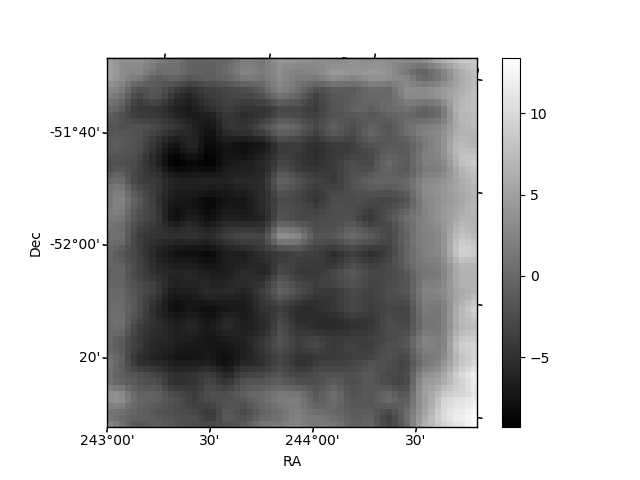
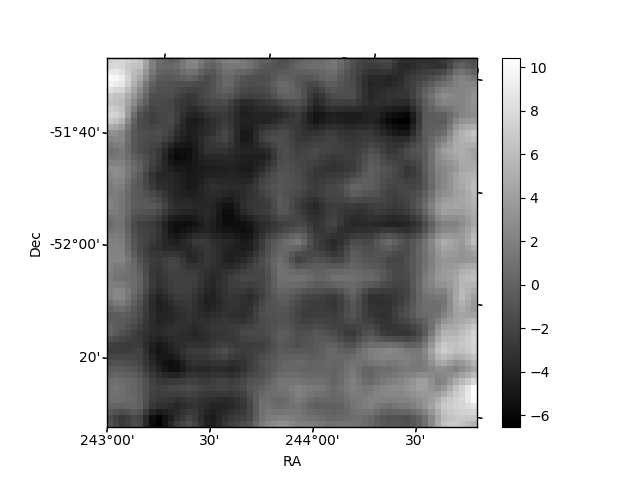
Histogram calculated using DETX and DETY for each event in the final _common_clean file
| Quadrant A | 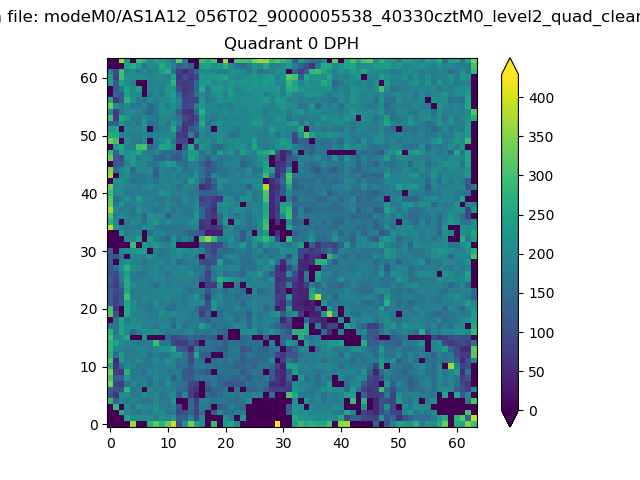 |
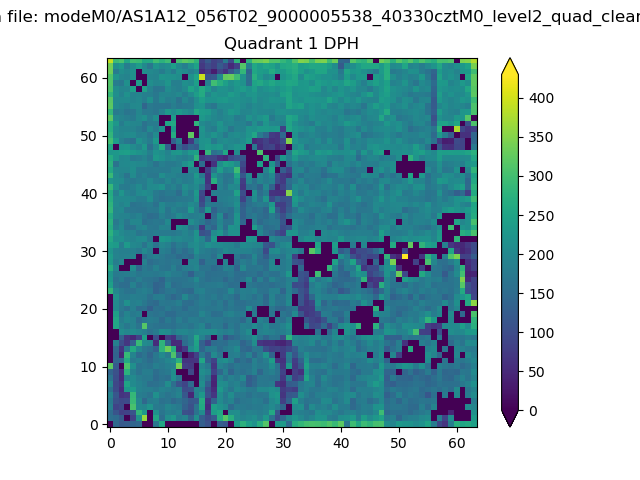 |
Quadrant B |
|---|---|---|---|
| Quadrant D | 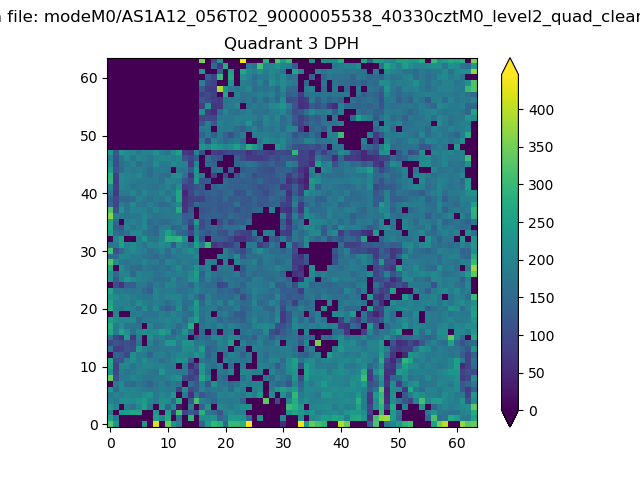 |
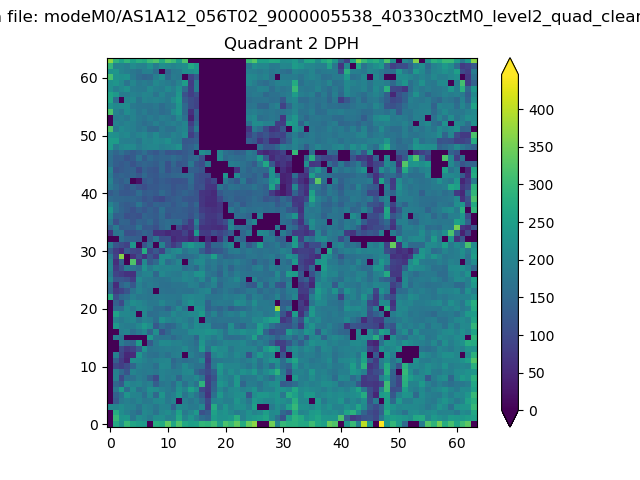 |
Quadrant C |
| Plot type | Count rate plots | Images |
|---|---|---|
| Comparison with Poisson distribution Blue bars denote a histogram of data divided into 1 sec bins. Red curve is a Poisson curve with rate = median count rate of data. |
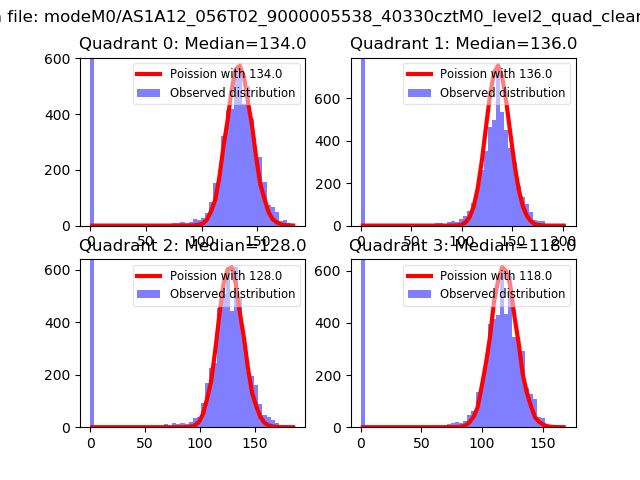 |
 |
| Quadrant-wise count rates Data is divided into 100 sec bins |
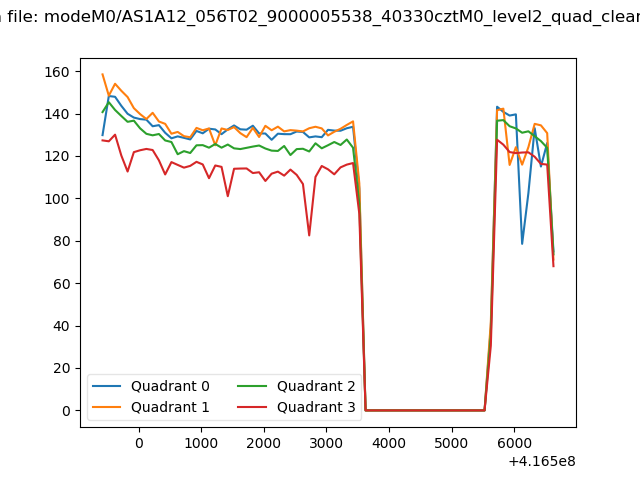 |
|
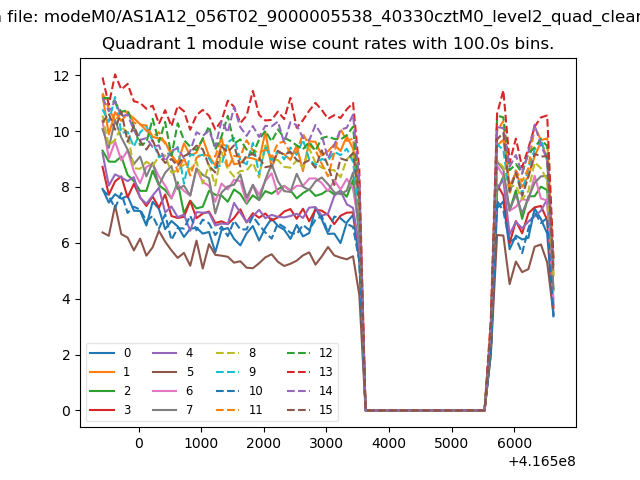
| Module-wise count rates for Quadrant A Data is divided into 100 sec bins |
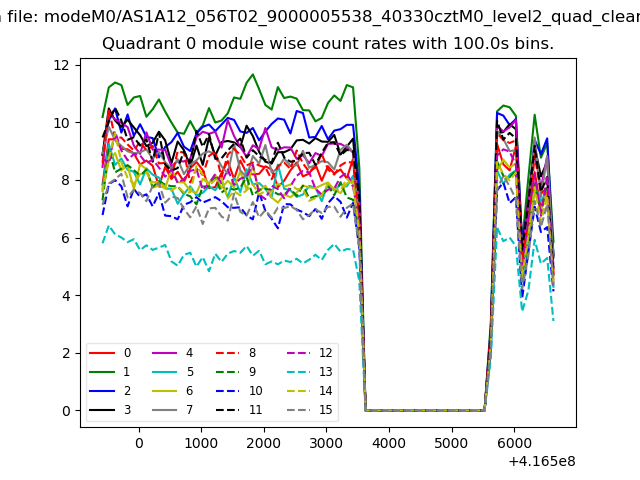 |
 |
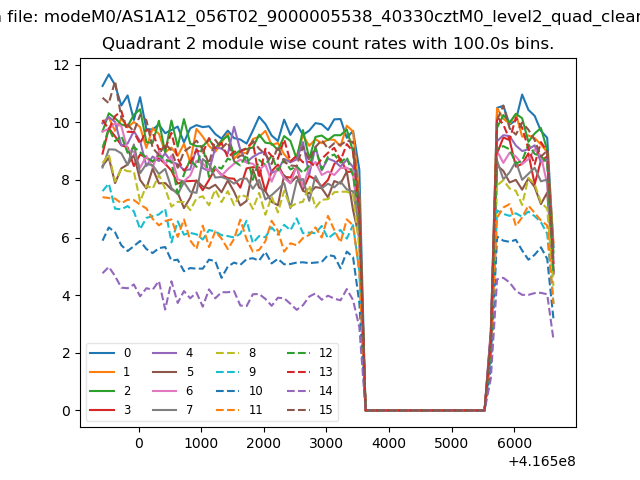
| Module-wise count rates for Quadrant B Data is divided into 100 sec bins |
 |
 |
| Module-wise count rates for Quadrant C Data is divided into 100 sec bins |
 |
 |
| Module-wise count rates for Quadrant D Data is divided into 100 sec bins |
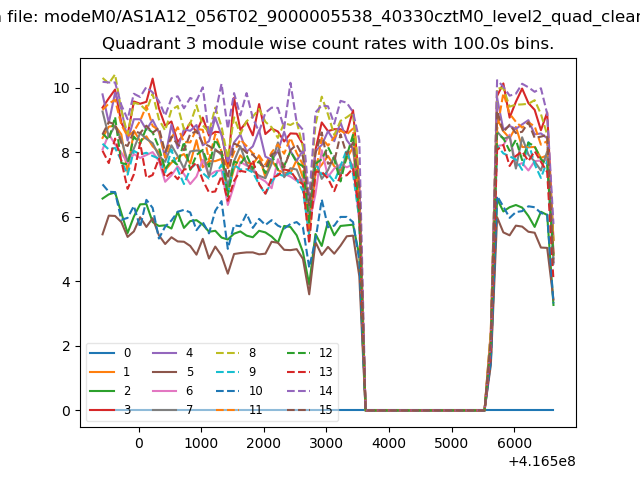 |
 |
| Parameter | Plot |
|---|---|
| CZT HV Monitor |  |
| D_VDD | 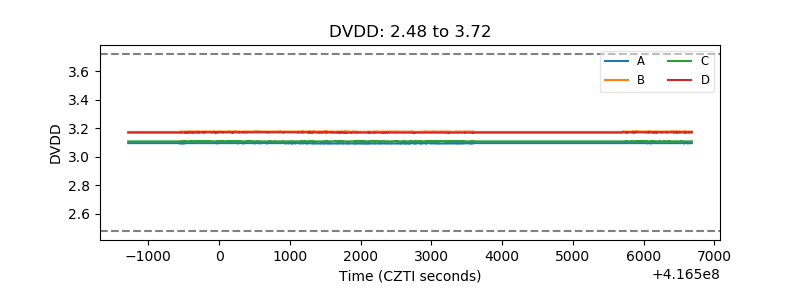 |
| Temperature 1 | 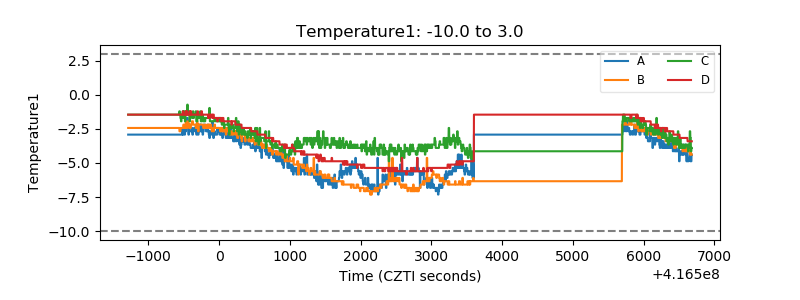 |
| Veto HV Monitor | 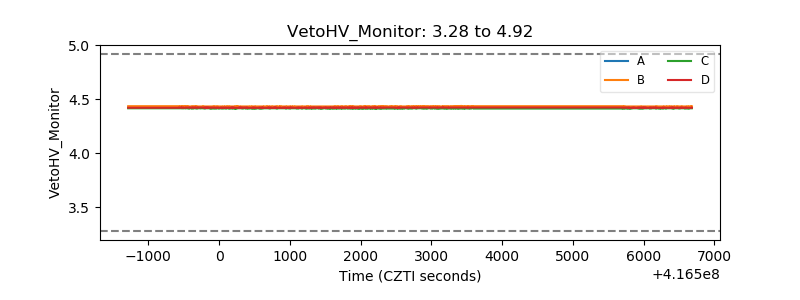 |
| Veto LLD | 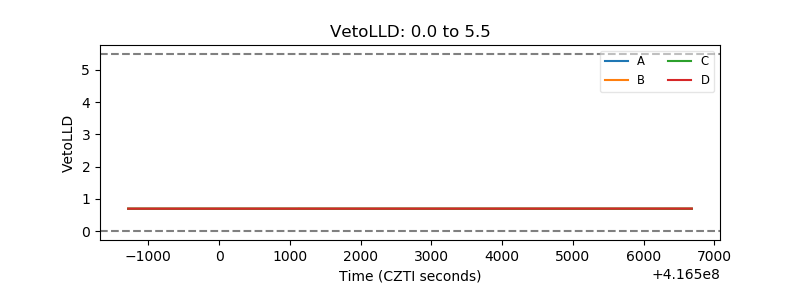 |
| Alpha Counter | 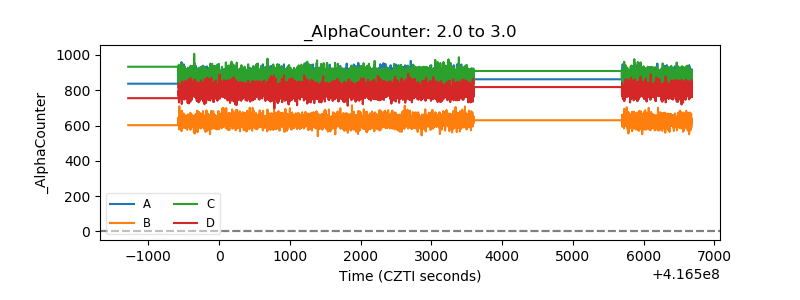 |
| _CPM_Rate | 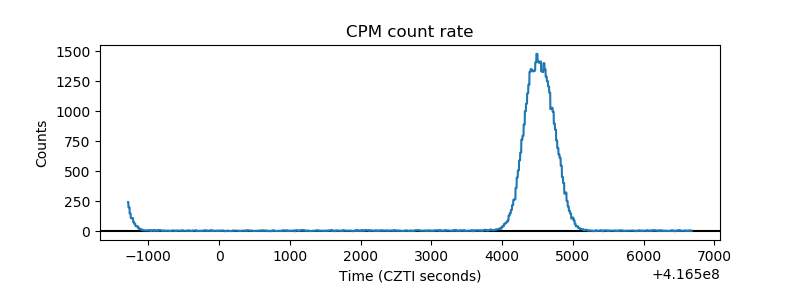 |
| CZT Counter | 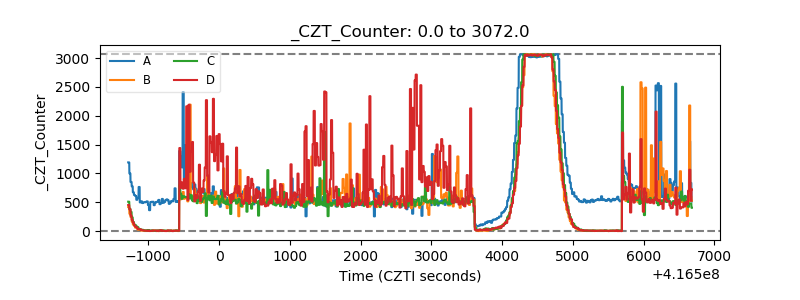 |
| +2.5 Volts monitor |  |
| +5 Volts monitor | 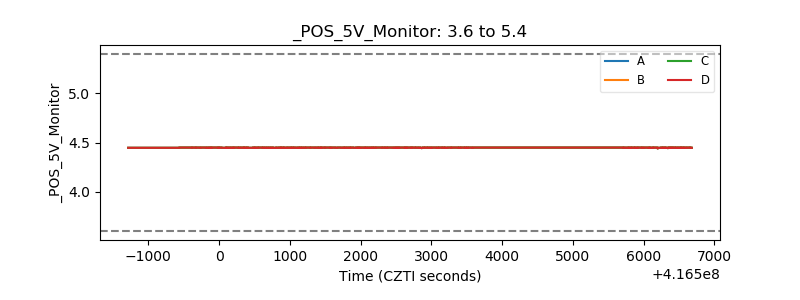 |
| _ROLL_ROT | 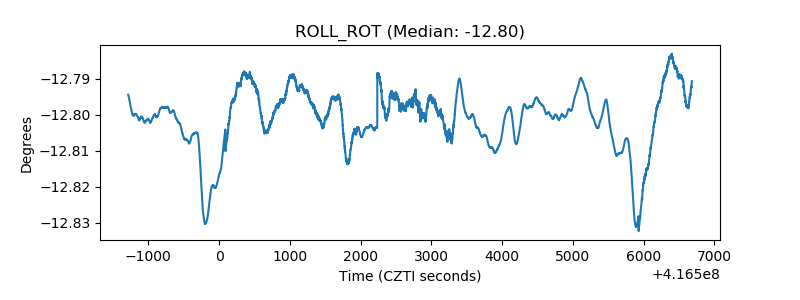 |
| _Roll_DEC | 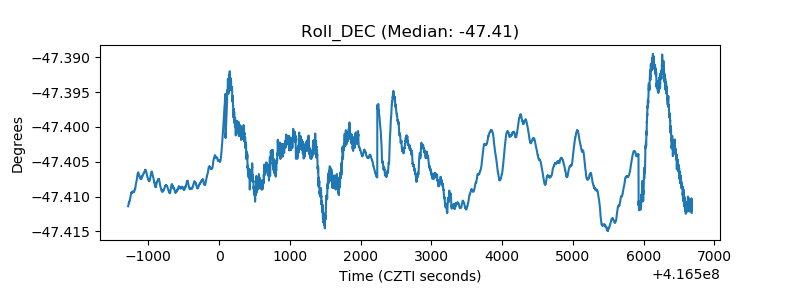 |
| _Roll_RA | 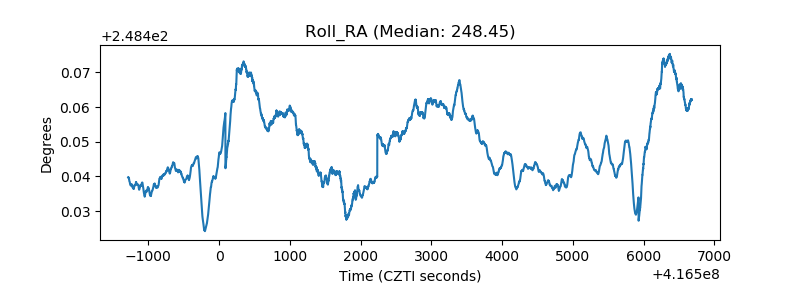 |
| Veto Counter | 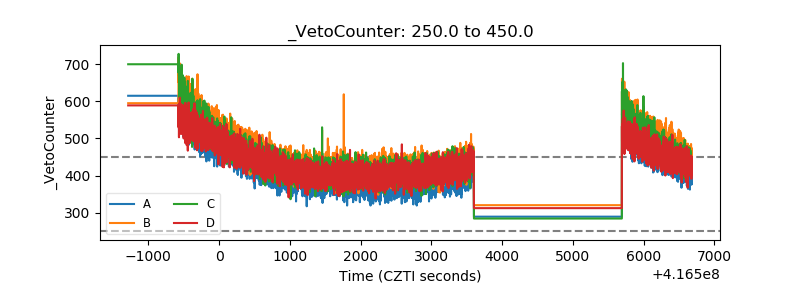 |