| Param | Original file | Final file |
|---|---|---|
| Filename | modeM0/AS1A12_056T02_9000005538_40331cztM0_level2.fits | modeM0/AS1A12_056T02_9000005538_40331cztM0_level2_quad_clean.evt |
| Size (bytes) | 341,282,880 | 90,014,400 |
| Size | 325.5 MB | 85.8 MB |
| Events in quadrant A | 3,508,535 | 608,948 |
| Events in quadrant B | 3,158,244 | 628,073 |
| Events in quadrant C | 2,523,105 | 601,857 |
| Events in quadrant D | 3,065,853 | 546,670 |
| Mode M0 | |||
|---|---|---|---|
| Quadrant | BADHDUFLAG | Total packets | Discarded packets |
| A | 0 | 13518 | 3 |
| B | 0 | 12530 | 2 |
| C | 0 | 10267 | 2 |
| D | 0 | 12267 | 2 |
| Mode M9 | |||
|---|---|---|---|
| Quadrant | BADHDUFLAG | Total packets | Discarded packets |
| A | 0 | 34 | 0 |
| B | 0 | 34 | 0 |
| C | 0 | 34 | 0 |
| D | 0 | 35 | 0 |
| Mode SS | |||
|---|---|---|---|
| Quadrant | BADHDUFLAG | Total packets | Discarded packets |
| A | 0 | 100 | 0 |
| B | 0 | 100 | 0 |
| C | 0 | 100 | 0 |
| D | 0 | 100 | 0 |
| Quadrant | Total seconds | Saturated seconds | Saturation percentage |
|---|---|---|---|
| A | 4848 | 239 | 4.929868% |
| B | 4848 | 155 | 3.197195% |
| C | 4848 | 11 | 0.226898% |
| D | 4848 | 120 | 2.475248% |
Noise dominated data is calculated using 1-second bins in cleaned event files. If a bin has >2000 counts, and if more than 50% of those come from <1% of pixels, then it is considered to be noise-dominated and hence unusable.
| Quadrant | # 1 sec bins | Bins with >0 counts | Bins with >2000 counts | High rate bins dominated by noise | Noise dominated (total time) | Noise dominated (detector-on time) | Marked lightcurve |
|---|---|---|---|---|---|---|---|
| A | 6971 | 4849 | 214 | 214 | 3.07% | 4.41% | 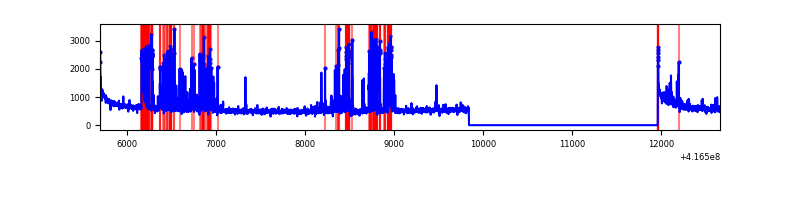 |
| B | 6971 | 4849 | 118 | 118 | 1.69% | 2.43% | 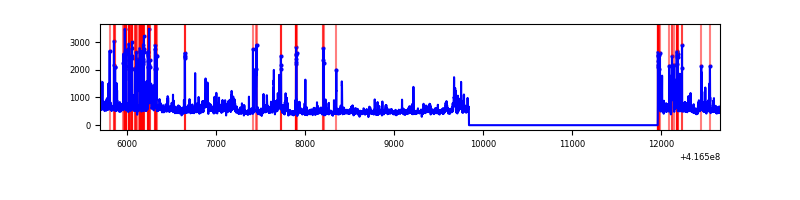 |
| C | 6971 | 4849 | 10 | 10 | 0.14% | 0.21% | 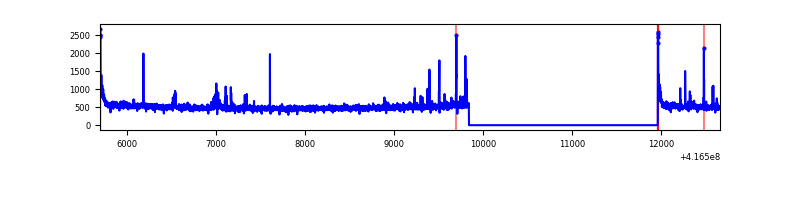 |
| D | 6970 | 4848 | 119 | 119 | 1.71% | 2.45% | 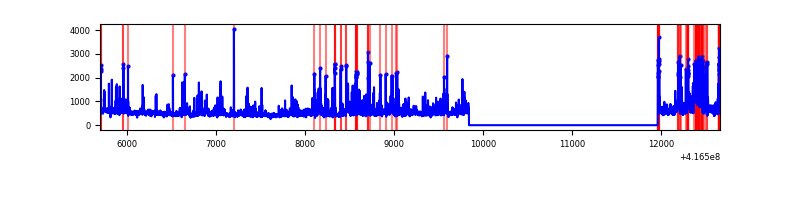 |
Top three noisy pixels from each quadrant. If the there are fewer than three noisy pixels in the level2.evt file, extra rows are filled as -1
| Pixel properties | Quadrant properties | ||||||
|---|---|---|---|---|---|---|---|
| Quadrant | DetID | PixID | Counts | Sigma | Mean | Median | Sigma |
| A | 13 | 248 | 814922 | 7072.05 | 567 | 557 | 115.2 |
| A | 10 | 83 | 448042 | 3886.02 | 567 | 557 | 115.2 |
| A | 12 | 189 | 18269 | 153.81 | 567 | 557 | 115.2 |
| B | 3 | 112 | 323528 | 2974.85 | 569 | 555 | 108.6 |
| B | 4 | 171 | 248377 | 2282.64 | 569 | 555 | 108.6 |
| B | 0 | 245 | 149190 | 1369.05 | 569 | 555 | 108.6 |
| C | 15 | 214 | 221357 | 1719.3 | 557 | 562 | 128.4 |
| C | 14 | 254 | 67782 | 523.43 | 557 | 562 | 128.4 |
| C | 0 | 10 | 55646 | 428.93 | 557 | 562 | 128.4 |
| D | 12 | 227 | 699017 | 5280.5 | 548 | 534 | 132.3 |
| D | 12 | 79 | 89898 | 675.59 | 548 | 534 | 132.3 |
| D | 3 | 14 | 52521 | 393.02 | 548 | 534 | 132.3 |
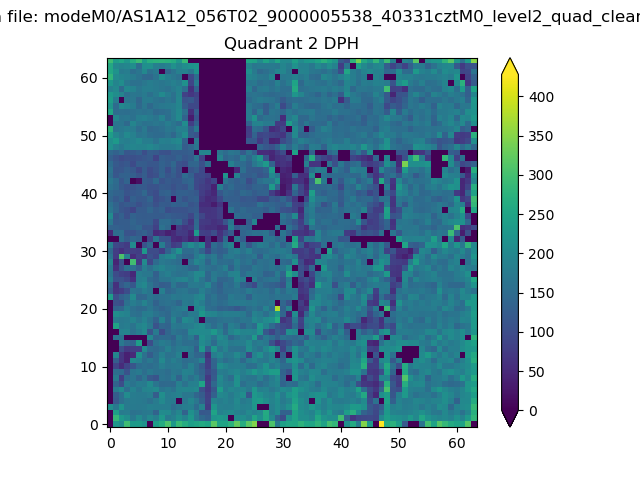
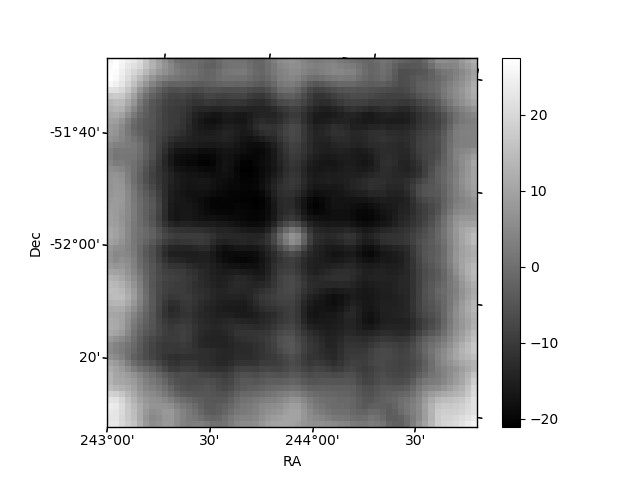
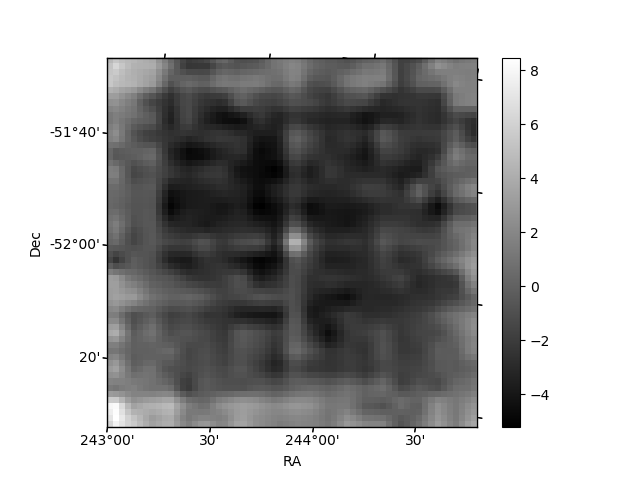
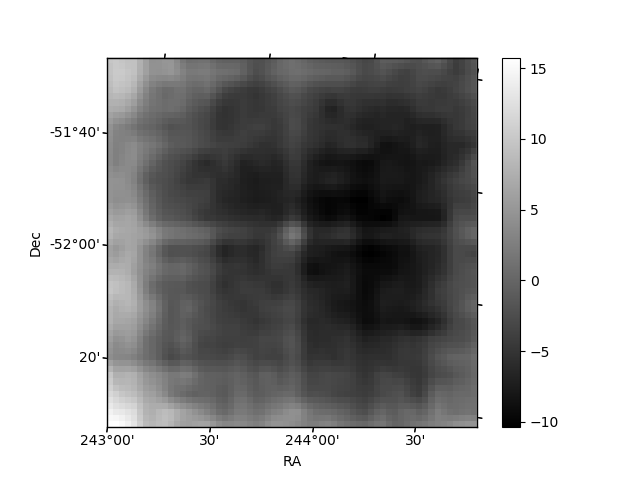
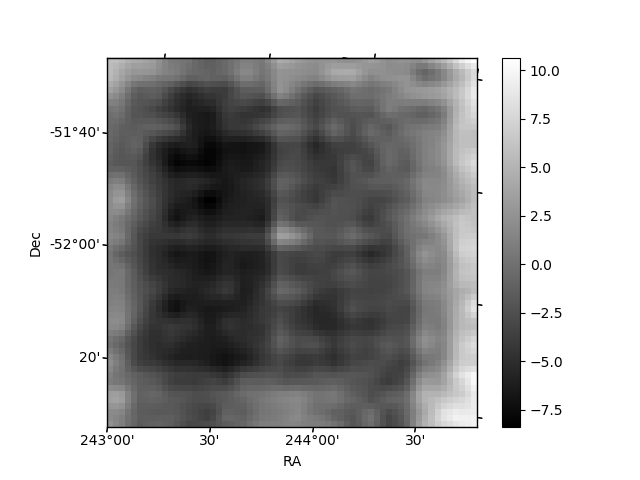
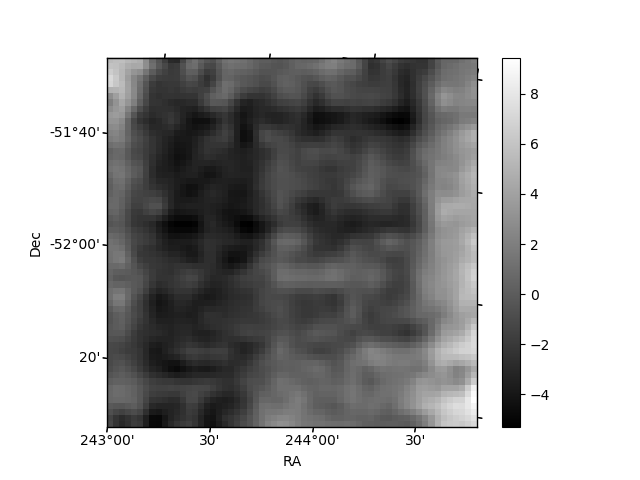
Histogram calculated using DETX and DETY for each event in the final _common_clean file
| Quadrant A | 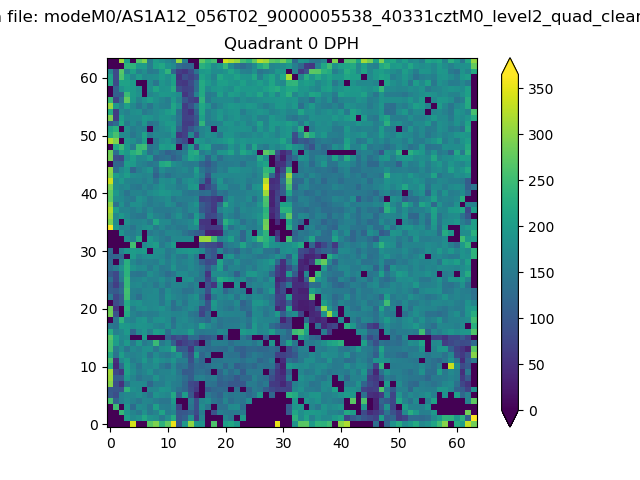 |
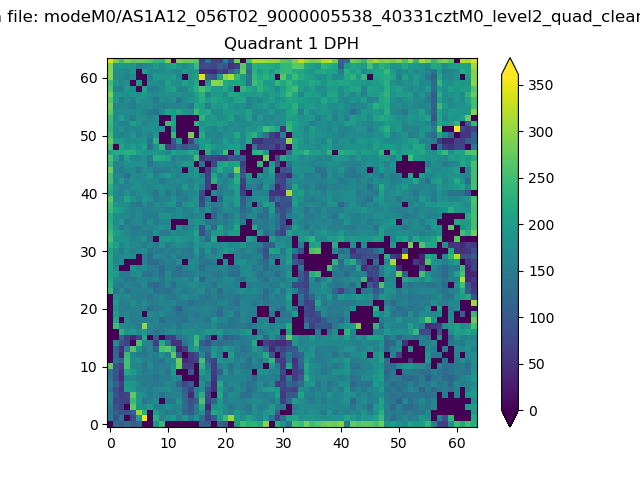 |
Quadrant B |
|---|---|---|---|
| Quadrant D | 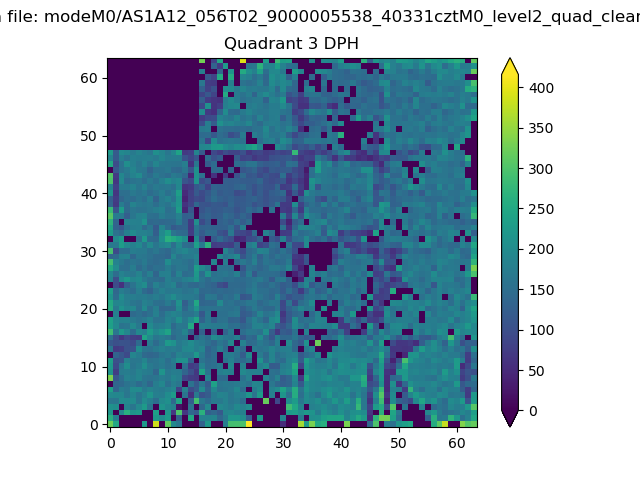 |
 |
Quadrant C |
| Plot type | Count rate plots | Images |
|---|---|---|
| Comparison with Poisson distribution Blue bars denote a histogram of data divided into 1 sec bins. Red curve is a Poisson curve with rate = median count rate of data. |
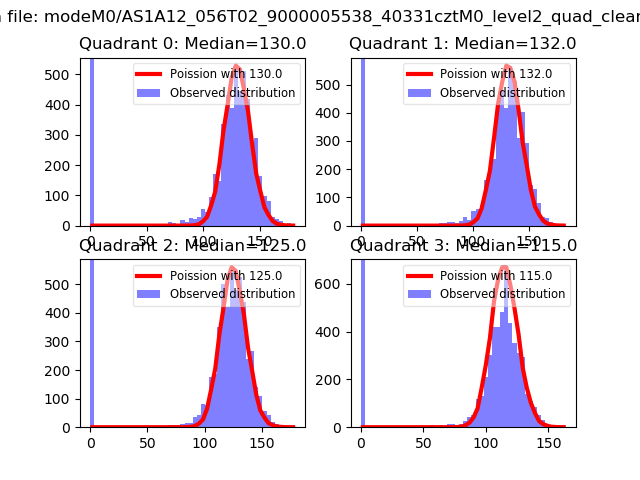 |
 |
| Quadrant-wise count rates Data is divided into 100 sec bins |
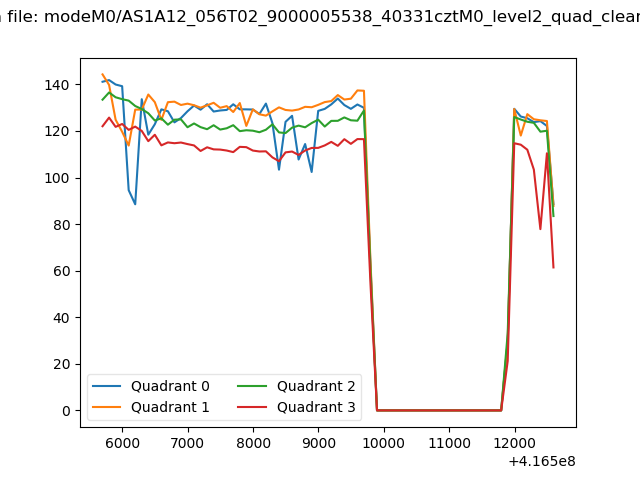 |
|
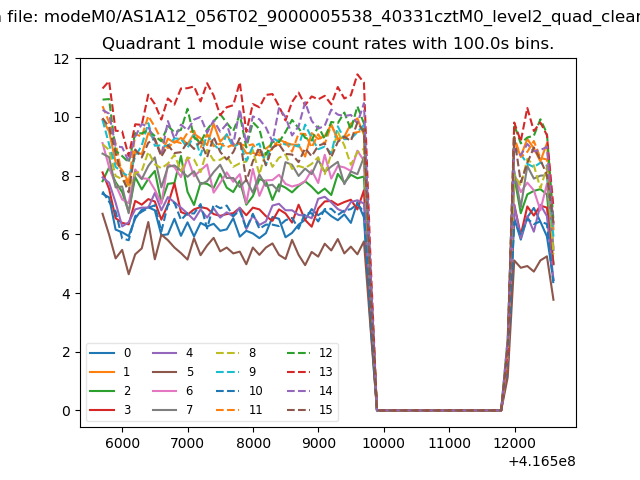
| Module-wise count rates for Quadrant A Data is divided into 100 sec bins |
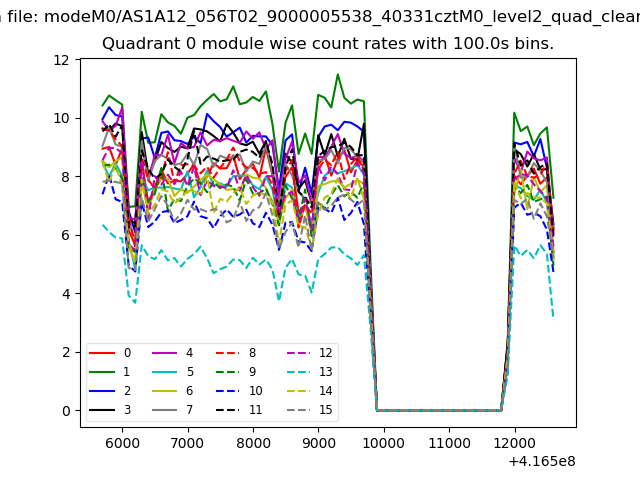 |
 |
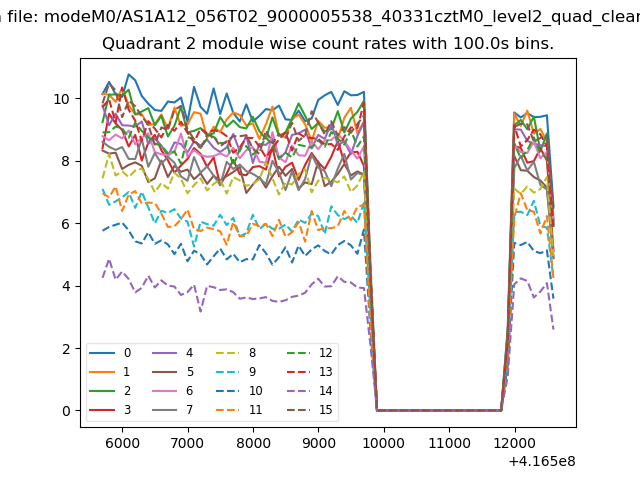
| Module-wise count rates for Quadrant B Data is divided into 100 sec bins |
 |
 |
| Module-wise count rates for Quadrant C Data is divided into 100 sec bins |
 |
 |
| Module-wise count rates for Quadrant D Data is divided into 100 sec bins |
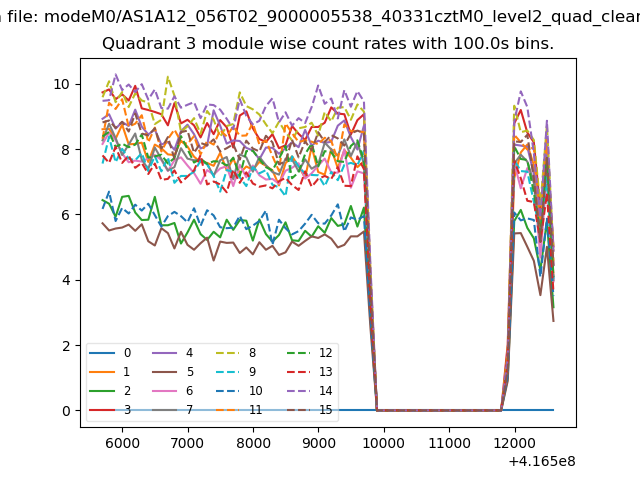 |
 |
| Parameter | Plot |
|---|---|
| CZT HV Monitor | 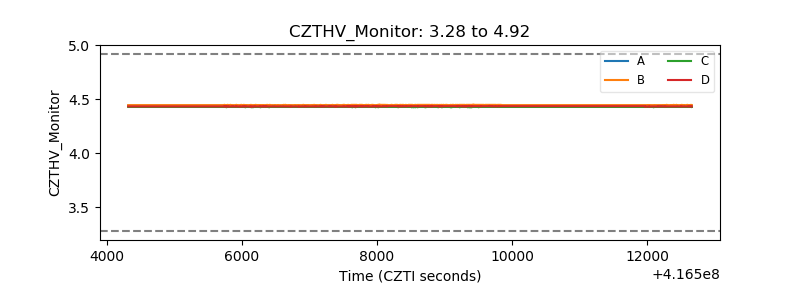 |
| D_VDD | 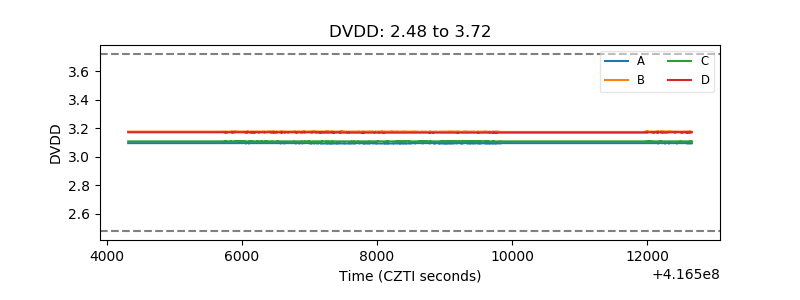 |
| Temperature 1 | 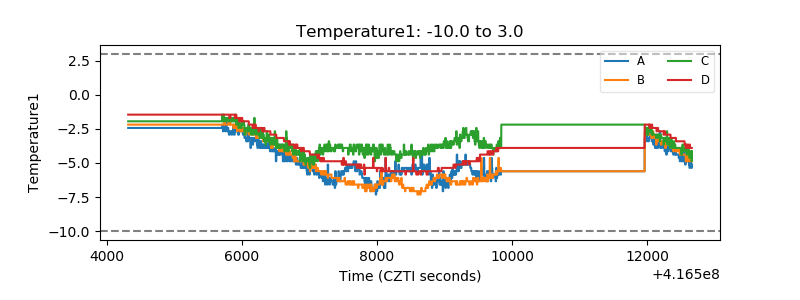 |
| Veto HV Monitor | 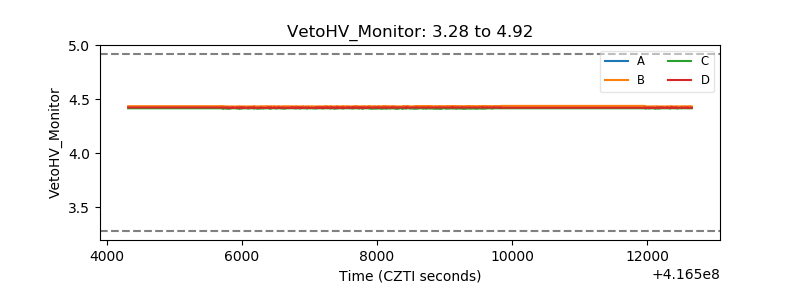 |
| Veto LLD | 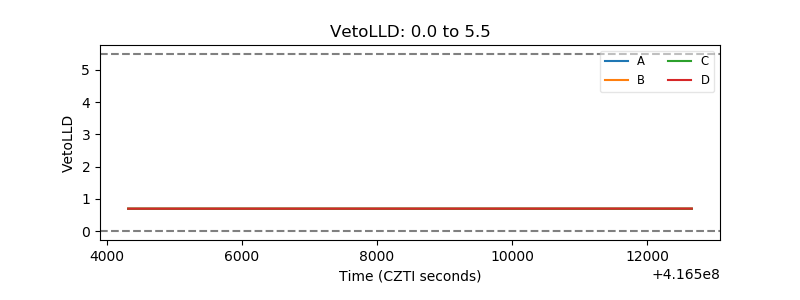 |
| Alpha Counter | 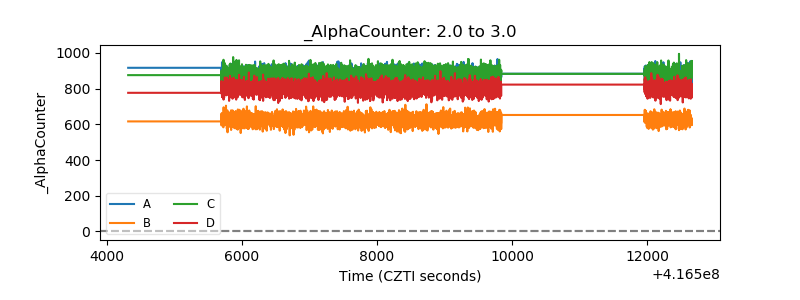 |
| _CPM_Rate | 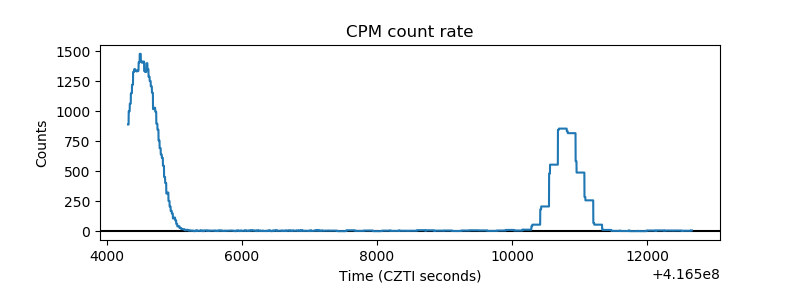 |
| CZT Counter | 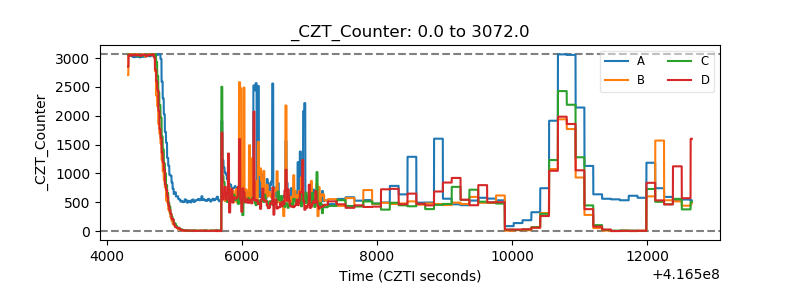 |
| +2.5 Volts monitor | 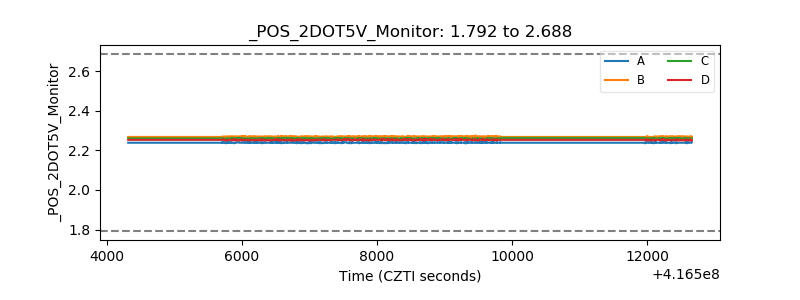 |
| +5 Volts monitor | 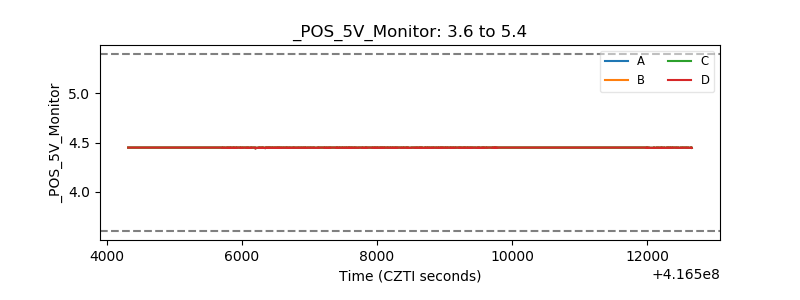 |
| _ROLL_ROT | 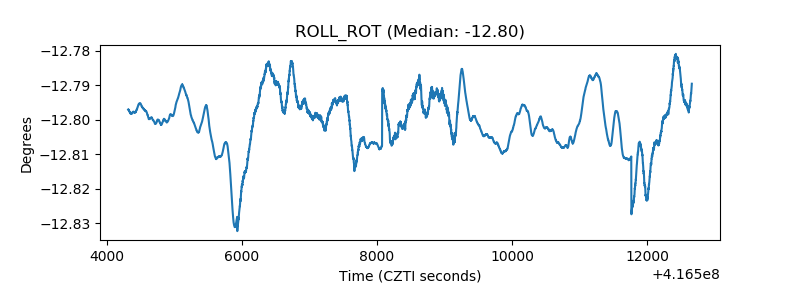 |
| _Roll_DEC | 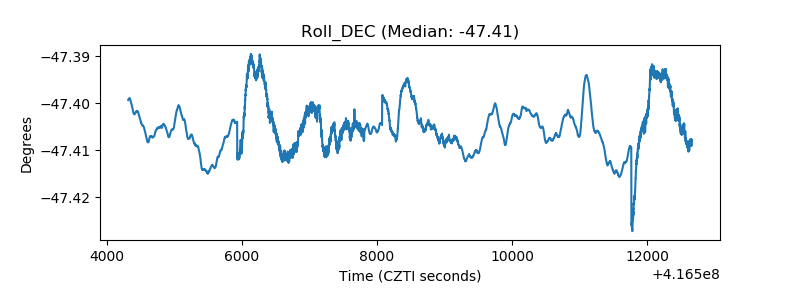 |
| _Roll_RA | 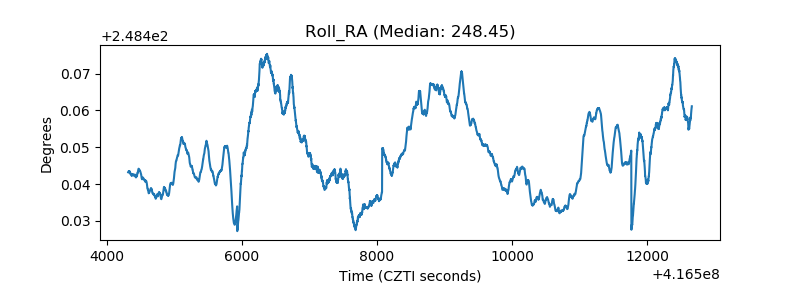 |
| Veto Counter | 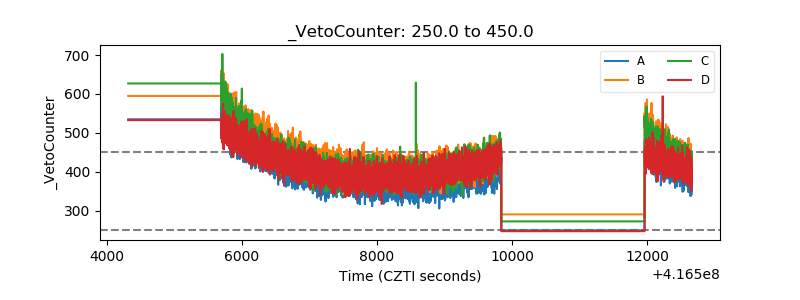 |