| Param | Original file | Final file |
|---|---|---|
| Filename | modeM0/AS1A12_056T02_9000005538_40332cztM0_level2.fits | modeM0/AS1A12_056T02_9000005538_40332cztM0_level2_quad_clean.evt |
| Size (bytes) | 330,226,560 | 86,057,280 |
| Size | 314.9 MB | 82.1 MB |
| Events in quadrant A | 2,928,859 | 596,136 |
| Events in quadrant B | 2,828,144 | 602,507 |
| Events in quadrant C | 2,486,464 | 574,043 |
| Events in quadrant D | 3,603,772 | 494,143 |
| Mode M0 | |||
|---|---|---|---|
| Quadrant | BADHDUFLAG | Total packets | Discarded packets |
| A | 0 | 11648 | 3 |
| B | 0 | 11503 | 2 |
| C | 0 | 10218 | 2 |
| D | 0 | 14046 | 2 |
| Mode M9 | |||
|---|---|---|---|
| Quadrant | BADHDUFLAG | Total packets | Discarded packets |
| A | 0 | 39 | 0 |
| B | 0 | 39 | 0 |
| C | 0 | 39 | 0 |
| D | 0 | 40 | 0 |
| Mode SS | |||
|---|---|---|---|
| Quadrant | BADHDUFLAG | Total packets | Discarded packets |
| A | 0 | 98 | 0 |
| B | 0 | 98 | 0 |
| C | 0 | 98 | 0 |
| D | 0 | 98 | 0 |
| Quadrant | Total seconds | Saturated seconds | Saturation percentage |
|---|---|---|---|
| A | 4835 | 49 | 1.013444% |
| B | 4835 | 94 | 1.944157% |
| C | 4835 | 16 | 0.330920% |
| D | 4835 | 367 | 7.590486% |
Noise dominated data is calculated using 1-second bins in cleaned event files. If a bin has >2000 counts, and if more than 50% of those come from <1% of pixels, then it is considered to be noise-dominated and hence unusable.
| Quadrant | # 1 sec bins | Bins with >0 counts | Bins with >2000 counts | High rate bins dominated by noise | Noise dominated (total time) | Noise dominated (detector-on time) | Marked lightcurve |
|---|---|---|---|---|---|---|---|
| A | 6928 | 4836 | 42 | 42 | 0.61% | 0.87% | 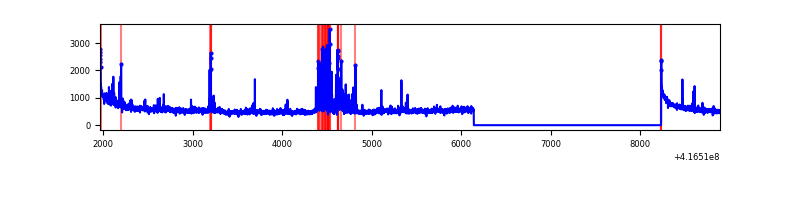 |
| B | 6928 | 4836 | 68 | 68 | 0.98% | 1.41% | 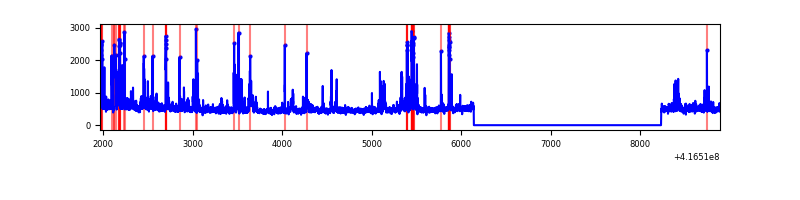 |
| C | 6928 | 4836 | 18 | 18 | 0.26% | 0.37% | 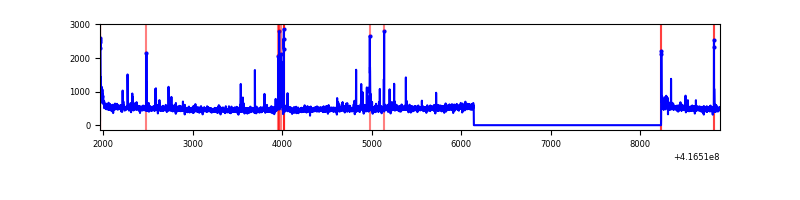 |
| D | 6928 | 4835 | 355 | 355 | 5.12% | 7.34% | 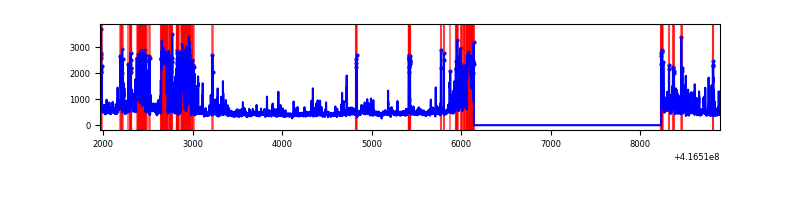 |
Top three noisy pixels from each quadrant. If the there are fewer than three noisy pixels in the level2.evt file, extra rows are filled as -1
| Pixel properties | Quadrant properties | ||||||
|---|---|---|---|---|---|---|---|
| Quadrant | DetID | PixID | Counts | Sigma | Mean | Median | Sigma |
| A | 10 | 83 | 440141 | 3906.33 | 551 | 542 | 112.5 |
| A | 13 | 248 | 250048 | 2217.14 | 551 | 542 | 112.5 |
| A | 6 | 10 | 87233 | 770.35 | 551 | 542 | 112.5 |
| B | 5 | 255 | 227394 | 2161.83 | 550 | 536 | 104.9 |
| B | 4 | 171 | 220757 | 2098.59 | 550 | 536 | 104.9 |
| B | 0 | 245 | 113973 | 1080.99 | 550 | 536 | 104.9 |
| C | 15 | 214 | 224095 | 1778.95 | 539 | 543 | 125.7 |
| C | 14 | 254 | 114696 | 908.39 | 539 | 543 | 125.7 |
| C | 0 | 10 | 37164 | 291.42 | 539 | 543 | 125.7 |
| D | 12 | 227 | 913560 | 7277.41 | 514 | 501 | 125.5 |
| D | 1 | 47 | 250791 | 1994.9 | 514 | 501 | 125.5 |
| D | 12 | 79 | 133060 | 1056.54 | 514 | 501 | 125.5 |
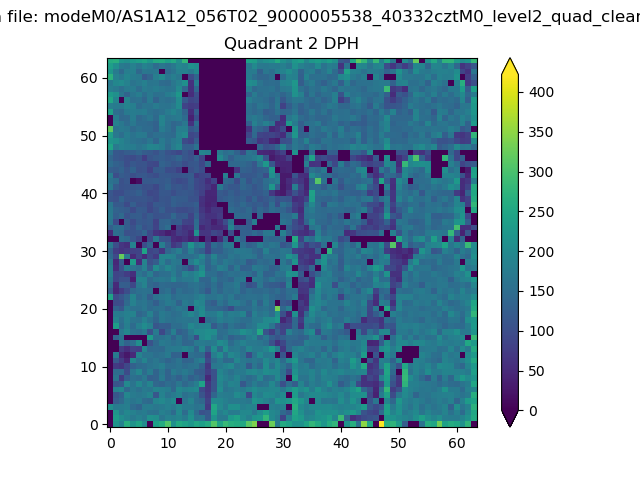
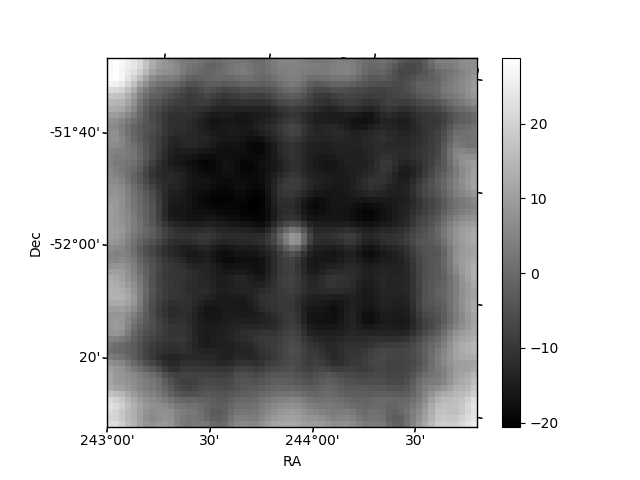
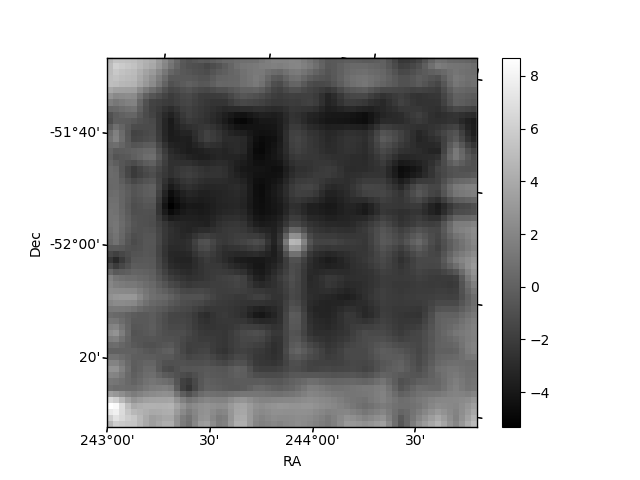
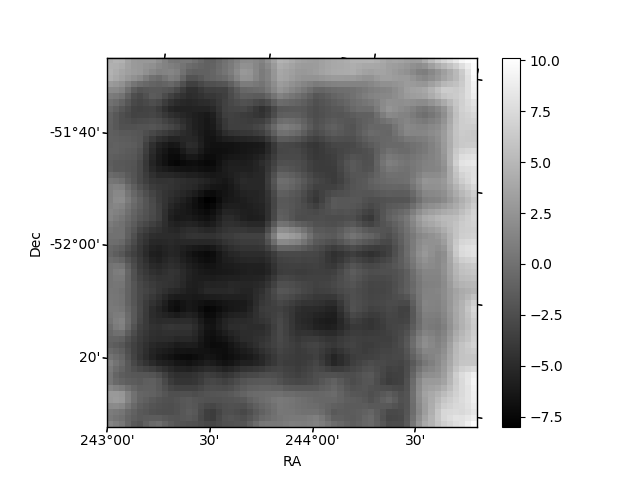
Histogram calculated using DETX and DETY for each event in the final _common_clean file
| Quadrant A | 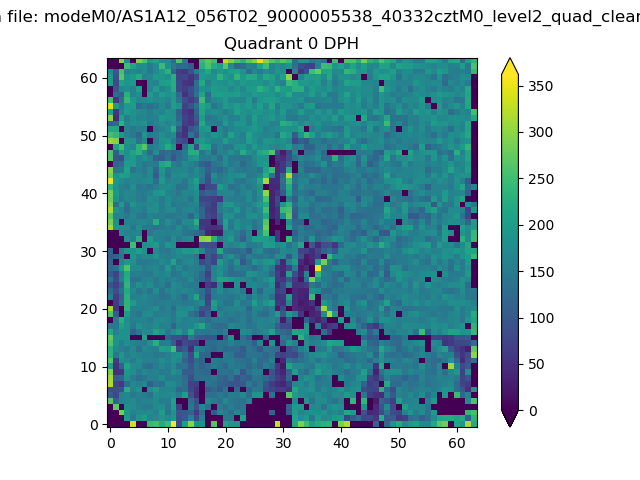 |
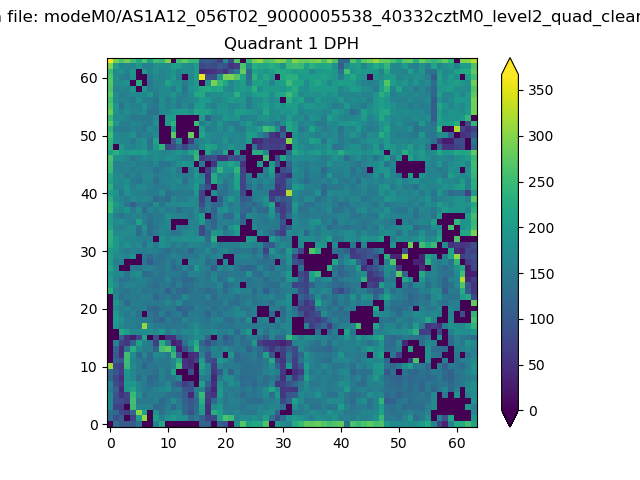 |
Quadrant B |
|---|---|---|---|
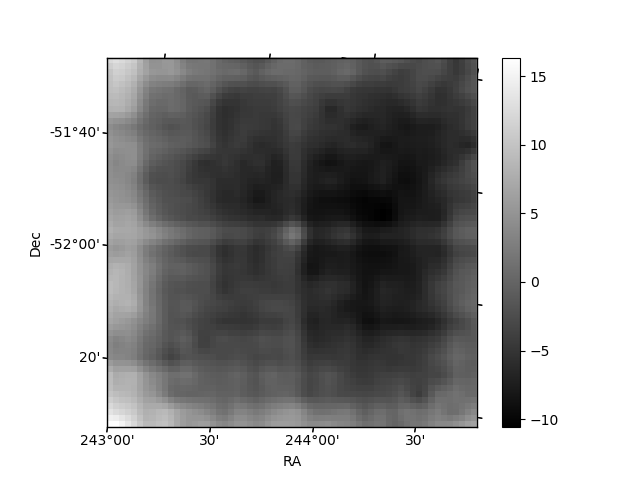
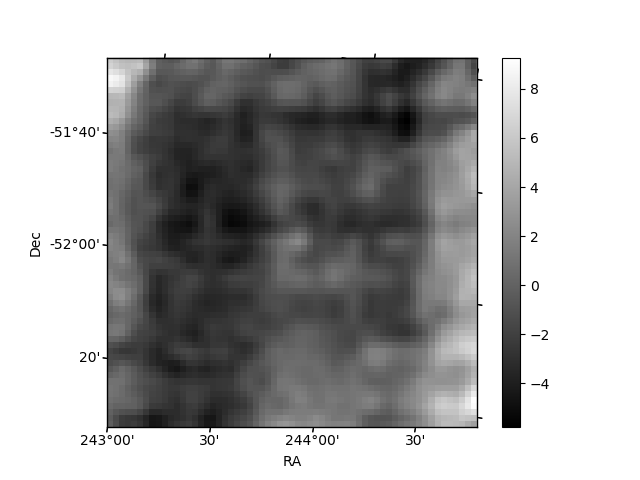
| Quadrant D | 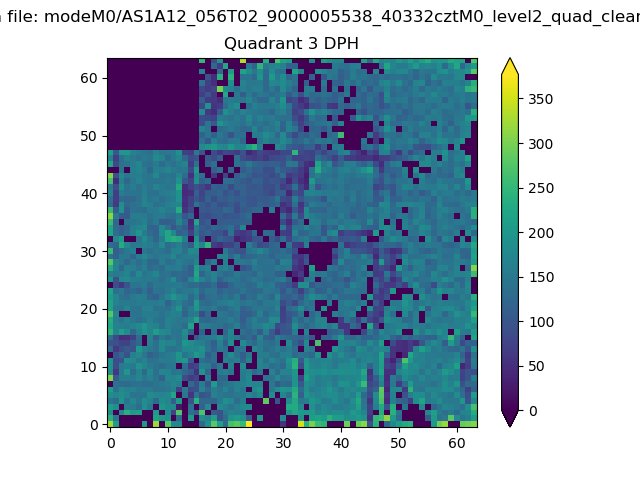 |
 |
Quadrant C |
| Plot type | Count rate plots | Images |
|---|---|---|
| Comparison with Poisson distribution Blue bars denote a histogram of data divided into 1 sec bins. Red curve is a Poisson curve with rate = median count rate of data. |
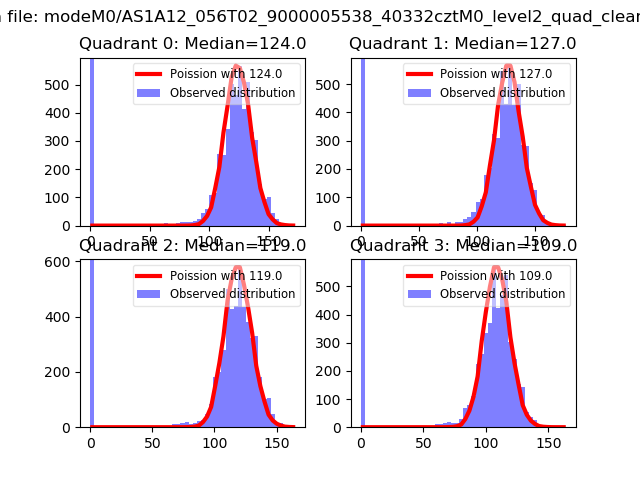 |
 |
| Quadrant-wise count rates Data is divided into 100 sec bins |
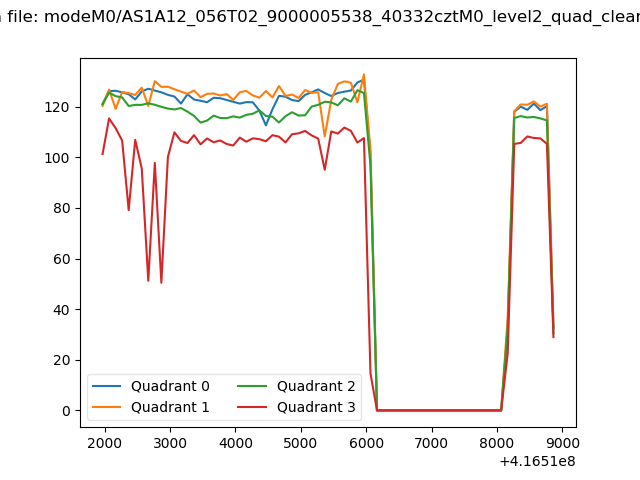 |
|
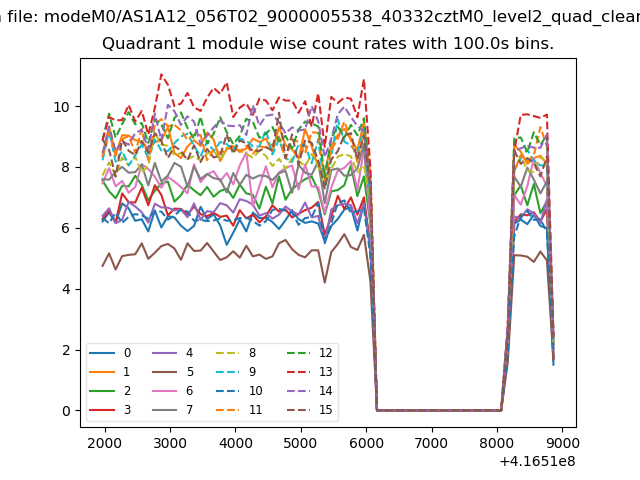
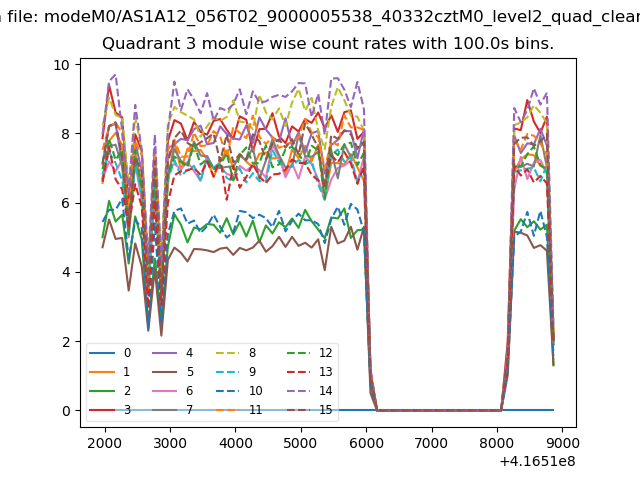
| Module-wise count rates for Quadrant A Data is divided into 100 sec bins |
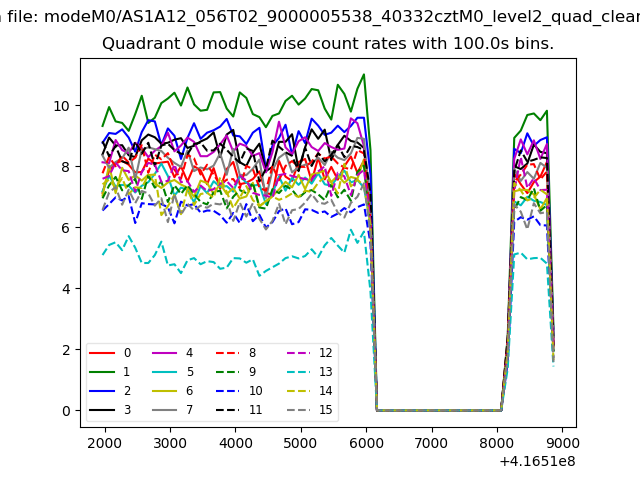 |
 |
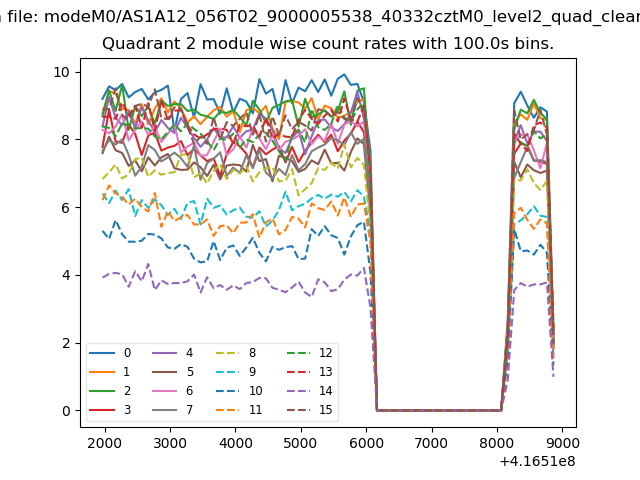
| Module-wise count rates for Quadrant B Data is divided into 100 sec bins |
 |
 |
| Module-wise count rates for Quadrant C Data is divided into 100 sec bins |
 |
 |
| Module-wise count rates for Quadrant D Data is divided into 100 sec bins |
 |
 |
| Parameter | Plot |
|---|---|
| CZT HV Monitor | 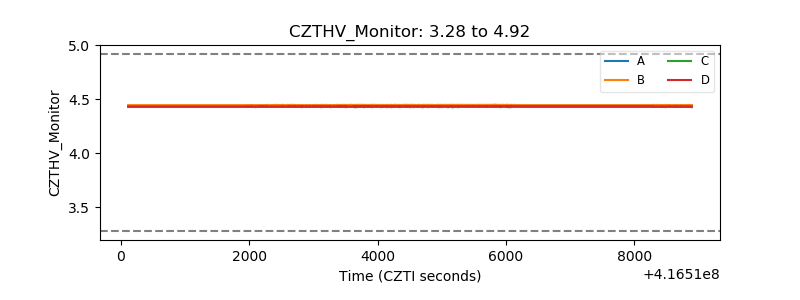 |
| D_VDD | 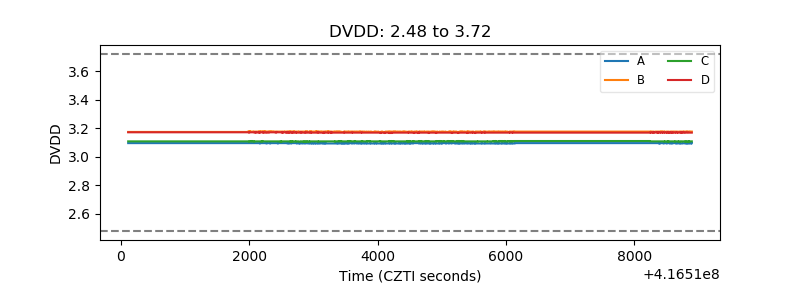 |
| Temperature 1 | 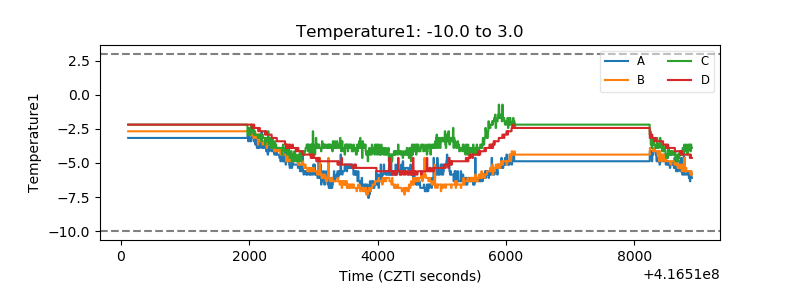 |
| Veto HV Monitor |  |
| Veto LLD | 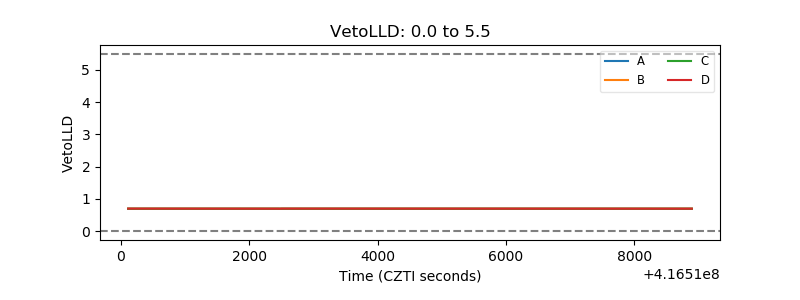 |
| Alpha Counter | 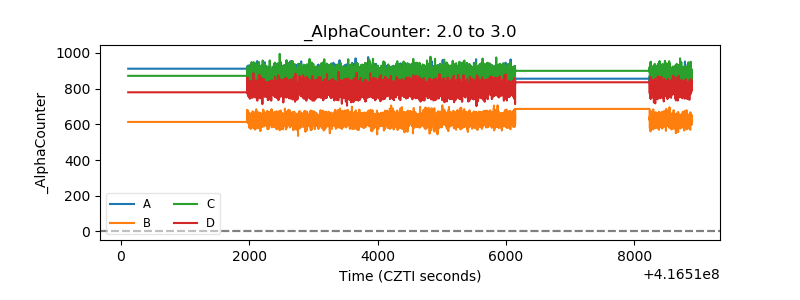 |
| _CPM_Rate | 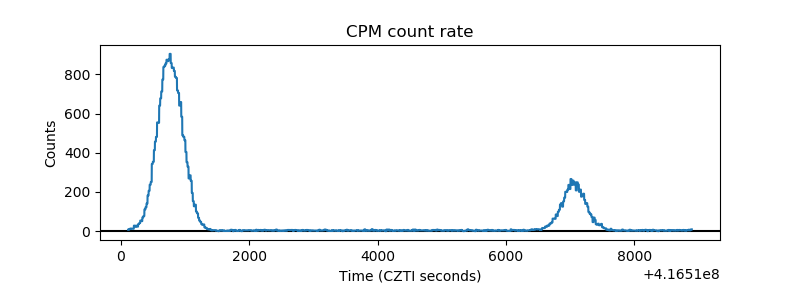 |
| CZT Counter | 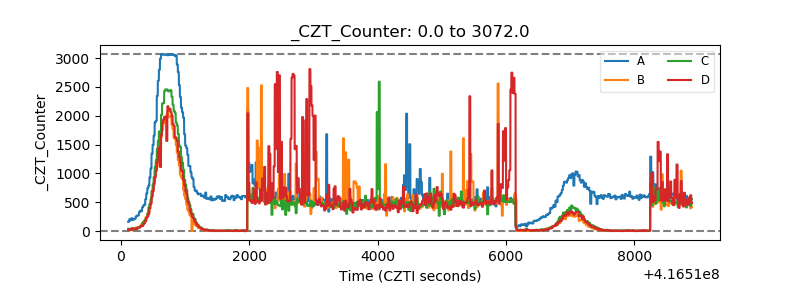 |
| +2.5 Volts monitor | 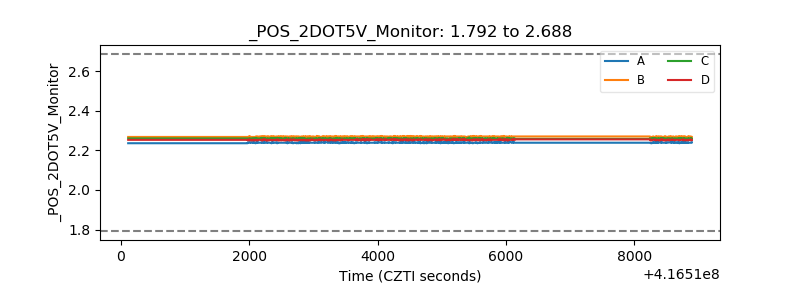 |
| +5 Volts monitor | 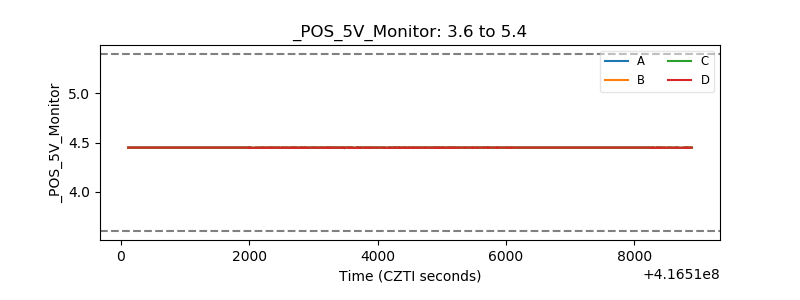 |
| _ROLL_ROT | 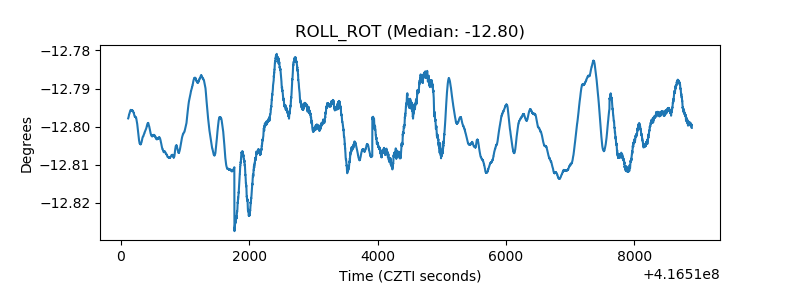 |
| _Roll_DEC | 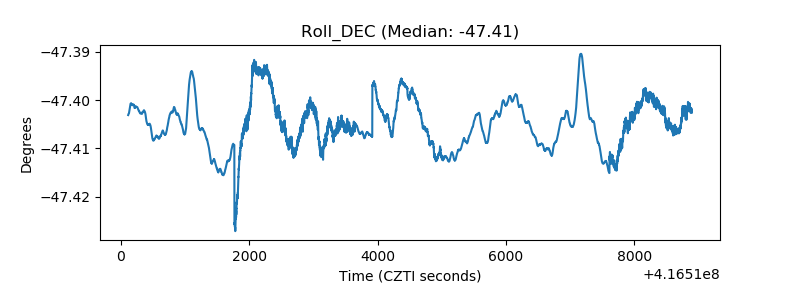 |
| _Roll_RA | 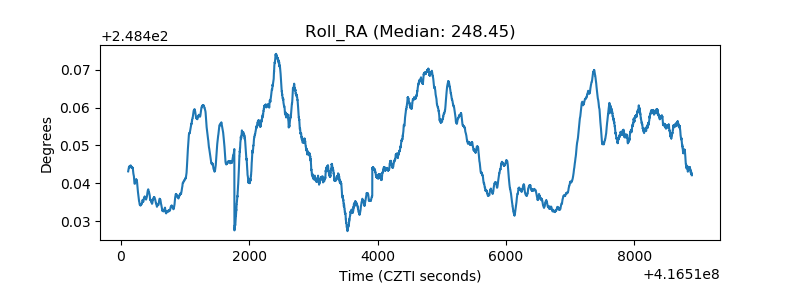 |
| Veto Counter | 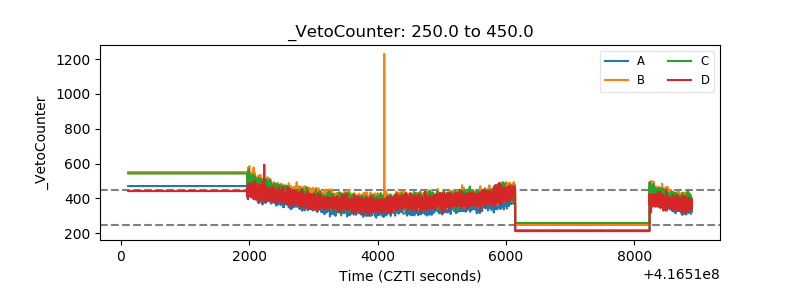 |