| Param | Original file | Final file |
|---|---|---|
| Filename | modeM0/AS1A12_056T02_9000005538_40333cztM0_level2.fits | modeM0/AS1A12_056T02_9000005538_40333cztM0_level2_quad_clean.evt |
| Size (bytes) | 372,672,000 | 86,448,960 |
| Size | 355.4 MB | 82.4 MB |
| Events in quadrant A | 2,998,494 | 618,186 |
| Events in quadrant B | 4,096,350 | 509,343 |
| Events in quadrant C | 2,656,519 | 598,506 |
| Events in quadrant D | 3,637,559 | 526,450 |
| Mode M0 | |||
|---|---|---|---|
| Quadrant | BADHDUFLAG | Total packets | Discarded packets |
| A | 0 | 12099 | 3 |
| B | 0 | 15695 | 2 |
| C | 0 | 11030 | 2 |
| D | 0 | 14433 | 2 |
| Mode M9 | |||
|---|---|---|---|
| Quadrant | BADHDUFLAG | Total packets | Discarded packets |
| A | 0 | 29 | 0 |
| B | 0 | 29 | 0 |
| C | 0 | 29 | 0 |
| D | 0 | 30 | 0 |
| Mode SS | |||
|---|---|---|---|
| Quadrant | BADHDUFLAG | Total packets | Discarded packets |
| A | 0 | 108 | 0 |
| B | 0 | 108 | 0 |
| C | 0 | 108 | 0 |
| D | 0 | 108 | 0 |
| Quadrant | Total seconds | Saturated seconds | Saturation percentage |
|---|---|---|---|
| A | 5209 | 38 | 0.729507% |
| B | 5209 | 1045 | 20.061432% |
| C | 5209 | 19 | 0.364753% |
| D | 5209 | 249 | 4.780188% |
Noise dominated data is calculated using 1-second bins in cleaned event files. If a bin has >2000 counts, and if more than 50% of those come from <1% of pixels, then it is considered to be noise-dominated and hence unusable.
| Quadrant | # 1 sec bins | Bins with >0 counts | Bins with >2000 counts | High rate bins dominated by noise | Noise dominated (total time) | Noise dominated (detector-on time) | Marked lightcurve |
|---|---|---|---|---|---|---|---|
| A | 7092 | 5210 | 35 | 35 | 0.49% | 0.67% | 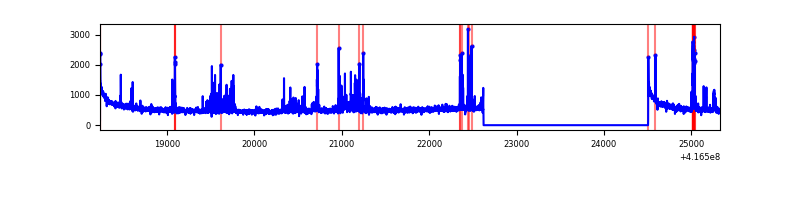 |
| B | 7091 | 5209 | 333 | 333 | 4.70% | 6.39% | 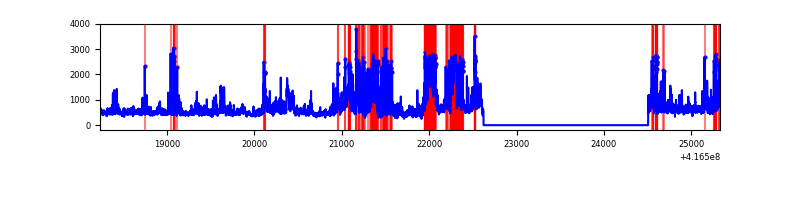 |
| C | 7092 | 5210 | 16 | 16 | 0.23% | 0.31% | 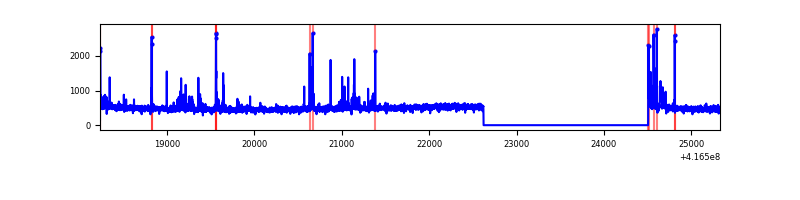 |
| D | 7092 | 5210 | 260 | 260 | 3.67% | 4.99% | 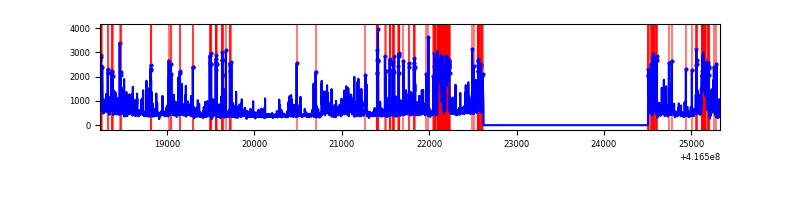 |
Top three noisy pixels from each quadrant. If the there are fewer than three noisy pixels in the level2.evt file, extra rows are filled as -1
| Pixel properties | Quadrant properties | ||||||
|---|---|---|---|---|---|---|---|
| Quadrant | DetID | PixID | Counts | Sigma | Mean | Median | Sigma |
| A | 10 | 83 | 454269 | 3843.91 | 579 | 569 | 118.0 |
| A | 13 | 248 | 242130 | 2046.59 | 579 | 569 | 118.0 |
| A | 6 | 10 | 30164 | 250.74 | 579 | 569 | 118.0 |
| B | 5 | 255 | 1286292 | 13766.22 | 481 | 468 | 93.4 |
| B | 4 | 171 | 867112 | 9278.42 | 481 | 468 | 93.4 |
| B | 0 | 230 | 27382 | 288.15 | 481 | 468 | 93.4 |
| C | 15 | 214 | 242589 | 1811.47 | 570 | 574 | 133.6 |
| C | 14 | 254 | 172991 | 1290.53 | 570 | 574 | 133.6 |
| C | 0 | 10 | 19270 | 139.94 | 570 | 574 | 133.6 |
| D | 12 | 227 | 909130 | 6643.23 | 552 | 537 | 136.8 |
| D | 1 | 47 | 177017 | 1290.34 | 552 | 537 | 136.8 |
| D | 12 | 128 | 110638 | 805.01 | 552 | 537 | 136.8 |
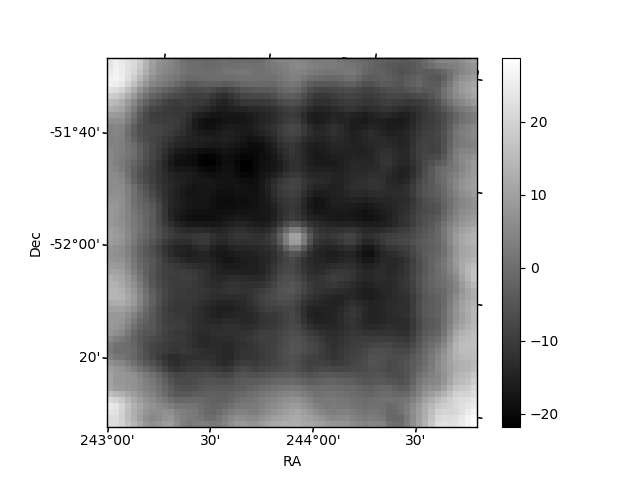
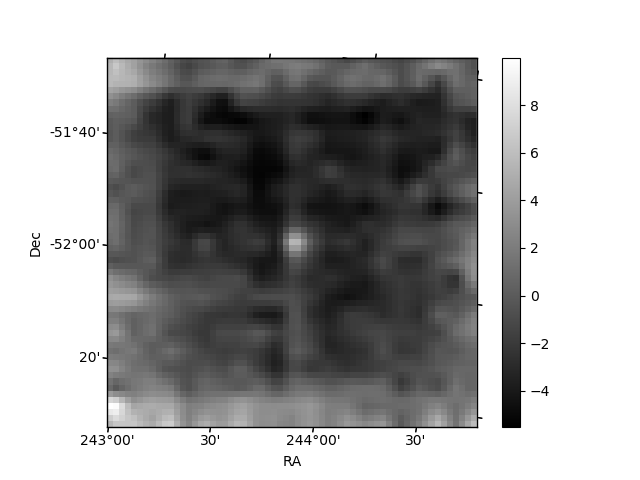
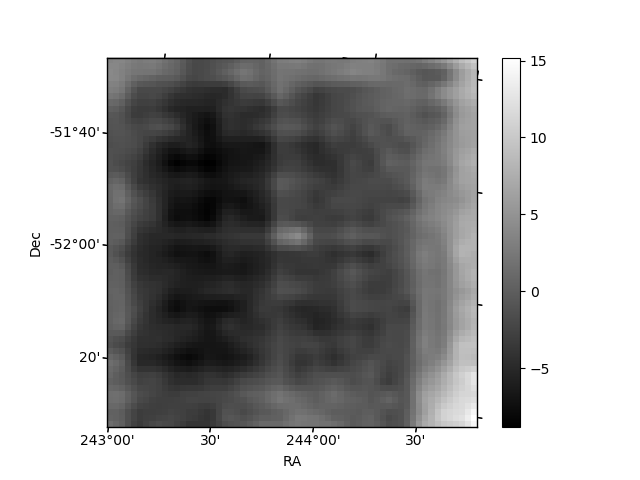
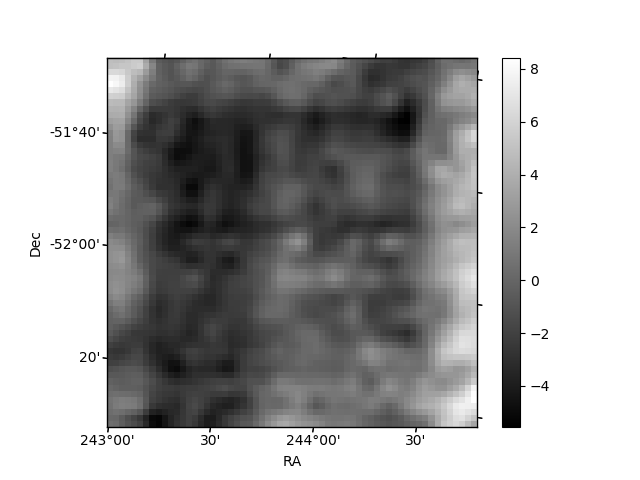
Histogram calculated using DETX and DETY for each event in the final _common_clean file
| Quadrant A | 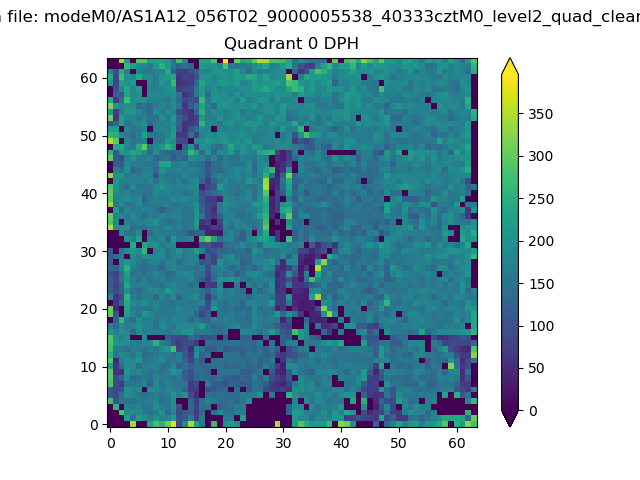 |
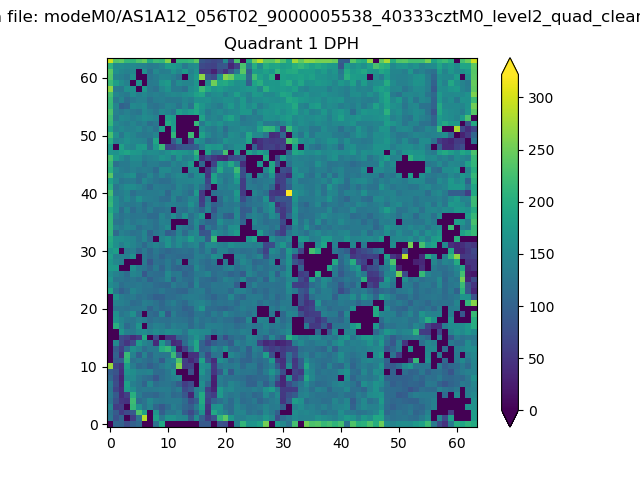 |
Quadrant B |
|---|---|---|---|
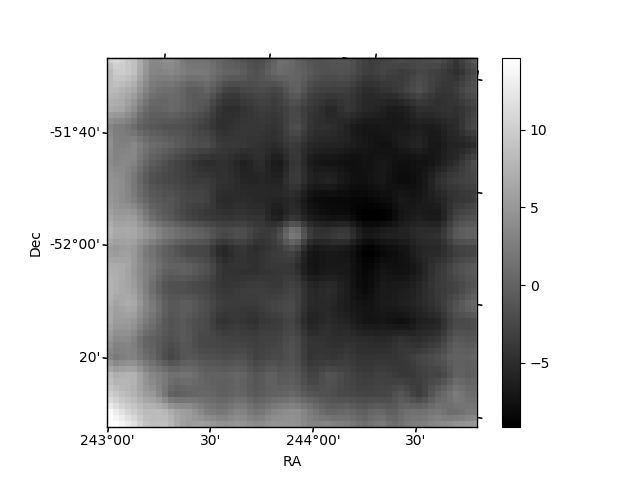
| Quadrant D | 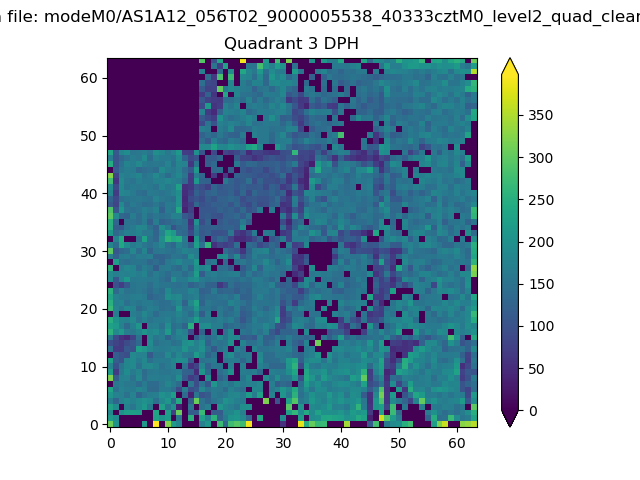 |
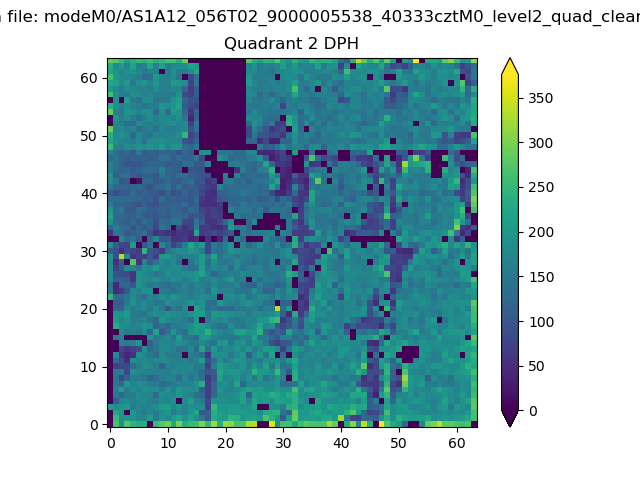 |
Quadrant C |
| Plot type | Count rate plots | Images |
|---|---|---|
| Comparison with Poisson distribution Blue bars denote a histogram of data divided into 1 sec bins. Red curve is a Poisson curve with rate = median count rate of data. |
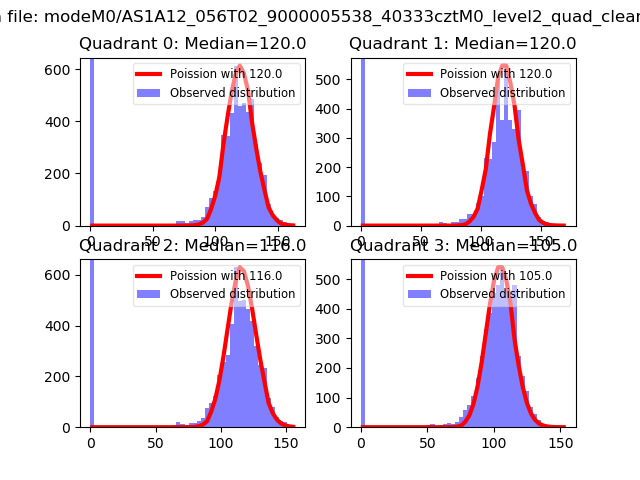 |
 |
| Quadrant-wise count rates Data is divided into 100 sec bins |
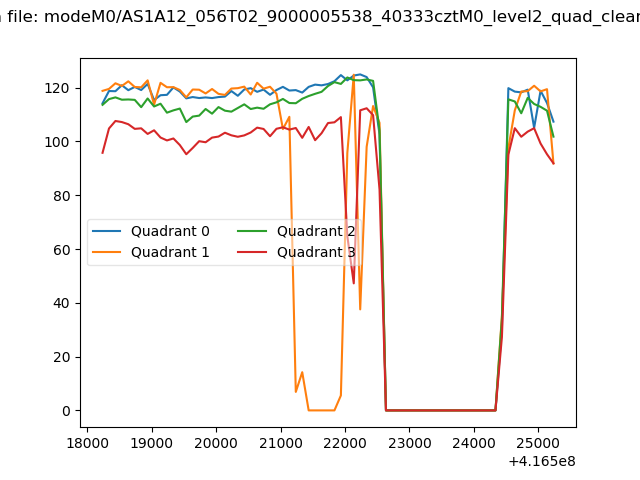 |
|
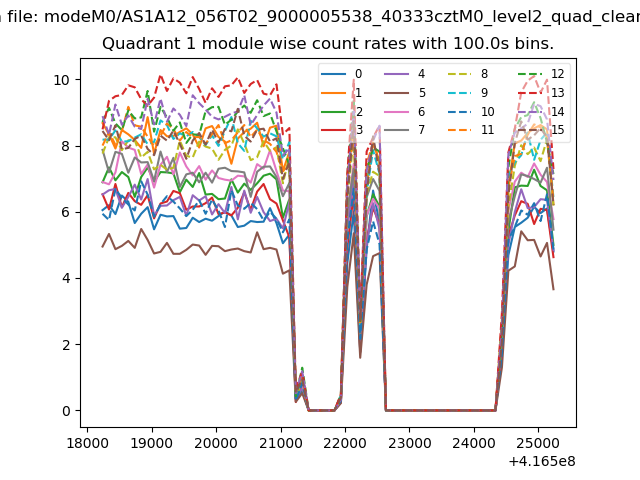
| Module-wise count rates for Quadrant A Data is divided into 100 sec bins |
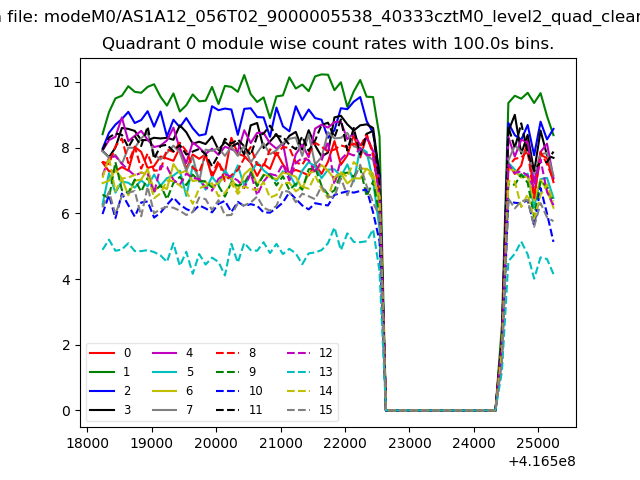 |
 |
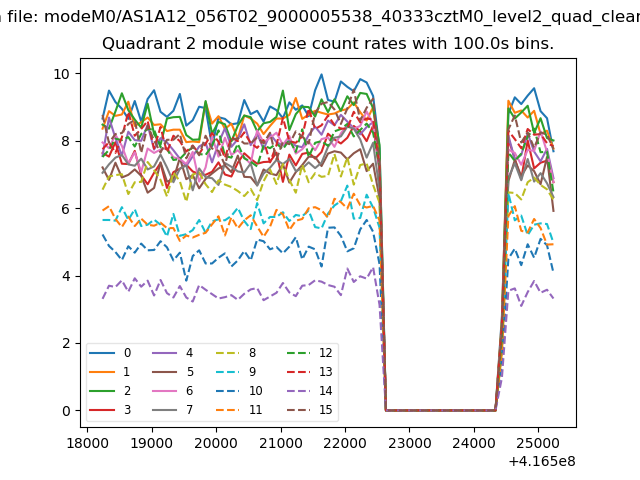
| Module-wise count rates for Quadrant B Data is divided into 100 sec bins |
 |
 |
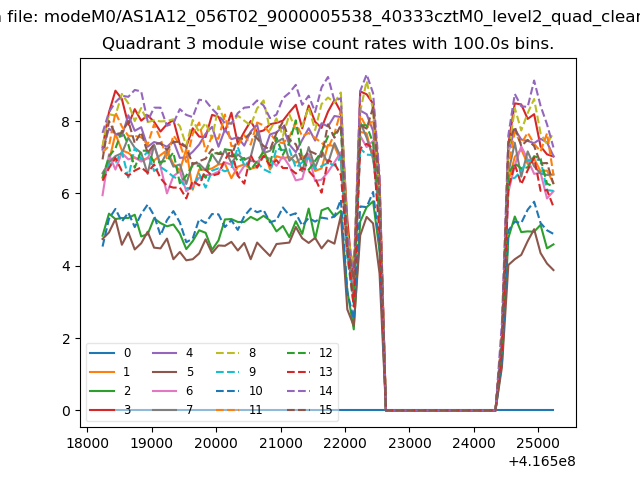
| Module-wise count rates for Quadrant C Data is divided into 100 sec bins |
 |
 |
| Module-wise count rates for Quadrant D Data is divided into 100 sec bins |
 |
 |
| Parameter | Plot |
|---|---|
| CZT HV Monitor | 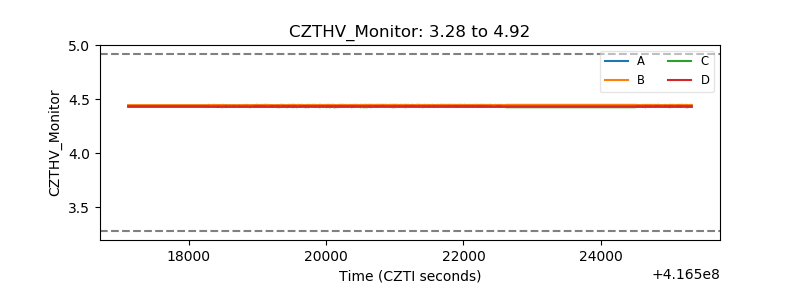 |
| D_VDD | 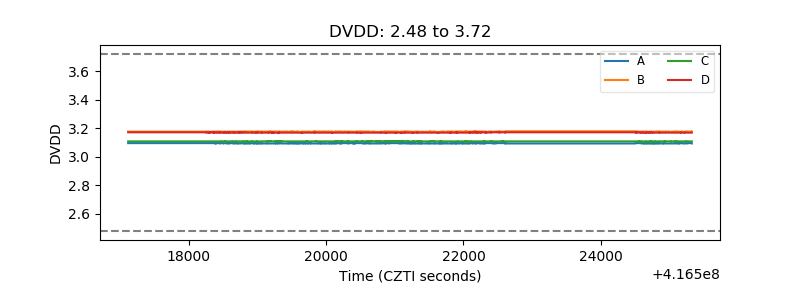 |
| Temperature 1 | 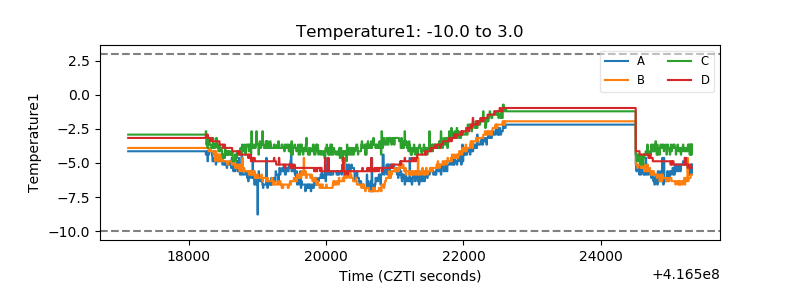 |
| Veto HV Monitor | 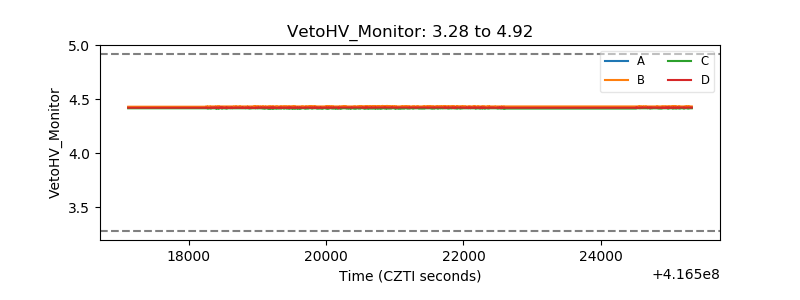 |
| Veto LLD | 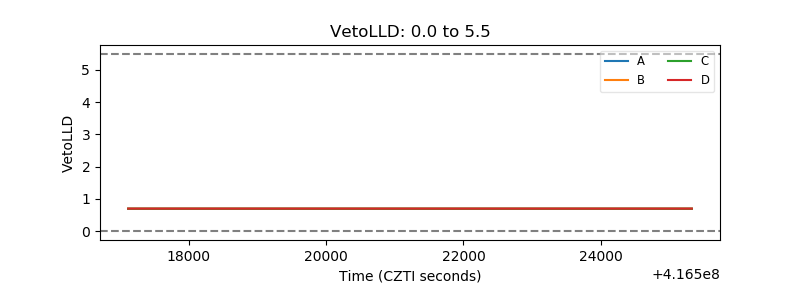 |
| Alpha Counter | 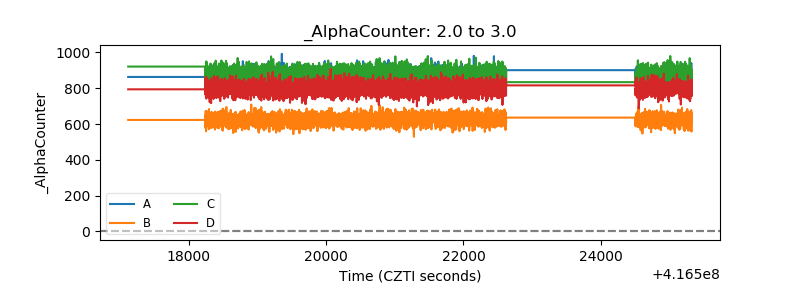 |
| _CPM_Rate | 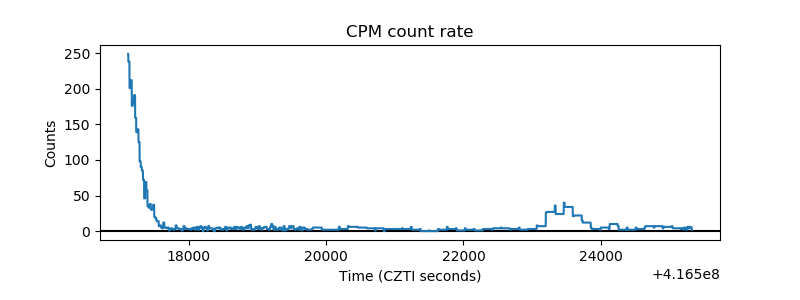 |
| CZT Counter | 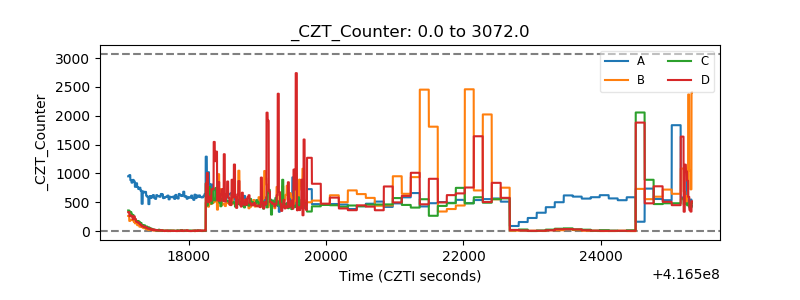 |
| +2.5 Volts monitor |  |
| +5 Volts monitor | 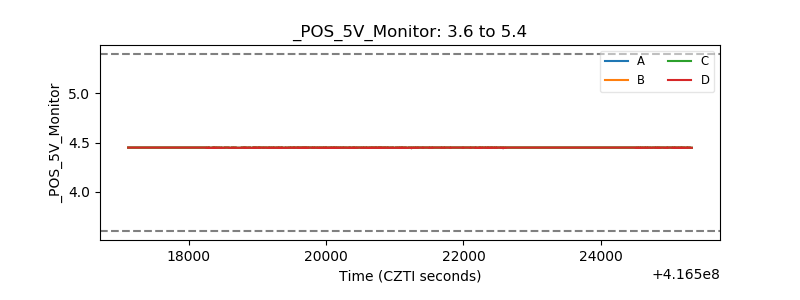 |
| _ROLL_ROT | 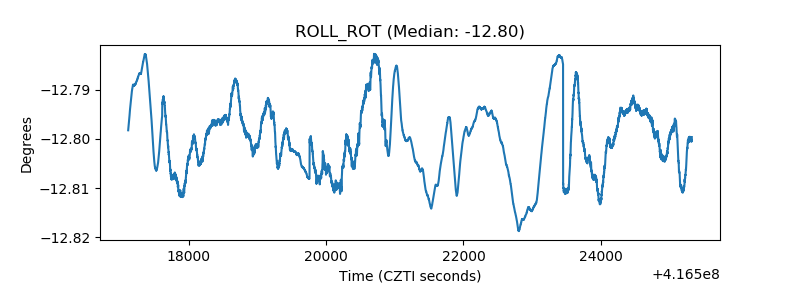 |
| _Roll_DEC | 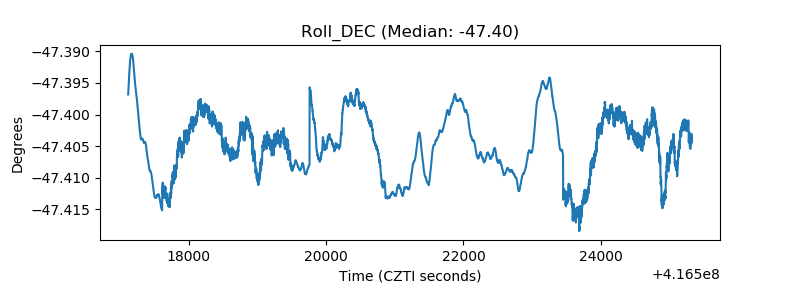 |
| _Roll_RA | 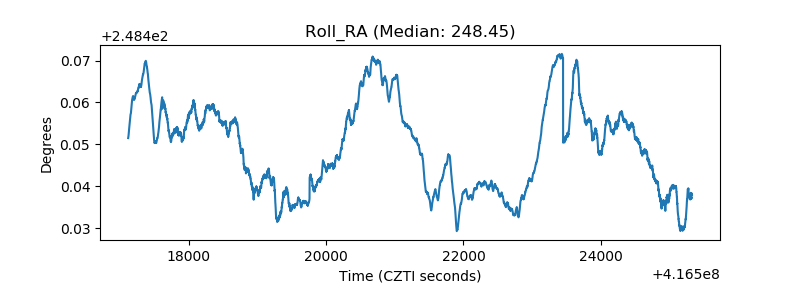 |
| Veto Counter | 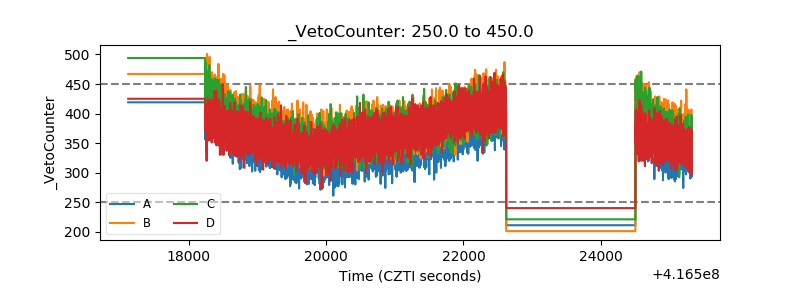 |