| Param | Original file | Final file |
|---|---|---|
| Filename | modeM0/AS1A12_056T02_9000005538_40334cztM0_level2.fits | modeM0/AS1A12_056T02_9000005538_40334cztM0_level2_quad_clean.evt |
| Size (bytes) | 367,416,000 | 98,346,240 |
| Size | 350.4 MB | 93.8 MB |
| Events in quadrant A | 3,283,387 | 667,142 |
| Events in quadrant B | 3,376,037 | 674,148 |
| Events in quadrant C | 2,856,885 | 652,152 |
| Events in quadrant D | 3,635,175 | 580,608 |
| Mode M0 | |||
|---|---|---|---|
| Quadrant | BADHDUFLAG | Total packets | Discarded packets |
| A | 0 | 13319 | 3 |
| B | 0 | 13975 | 2 |
| C | 0 | 11971 | 2 |
| D | 0 | 14997 | 2 |
| Mode M9 | |||
|---|---|---|---|
| Quadrant | BADHDUFLAG | Total packets | Discarded packets |
| A | 0 | 33 | 0 |
| B | 0 | 33 | 0 |
| C | 0 | 33 | 0 |
| D | 0 | 33 | 0 |
| Mode SS | |||
|---|---|---|---|
| Quadrant | BADHDUFLAG | Total packets | Discarded packets |
| A | 0 | 122 | 0 |
| B | 0 | 122 | 0 |
| C | 0 | 122 | 0 |
| D | 0 | 122 | 0 |
| Quadrant | Total seconds | Saturated seconds | Saturation percentage |
|---|---|---|---|
| A | 5769 | 75 | 1.300052% |
| B | 5769 | 140 | 2.426764% |
| C | 5769 | 20 | 0.346681% |
| D | 5769 | 236 | 4.090830% |
Noise dominated data is calculated using 1-second bins in cleaned event files. If a bin has >2000 counts, and if more than 50% of those come from <1% of pixels, then it is considered to be noise-dominated and hence unusable.
| Quadrant | # 1 sec bins | Bins with >0 counts | Bins with >2000 counts | High rate bins dominated by noise | Noise dominated (total time) | Noise dominated (detector-on time) | Marked lightcurve |
|---|---|---|---|---|---|---|---|
| A | 9205 | 5771 | 65 | 65 | 0.71% | 1.13% | 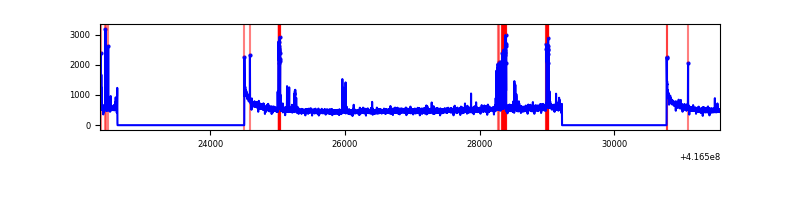 |
| B | 9205 | 5771 | 98 | 98 | 1.06% | 1.70% | 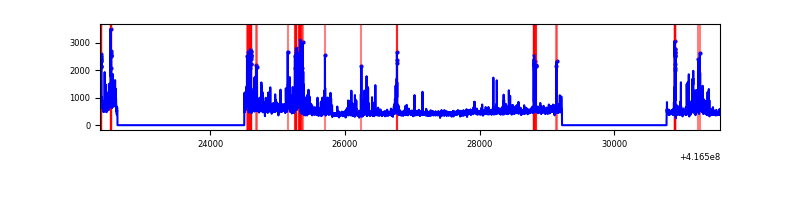 |
| C | 9205 | 5771 | 17 | 17 | 0.18% | 0.29% | 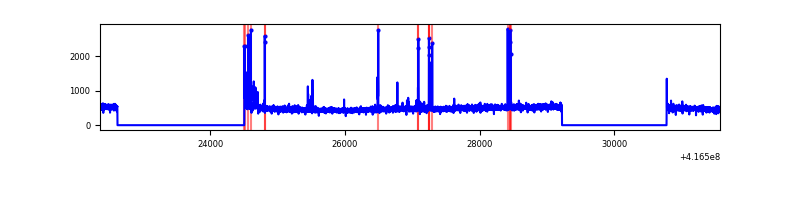 |
| D | 9205 | 5771 | 235 | 235 | 2.55% | 4.07% | 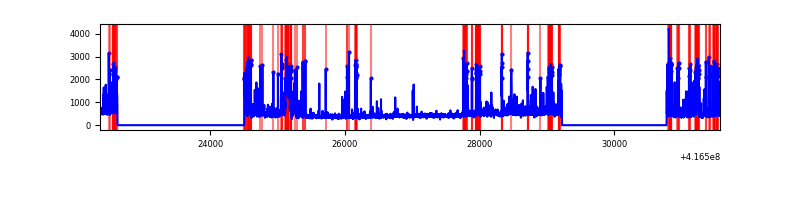 |
Top three noisy pixels from each quadrant. If the there are fewer than three noisy pixels in the level2.evt file, extra rows are filled as -1
| Pixel properties | Quadrant properties | ||||||
|---|---|---|---|---|---|---|---|
| Quadrant | DetID | PixID | Counts | Sigma | Mean | Median | Sigma |
| A | 10 | 83 | 491473 | 3715.09 | 643 | 633 | 132.1 |
| A | 13 | 248 | 251976 | 1902.37 | 643 | 633 | 132.1 |
| A | 6 | 10 | 24695 | 182.12 | 643 | 633 | 132.1 |
| B | 4 | 171 | 456052 | 3633.0 | 638 | 620 | 125.4 |
| B | 5 | 255 | 215637 | 1715.2 | 638 | 620 | 125.4 |
| B | 4 | 170 | 110832 | 879.17 | 638 | 620 | 125.4 |
| C | 15 | 214 | 264115 | 1764.53 | 634 | 638 | 149.3 |
| C | 14 | 254 | 106721 | 710.45 | 634 | 638 | 149.3 |
| C | 0 | 10 | 12407 | 78.82 | 634 | 638 | 149.3 |
| D | 12 | 227 | 476824 | 3126.39 | 619 | 602 | 152.3 |
| D | 1 | 47 | 377117 | 2471.82 | 619 | 602 | 152.3 |
| D | 12 | 128 | 135807 | 887.62 | 619 | 602 | 152.3 |
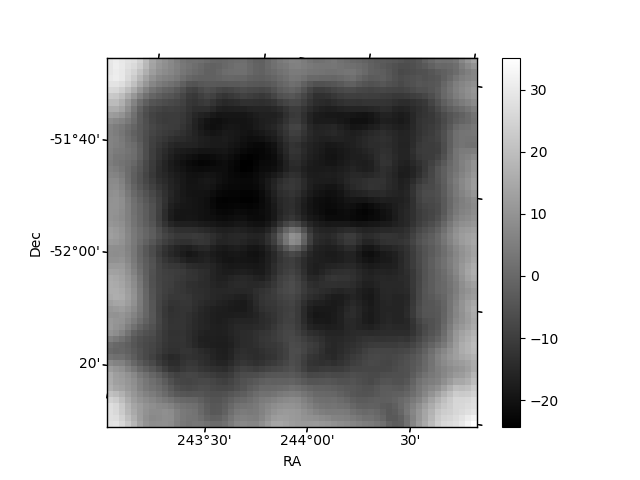
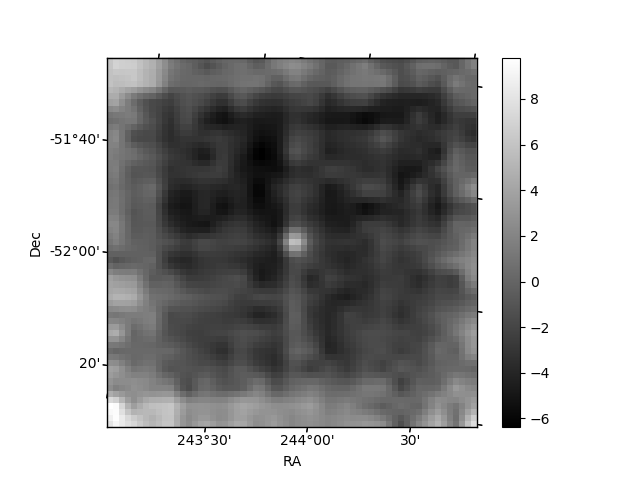
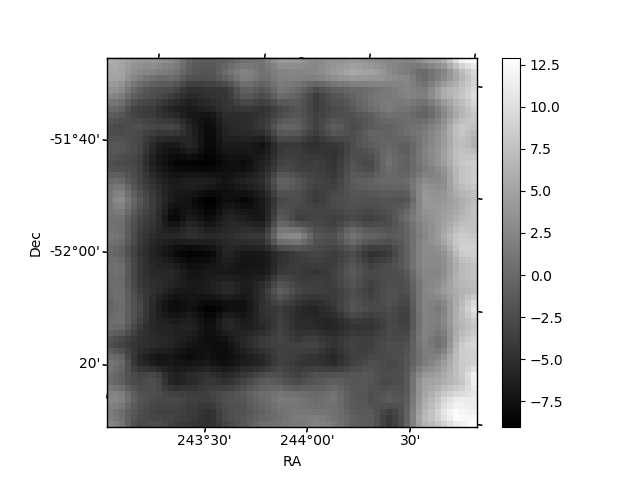
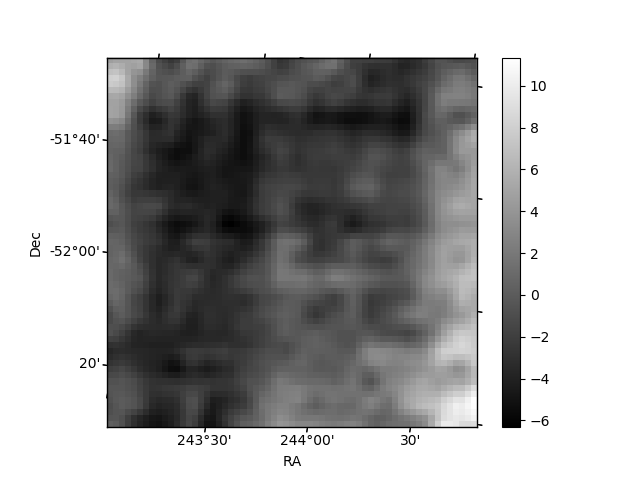
Histogram calculated using DETX and DETY for each event in the final _common_clean file
| Quadrant A | 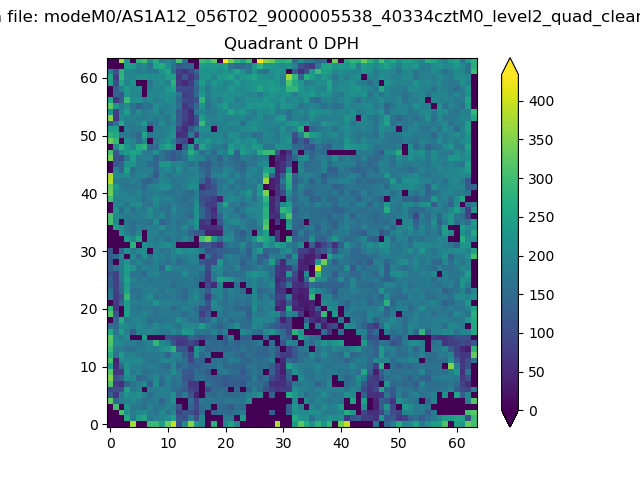 |
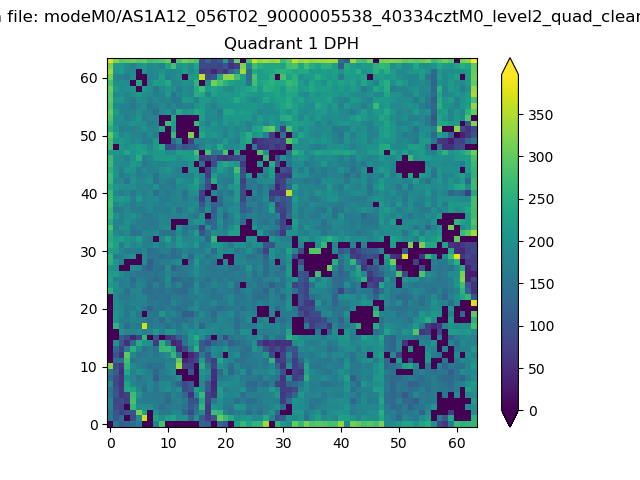 |
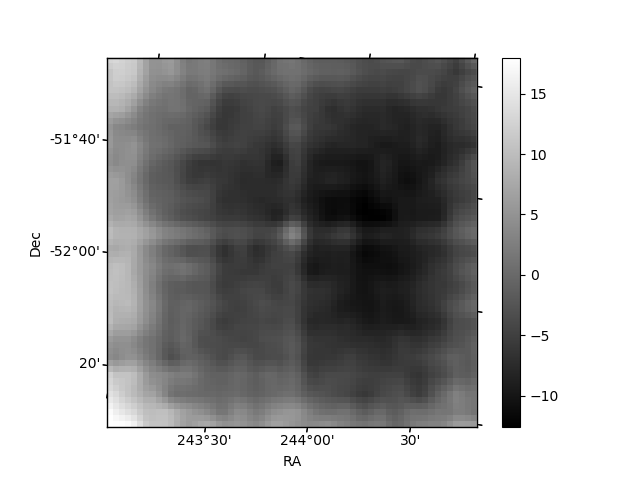
Quadrant B |
|---|---|---|---|
| Quadrant D | 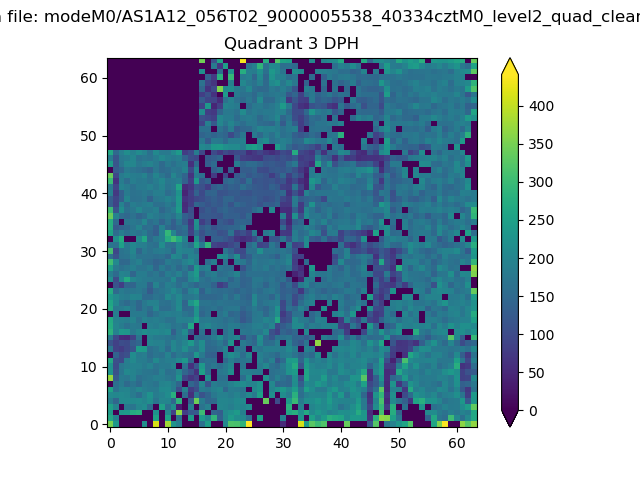 |
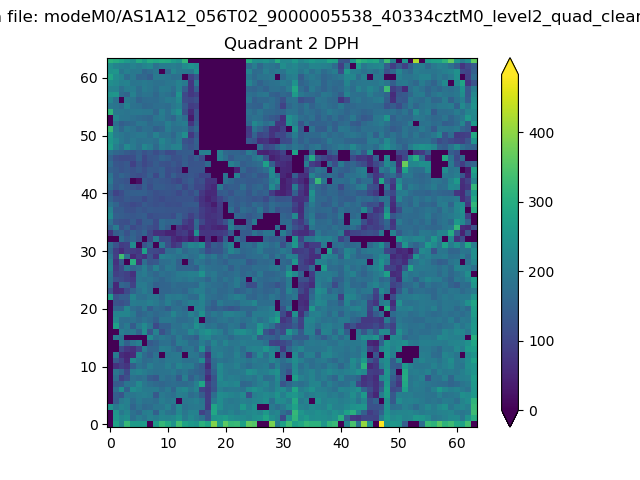 |
Quadrant C |
| Plot type | Count rate plots | Images |
|---|---|---|
| Comparison with Poisson distribution Blue bars denote a histogram of data divided into 1 sec bins. Red curve is a Poisson curve with rate = median count rate of data. |
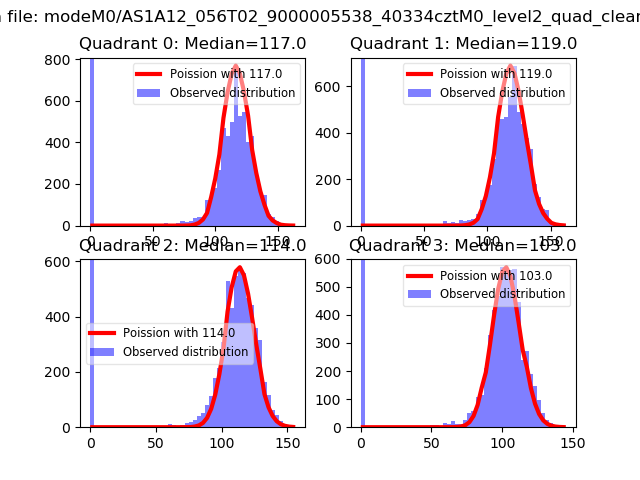 |
 |
| Quadrant-wise count rates Data is divided into 100 sec bins |
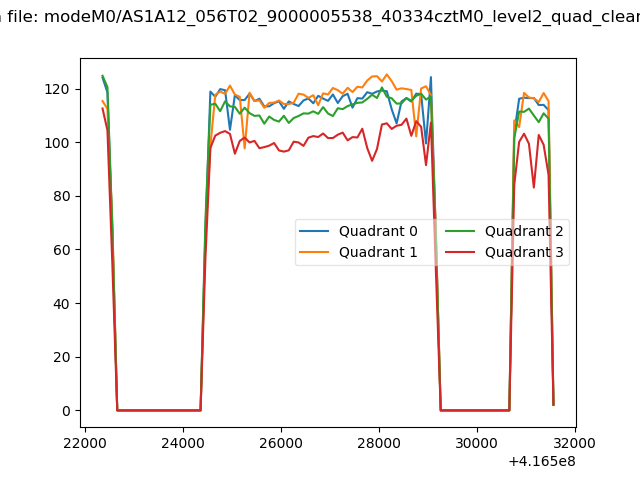 |
|
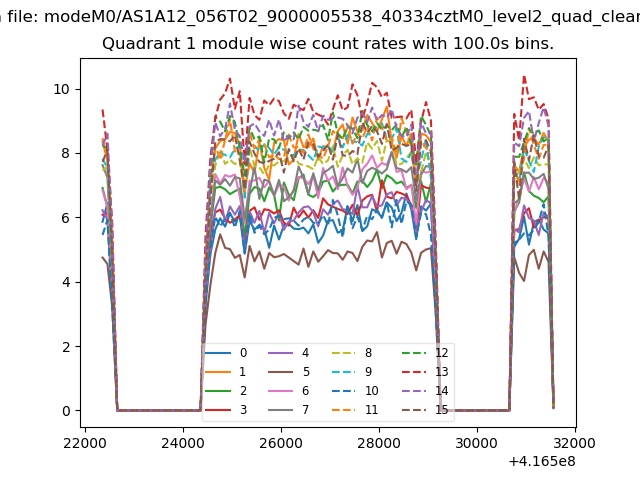
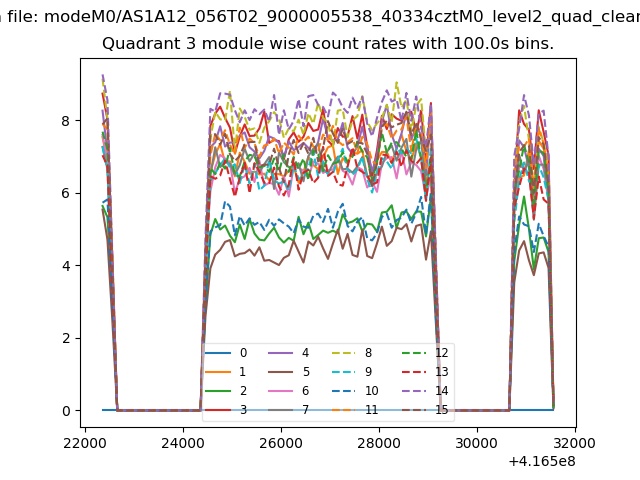
| Module-wise count rates for Quadrant A Data is divided into 100 sec bins |
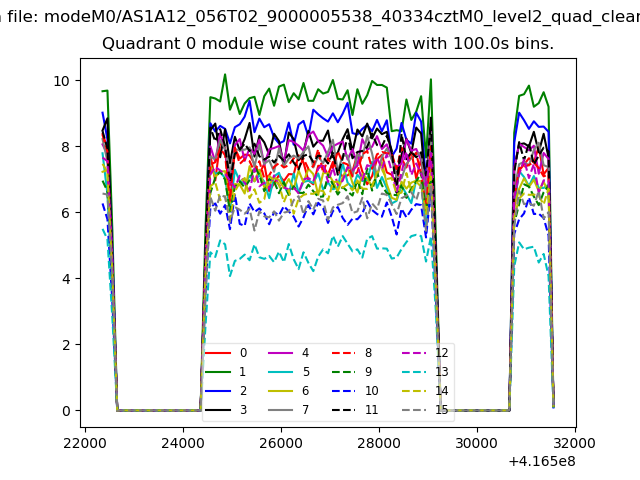 |
 |
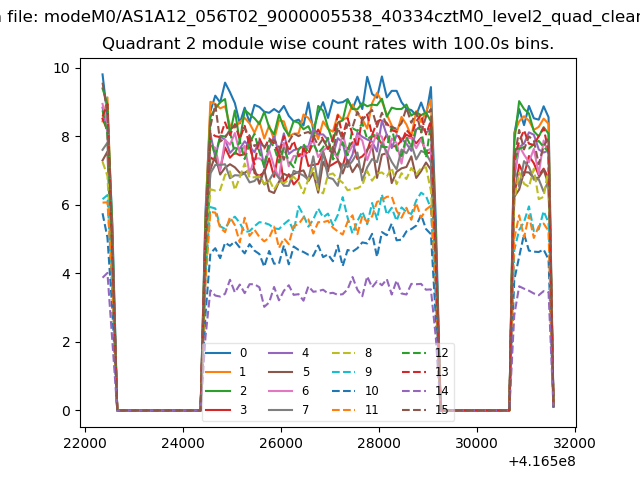
| Module-wise count rates for Quadrant B Data is divided into 100 sec bins |
 |
 |
| Module-wise count rates for Quadrant C Data is divided into 100 sec bins |
 |
 |
| Module-wise count rates for Quadrant D Data is divided into 100 sec bins |
 |
 |
| Parameter | Plot |
|---|---|
| CZT HV Monitor | 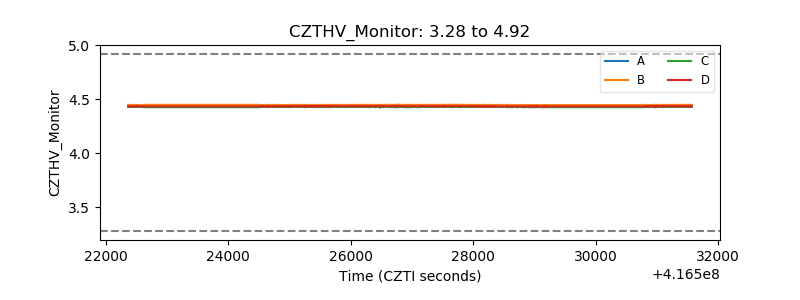 |
| D_VDD | 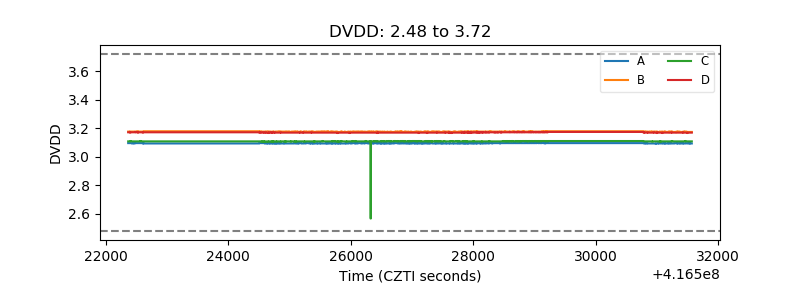 |
| Temperature 1 | 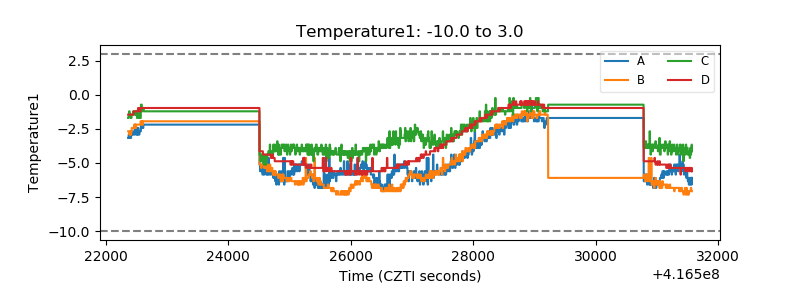 |
| Veto HV Monitor | 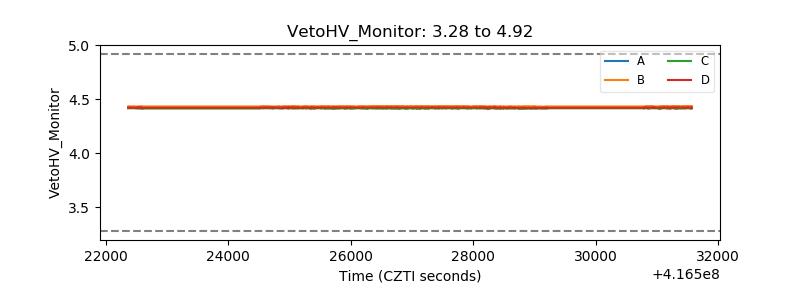 |
| Veto LLD | 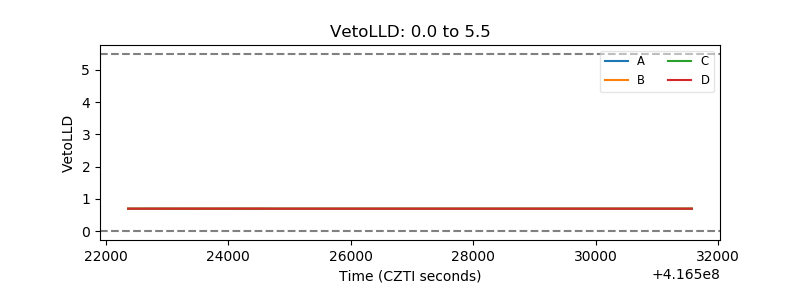 |
| Alpha Counter | 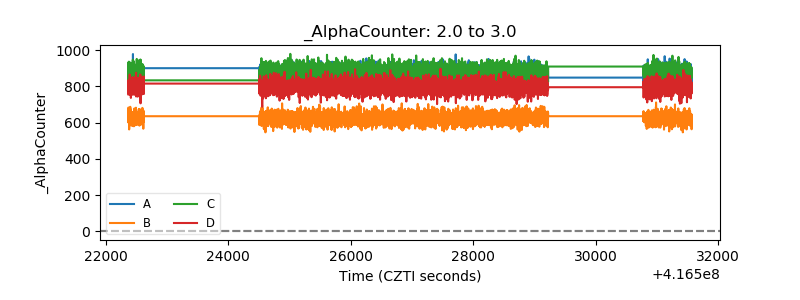 |
| _CPM_Rate | 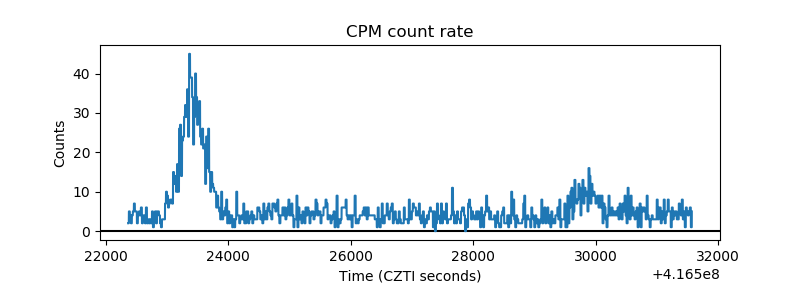 |
| CZT Counter | 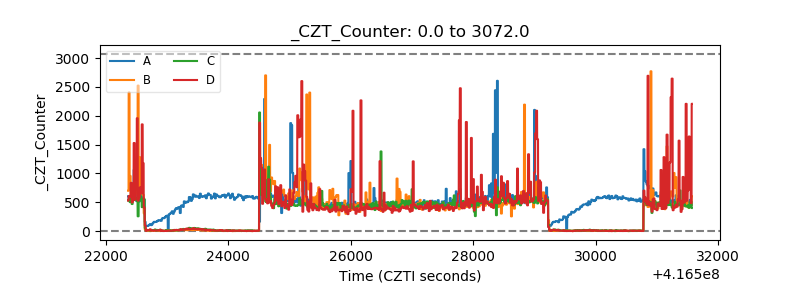 |
| +2.5 Volts monitor | 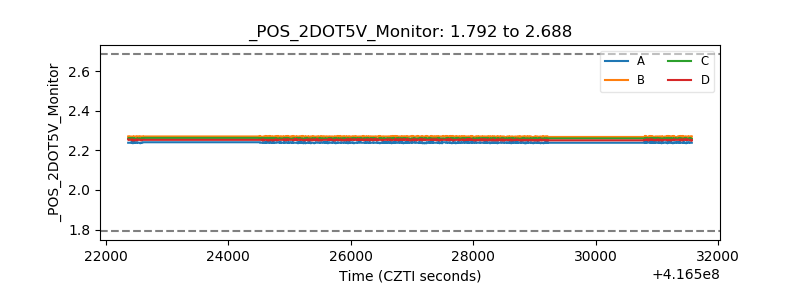 |
| +5 Volts monitor | 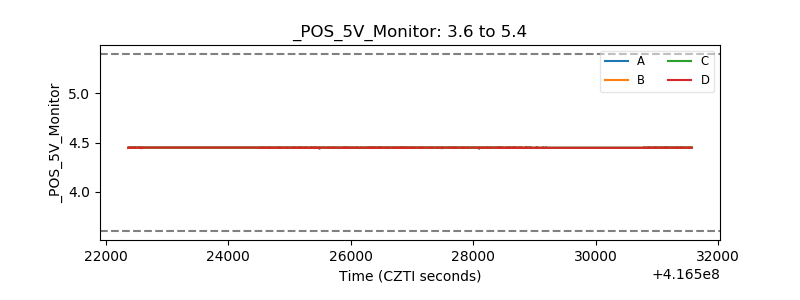 |
| _ROLL_ROT | 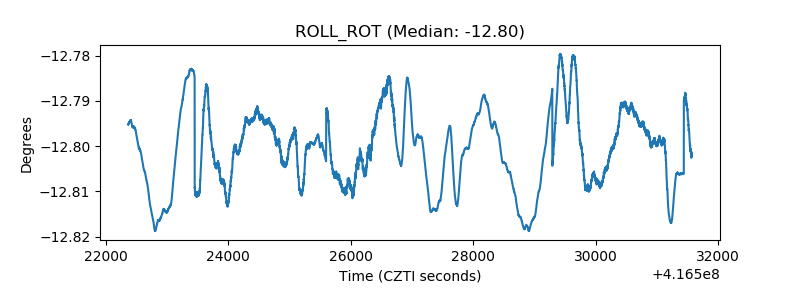 |
| _Roll_DEC | 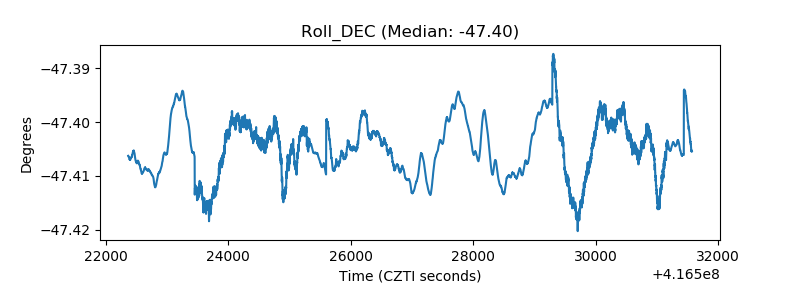 |
| _Roll_RA | 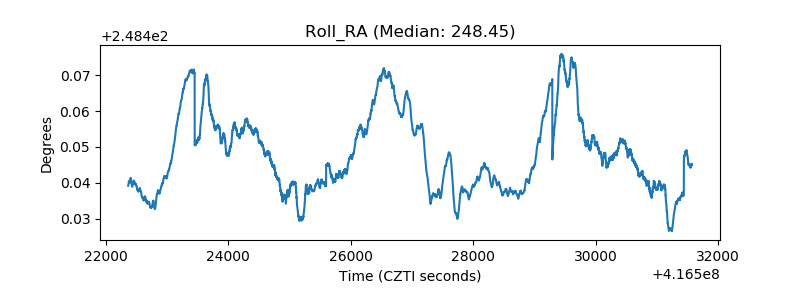 |
| Veto Counter | 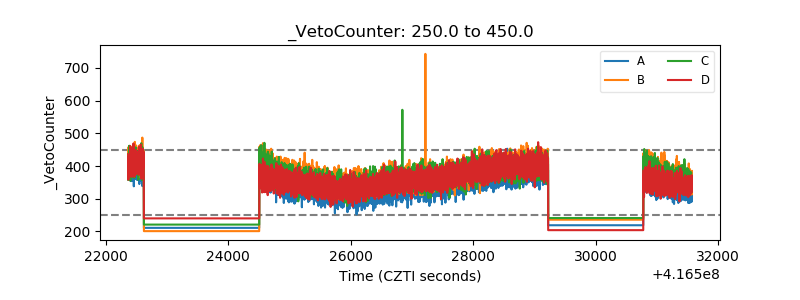 |