| Param | Original file | Final file |
|---|---|---|
| Filename | modeM0/AS1A12_056T02_9000005538_40335cztM0_level2.fits | modeM0/AS1A12_056T02_9000005538_40335cztM0_level2_quad_clean.evt |
| Size (bytes) | 368,755,200 | 95,719,680 |
| Size | 351.7 MB | 91.3 MB |
| Events in quadrant A | 3,379,986 | 643,934 |
| Events in quadrant B | 3,370,345 | 659,426 |
| Events in quadrant C | 2,734,413 | 635,197 |
| Events in quadrant D | 3,719,105 | 559,189 |
| Mode M0 | |||
|---|---|---|---|
| Quadrant | BADHDUFLAG | Total packets | Discarded packets |
| A | 0 | 13705 | 3 |
| B | 0 | 13818 | 2 |
| C | 0 | 11577 | 2 |
| D | 0 | 15113 | 2 |
| Mode M9 | |||
|---|---|---|---|
| Quadrant | BADHDUFLAG | Total packets | Discarded packets |
| A | 0 | 25 | 0 |
| B | 0 | 25 | 0 |
| C | 0 | 25 | 0 |
| D | 0 | 26 | 0 |
| Mode SS | |||
|---|---|---|---|
| Quadrant | BADHDUFLAG | Total packets | Discarded packets |
| A | 0 | 116 | 0 |
| B | 0 | 116 | 0 |
| C | 0 | 116 | 0 |
| D | 0 | 116 | 0 |
| Quadrant | Total seconds | Saturated seconds | Saturation percentage |
|---|---|---|---|
| A | 5732 | 86 | 1.500349% |
| B | 5732 | 124 | 2.163294% |
| C | 5732 | 4 | 0.069784% |
| D | 5732 | 287 | 5.006978% |
Noise dominated data is calculated using 1-second bins in cleaned event files. If a bin has >2000 counts, and if more than 50% of those come from <1% of pixels, then it is considered to be noise-dominated and hence unusable.
| Quadrant | # 1 sec bins | Bins with >0 counts | Bins with >2000 counts | High rate bins dominated by noise | Noise dominated (total time) | Noise dominated (detector-on time) | Marked lightcurve |
|---|---|---|---|---|---|---|---|
| A | 7045 | 5733 | 59 | 59 | 0.84% | 1.03% | 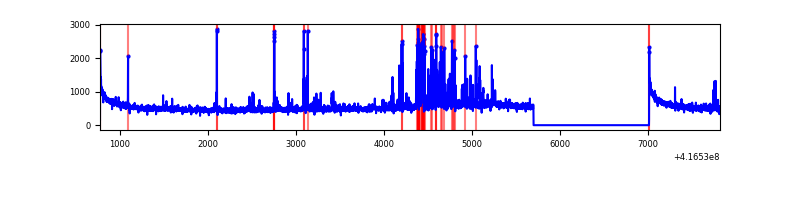 |
| B | 7045 | 5733 | 98 | 98 | 1.39% | 1.71% | 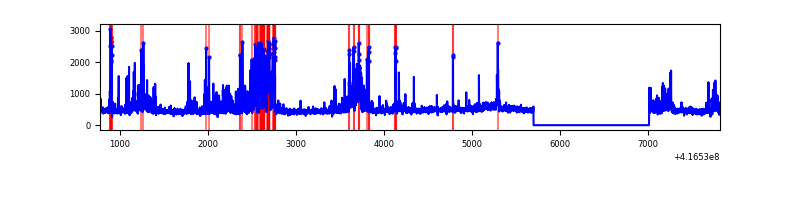 |
| C | 7045 | 5733 | 2 | 2 | 0.03% | 0.03% | 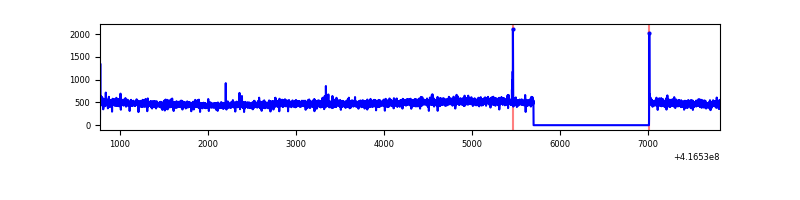 |
| D | 7045 | 5733 | 282 | 282 | 4.00% | 4.92% | 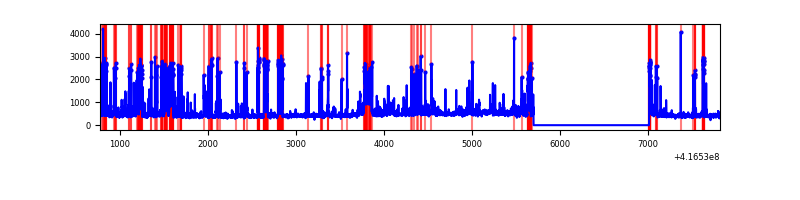 |
Top three noisy pixels from each quadrant. If the there are fewer than three noisy pixels in the level2.evt file, extra rows are filled as -1
| Pixel properties | Quadrant properties | ||||||
|---|---|---|---|---|---|---|---|
| Quadrant | DetID | PixID | Counts | Sigma | Mean | Median | Sigma |
| A | 10 | 83 | 503636 | 3842.29 | 637 | 625 | 130.9 |
| A | 13 | 248 | 350078 | 2669.32 | 637 | 625 | 130.9 |
| A | 2 | 79 | 23824 | 177.21 | 637 | 625 | 130.9 |
| B | 5 | 255 | 396396 | 3194.19 | 634 | 616 | 123.9 |
| B | 4 | 171 | 287108 | 2312.17 | 634 | 616 | 123.9 |
| B | 4 | 170 | 111786 | 897.21 | 634 | 616 | 123.9 |
| C | 15 | 214 | 262437 | 1789.83 | 627 | 631 | 146.3 |
| C | 4 | 254 | 12120 | 78.54 | 627 | 631 | 146.3 |
| C | 0 | 10 | 10378 | 66.64 | 627 | 631 | 146.3 |
| D | 1 | 47 | 493172 | 3268.98 | 612 | 596 | 150.7 |
| D | 12 | 227 | 481727 | 3193.03 | 612 | 596 | 150.7 |
| D | 12 | 128 | 119911 | 791.83 | 612 | 596 | 150.7 |
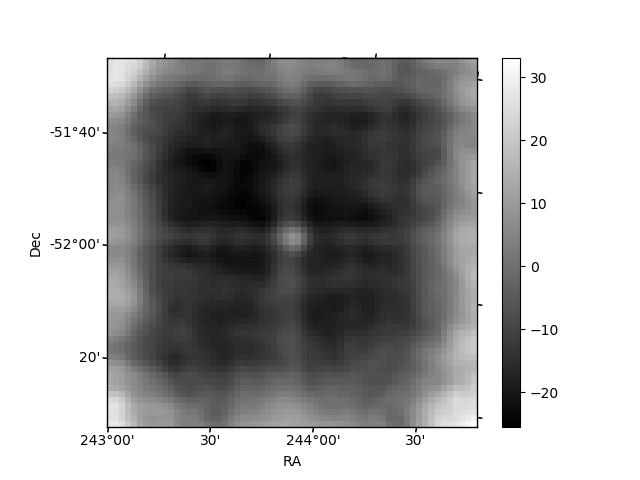
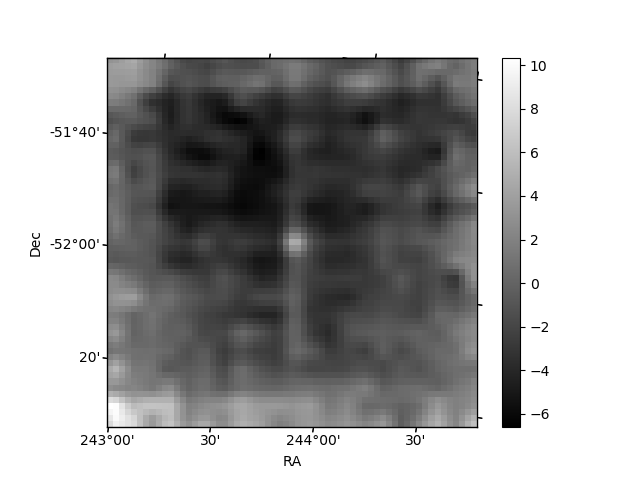
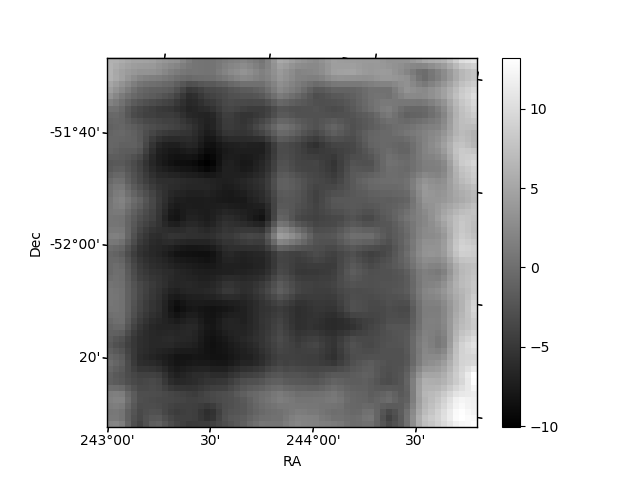
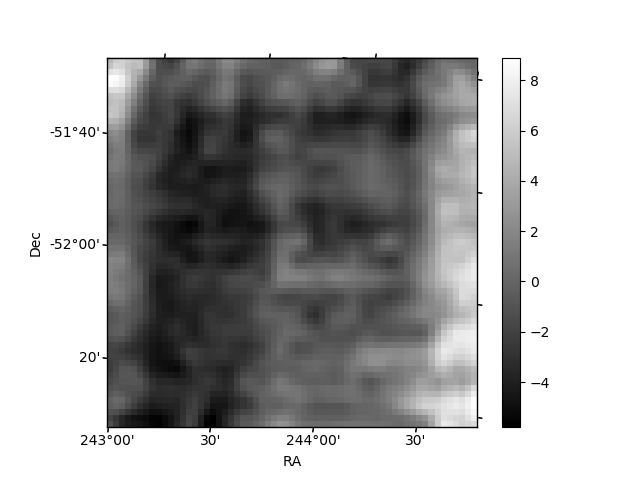
Histogram calculated using DETX and DETY for each event in the final _common_clean file
| Quadrant A | 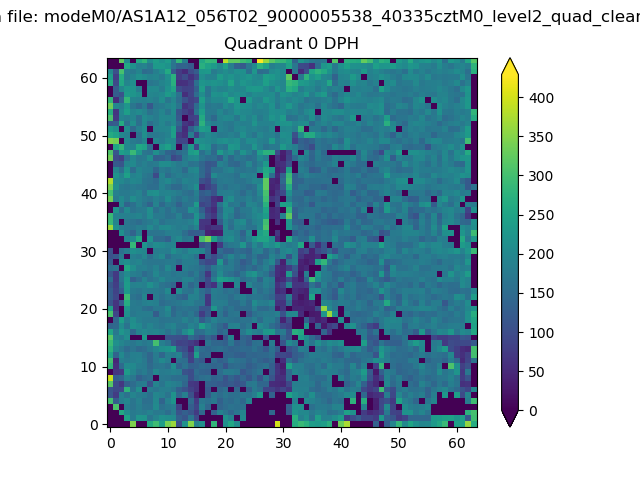 |
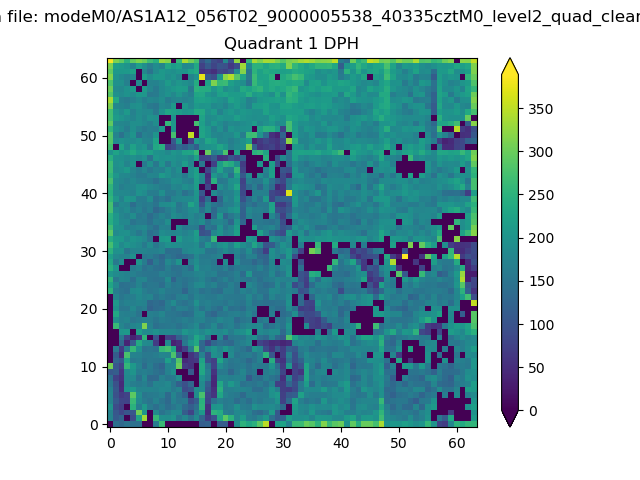 |
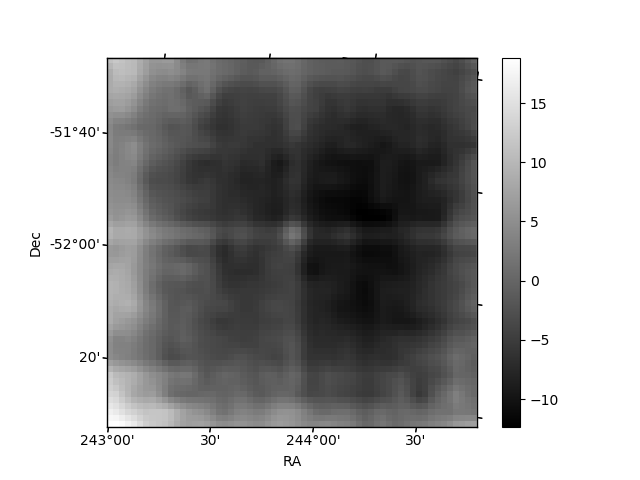
Quadrant B |
|---|---|---|---|
| Quadrant D | 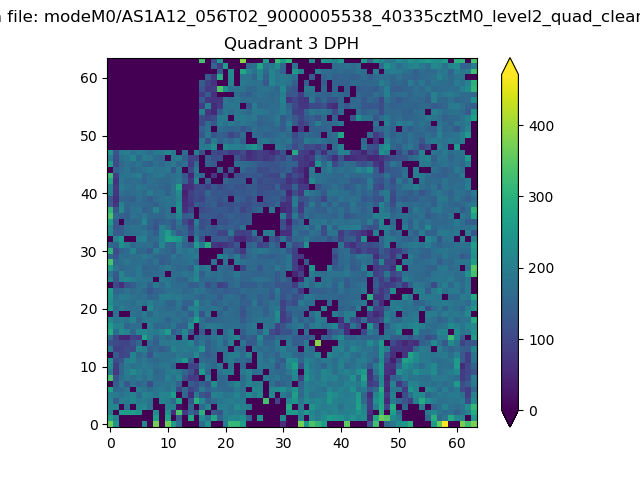 |
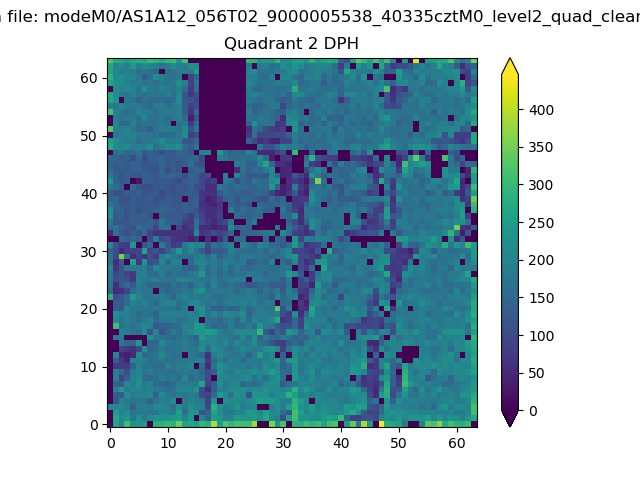 |
Quadrant C |
| Plot type | Count rate plots | Images |
|---|---|---|
| Comparison with Poisson distribution Blue bars denote a histogram of data divided into 1 sec bins. Red curve is a Poisson curve with rate = median count rate of data. |
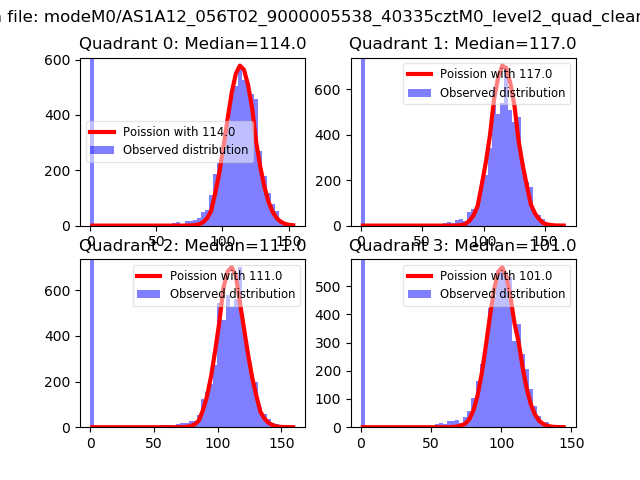 |
 |
| Quadrant-wise count rates Data is divided into 100 sec bins |
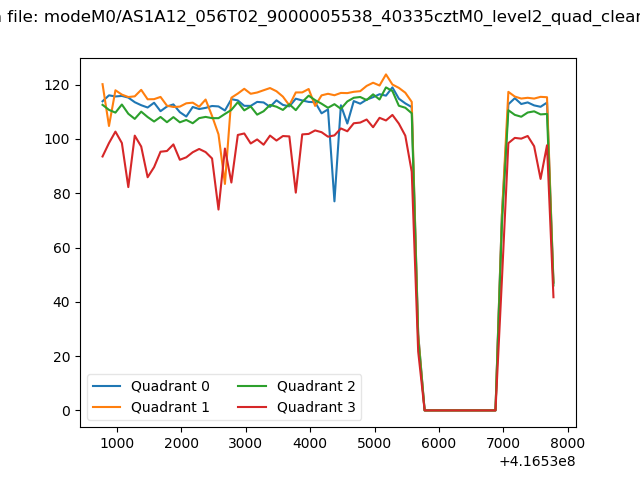 |
|
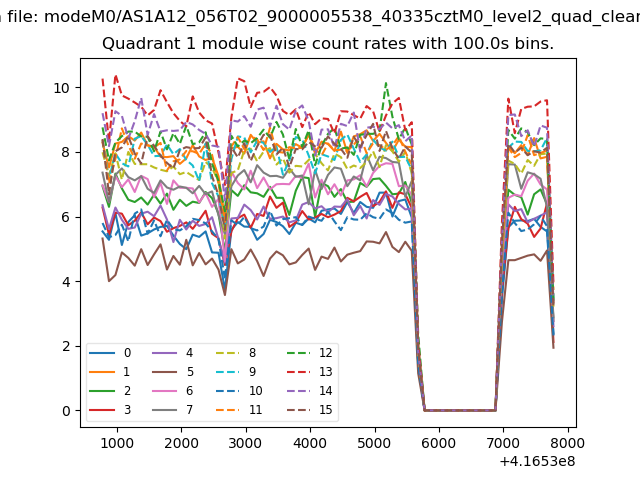
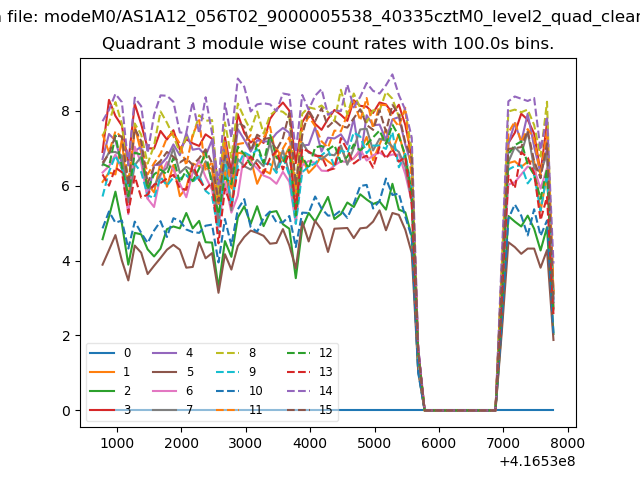
| Module-wise count rates for Quadrant A Data is divided into 100 sec bins |
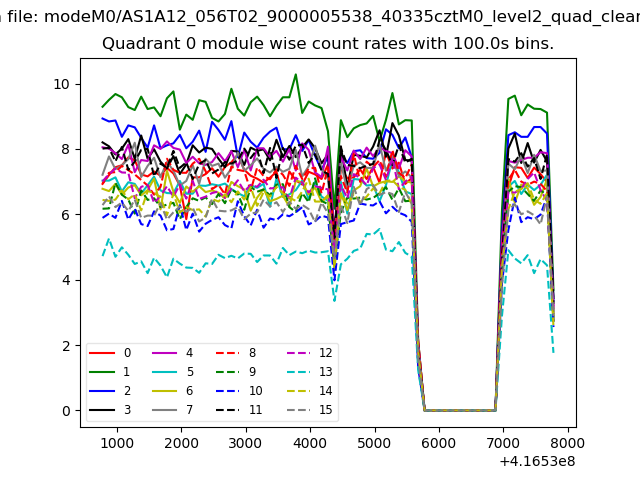 |
 |
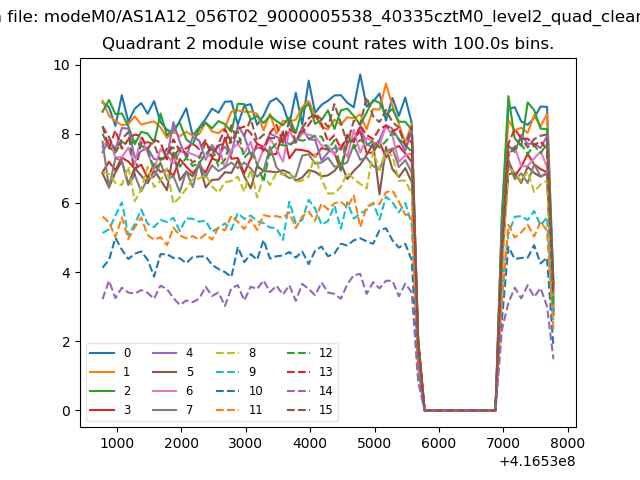
| Module-wise count rates for Quadrant B Data is divided into 100 sec bins |
 |
 |
| Module-wise count rates for Quadrant C Data is divided into 100 sec bins |
 |
 |
| Module-wise count rates for Quadrant D Data is divided into 100 sec bins |
 |
 |
| Parameter | Plot |
|---|---|
| CZT HV Monitor | 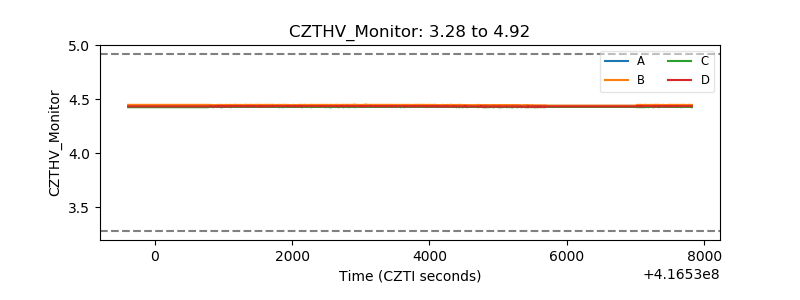 |
| D_VDD | 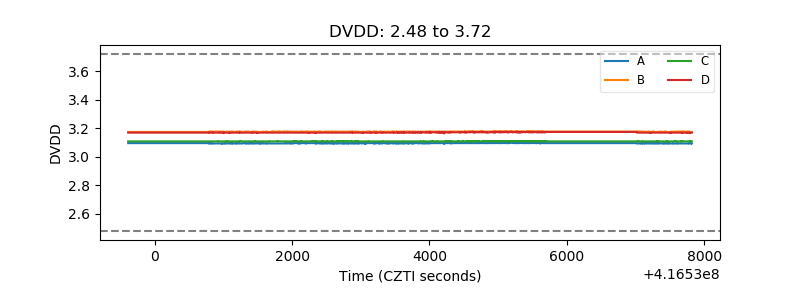 |
| Temperature 1 | 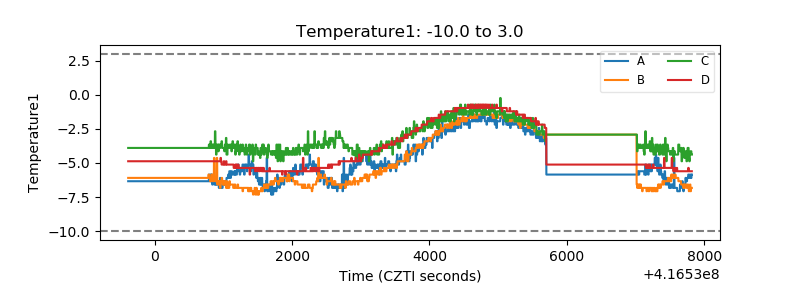 |
| Veto HV Monitor | 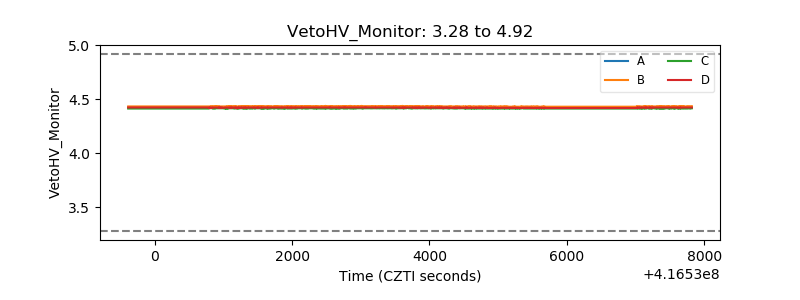 |
| Veto LLD | 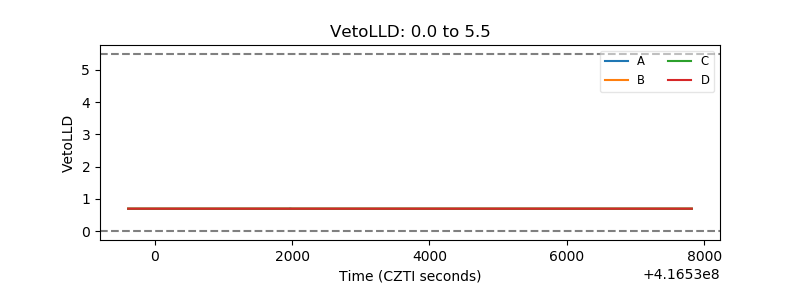 |
| Alpha Counter | 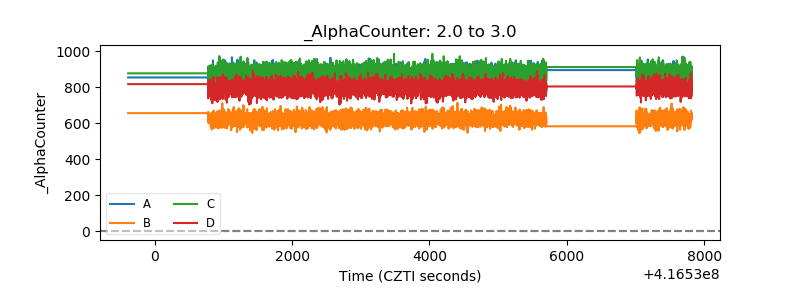 |
| _CPM_Rate | 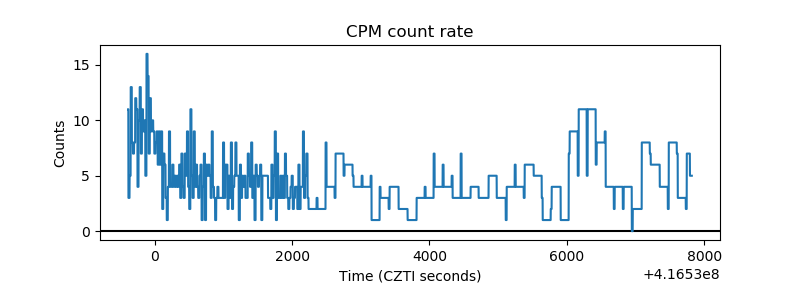 |
| CZT Counter | 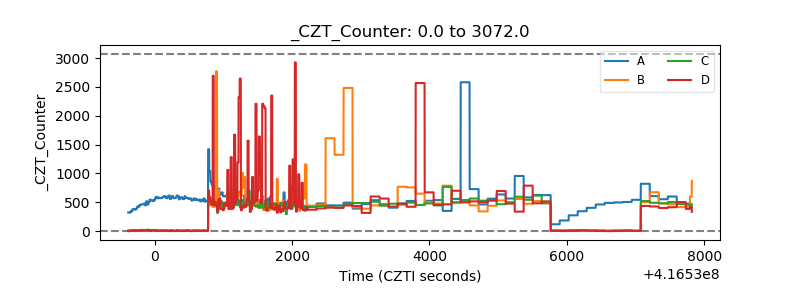 |
| +2.5 Volts monitor | 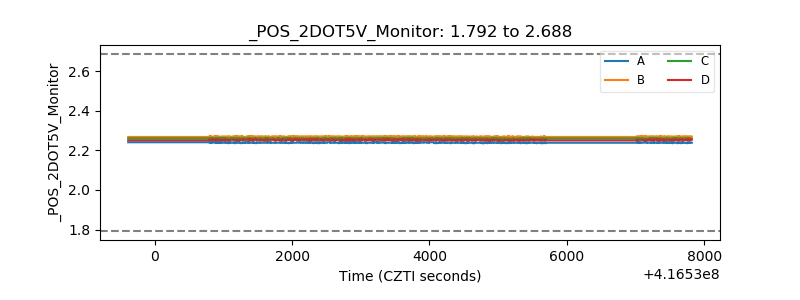 |
| +5 Volts monitor | 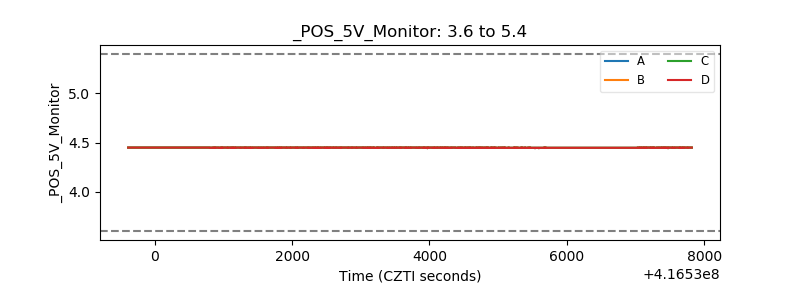 |
| _ROLL_ROT | 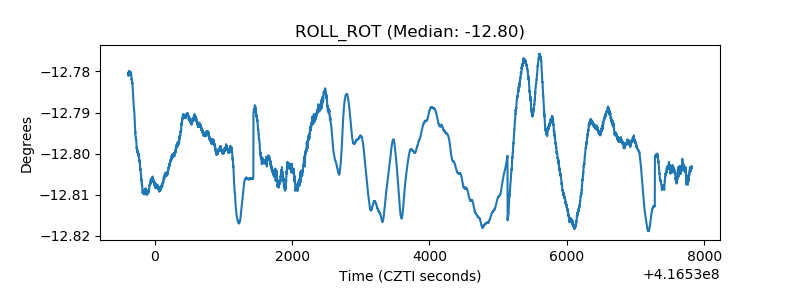 |
| _Roll_DEC | 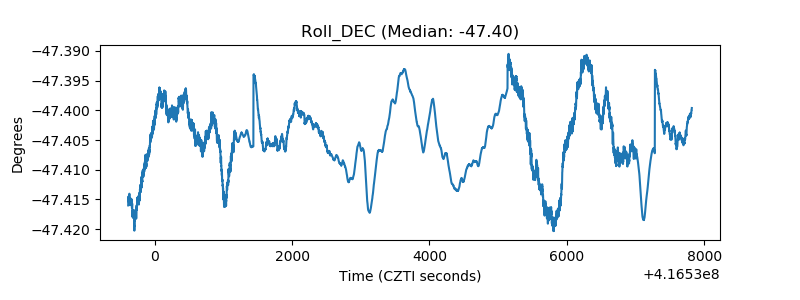 |
| _Roll_RA | 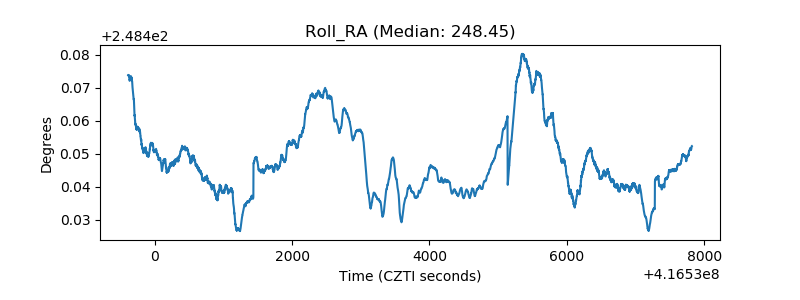 |
| Veto Counter | 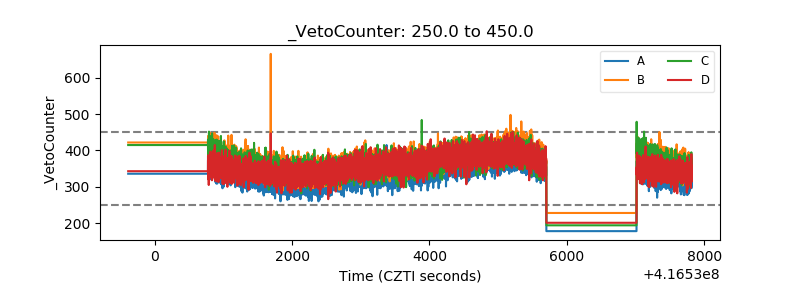 |