| Param | Original file | Final file |
|---|---|---|
| Filename | modeM0/AS1A12_056T02_9000005538_40342cztM0_level2.fits | modeM0/AS1A12_056T02_9000005538_40342cztM0_level2_quad_clean.evt |
| Size (bytes) | 894,720,960 | 236,208,960 |
| Size | 853.3 MB | 225.3 MB |
| Events in quadrant A | 8,034,878 | 1,588,543 |
| Events in quadrant B | 6,427,218 | 1,648,307 |
| Events in quadrant C | 6,675,804 | 1,588,707 |
| Events in quadrant D | 10,898,065 | 1,360,677 |
| Mode M0 | |||
|---|---|---|---|
| Quadrant | BADHDUFLAG | Total packets | Discarded packets |
| A | 0 | 32067 | 4 |
| B | 0 | 28391 | 3 |
| C | 0 | 28424 | 3 |
| D | 0 | 42044 | 3 |
| Mode M9 | |||
|---|---|---|---|
| Quadrant | BADHDUFLAG | Total packets | Discarded packets |
| A | 0 | 51 | 0 |
| B | 0 | 51 | 0 |
| C | 0 | 51 | 0 |
| D | 0 | 51 | 0 |
| Mode SS | |||
|---|---|---|---|
| Quadrant | BADHDUFLAG | Total packets | Discarded packets |
| A | 0 | 286 | 0 |
| B | 0 | 286 | 0 |
| C | 0 | 286 | 0 |
| D | 0 | 286 | 0 |
| Quadrant | Total seconds | Saturated seconds | Saturation percentage |
|---|---|---|---|
| A | 13988 | 165 | 1.179582% |
| B | 13988 | 14 | 0.100086% |
| C | 13988 | 16 | 0.114384% |
| D | 13988 | 1145 | 8.185588% |
Noise dominated data is calculated using 1-second bins in cleaned event files. If a bin has >2000 counts, and if more than 50% of those come from <1% of pixels, then it is considered to be noise-dominated and hence unusable.
| Quadrant | # 1 sec bins | Bins with >0 counts | Bins with >2000 counts | High rate bins dominated by noise | Noise dominated (total time) | Noise dominated (detector-on time) | Marked lightcurve |
|---|---|---|---|---|---|---|---|
| A | 19066 | 13991 | 130 | 130 | 0.68% | 0.93% | 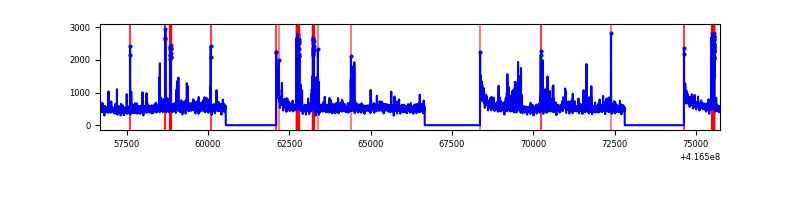 |
| B | 19066 | 13991 | 3 | 3 | 0.02% | 0.02% | 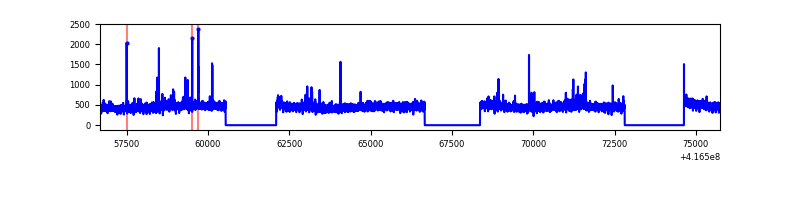 |
| C | 19066 | 13991 | 6 | 6 | 0.03% | 0.04% | 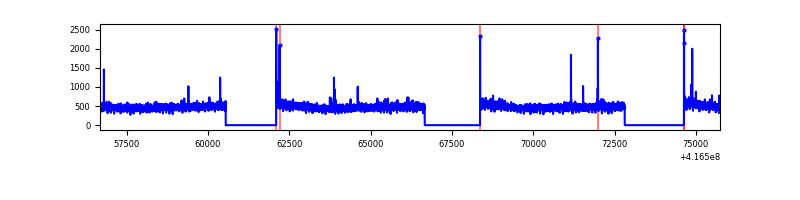 |
| D | 19066 | 13991 | 1175 | 1175 | 6.16% | 8.40% | 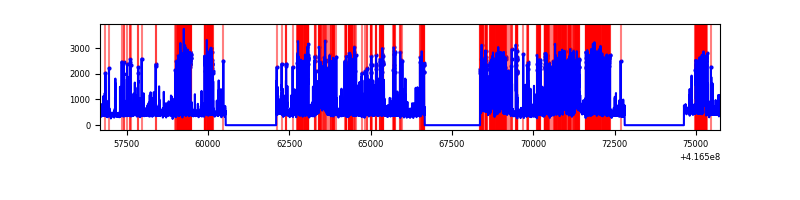 |
Top three noisy pixels from each quadrant. If the there are fewer than three noisy pixels in the level2.evt file, extra rows are filled as -1
| Pixel properties | Quadrant properties | ||||||
|---|---|---|---|---|---|---|---|
| Quadrant | DetID | PixID | Counts | Sigma | Mean | Median | Sigma |
| A | 10 | 83 | 1068385 | 3345.43 | 1571 | 1539 | 318.9 |
| A | 13 | 248 | 538569 | 1684.03 | 1571 | 1539 | 318.9 |
| A | 12 | 189 | 150681 | 467.68 | 1571 | 1539 | 318.9 |
| B | 0 | 230 | 122020 | 404.34 | 1562 | 1518 | 298.0 |
| B | 5 | 255 | 55490 | 181.1 | 1562 | 1518 | 298.0 |
| B | 0 | 245 | 42167 | 136.4 | 1562 | 1518 | 298.0 |
| C | 15 | 214 | 630674 | 1780.39 | 1533 | 1547 | 353.4 |
| C | 14 | 254 | 30377 | 81.59 | 1533 | 1547 | 353.4 |
| C | 0 | 10 | 20387 | 53.32 | 1533 | 1547 | 353.4 |
| D | 12 | 227 | 3171101 | 8724.12 | 1486 | 1448 | 363.3 |
| D | 12 | 233 | 879785 | 2417.52 | 1486 | 1448 | 363.3 |
| D | 12 | 128 | 455066 | 1248.53 | 1486 | 1448 | 363.3 |
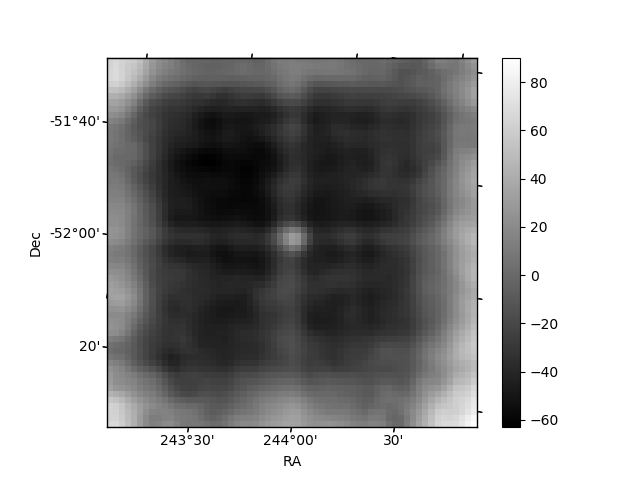
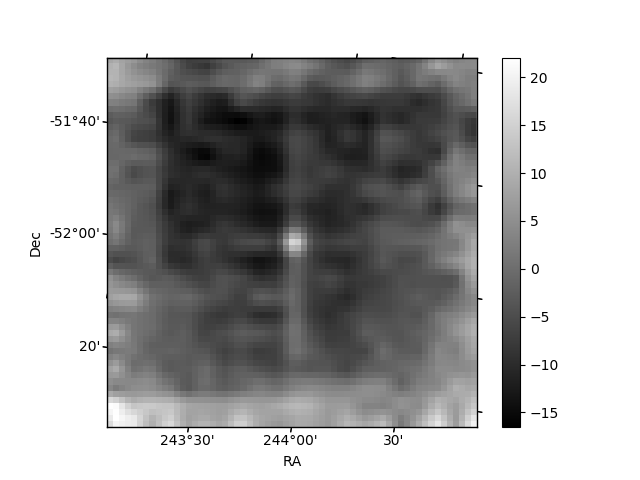
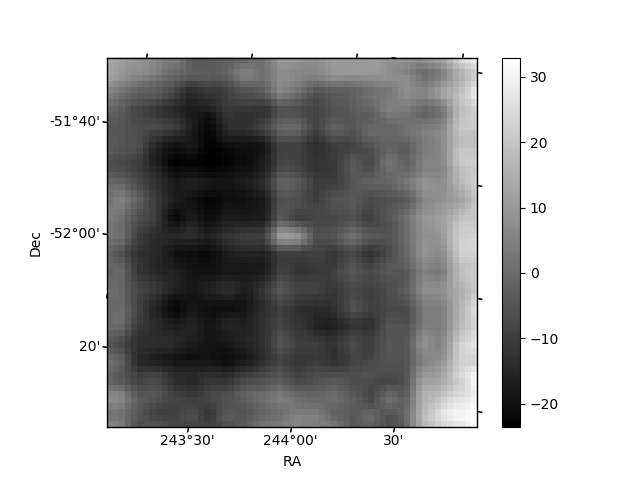
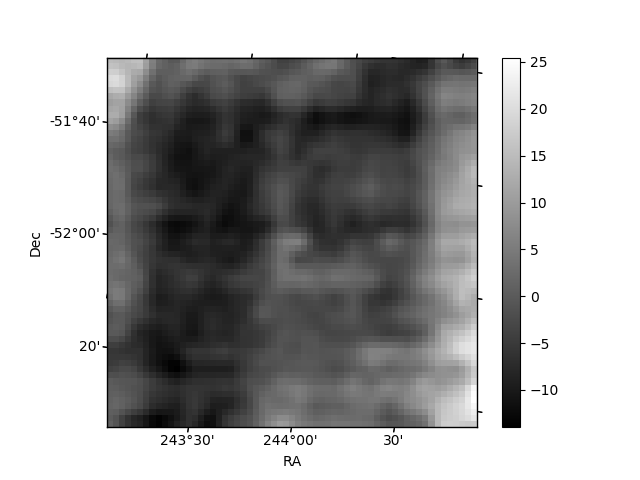
Histogram calculated using DETX and DETY for each event in the final _common_clean file
| Quadrant A | 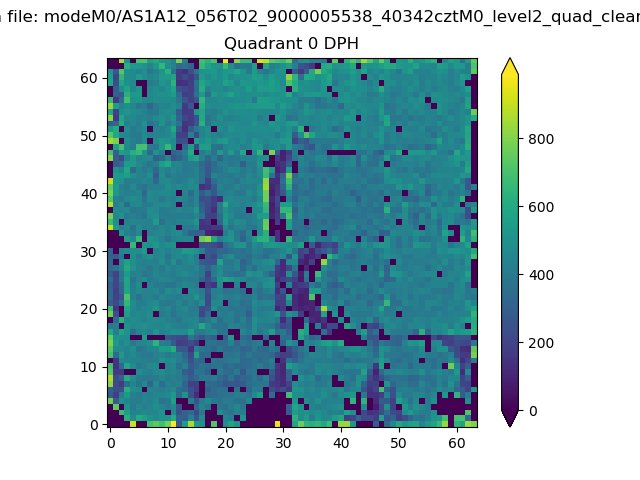 |
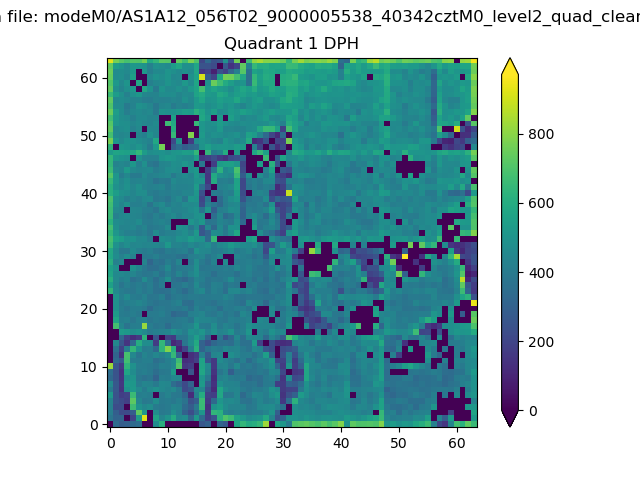 |
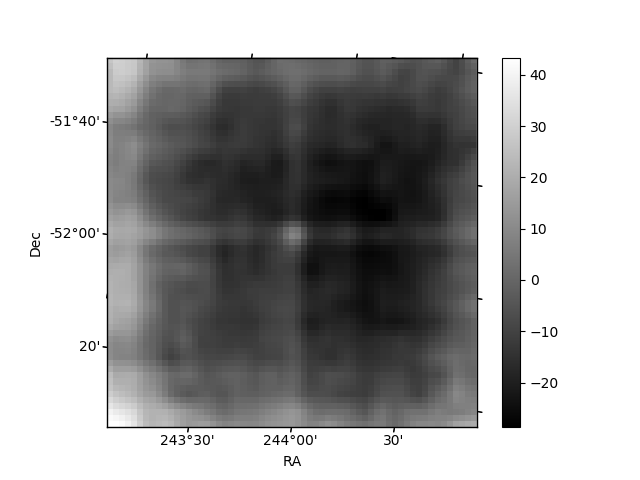
Quadrant B |
|---|---|---|---|
| Quadrant D | 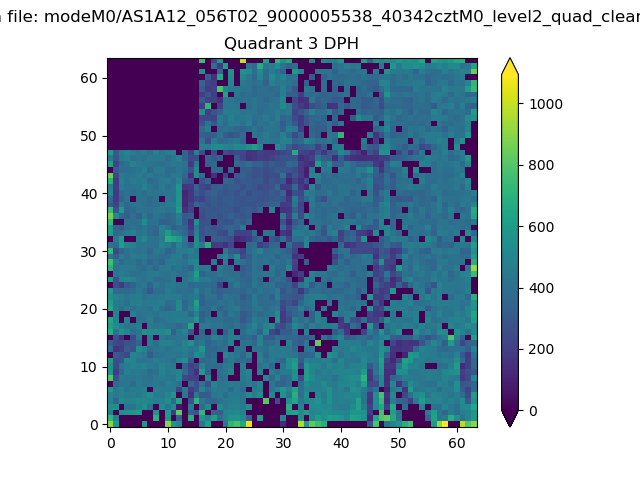 |
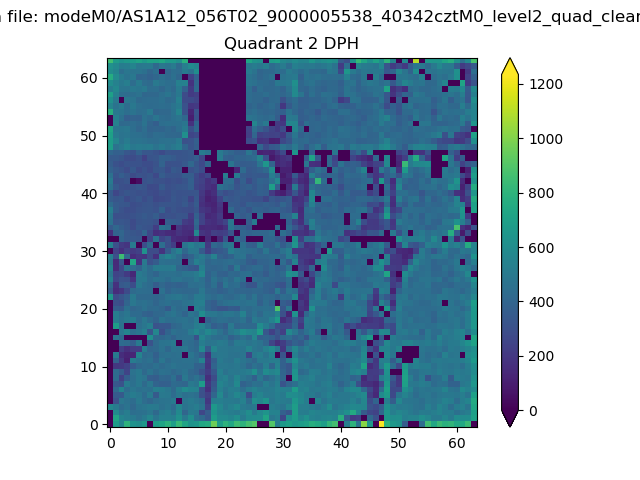 |
Quadrant C |
| Plot type | Count rate plots | Images |
|---|---|---|
| Comparison with Poisson distribution Blue bars denote a histogram of data divided into 1 sec bins. Red curve is a Poisson curve with rate = median count rate of data. |
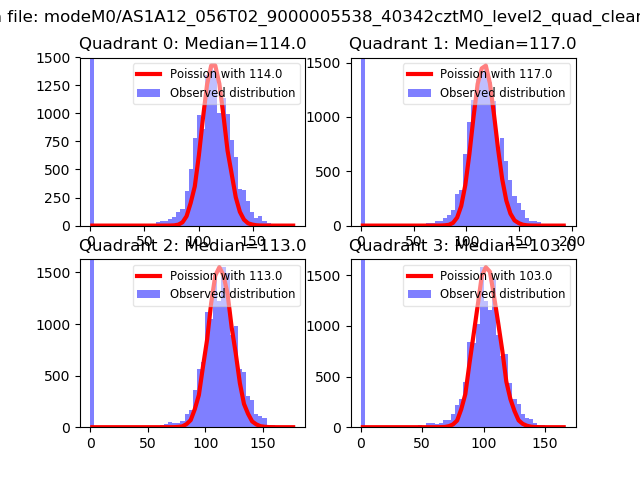 |
 |
| Quadrant-wise count rates Data is divided into 100 sec bins |
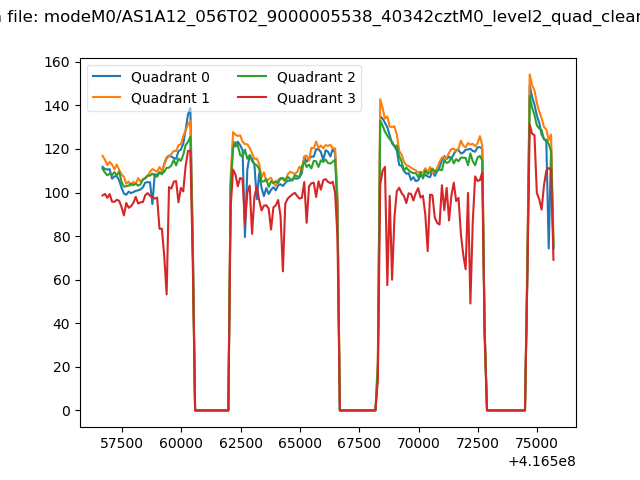 |
|
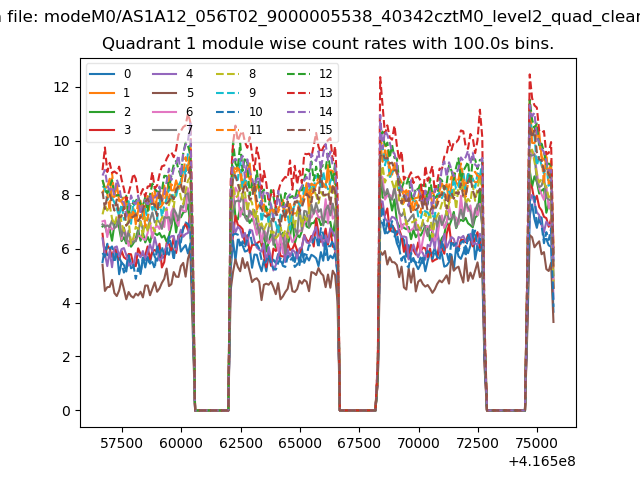
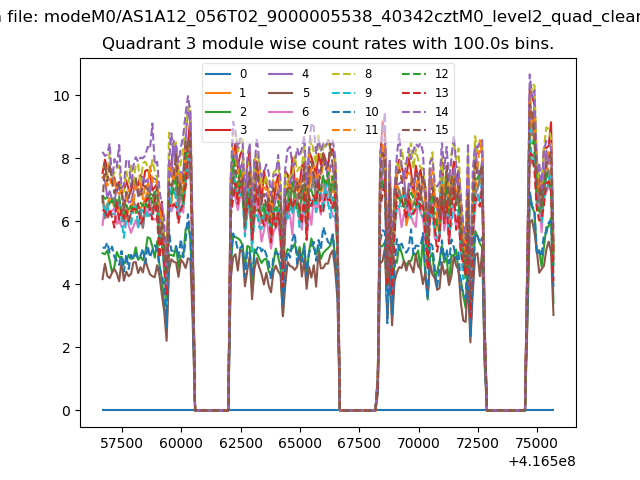
| Module-wise count rates for Quadrant A Data is divided into 100 sec bins |
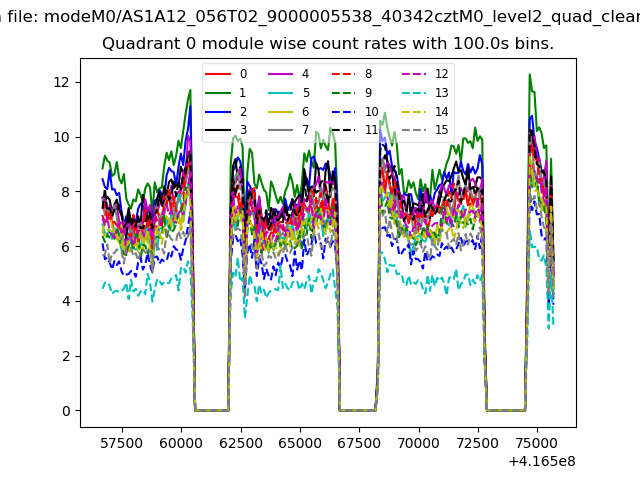 |
 |
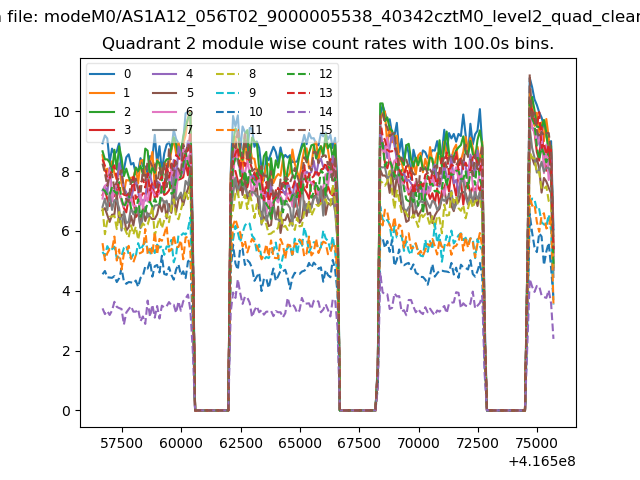
| Module-wise count rates for Quadrant B Data is divided into 100 sec bins |
 |
 |
| Module-wise count rates for Quadrant C Data is divided into 100 sec bins |
 |
 |
| Module-wise count rates for Quadrant D Data is divided into 100 sec bins |
 |
 |
| Parameter | Plot |
|---|---|
| CZT HV Monitor | 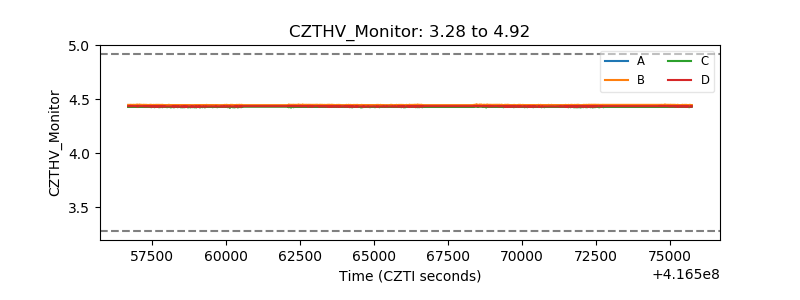 |
| D_VDD | 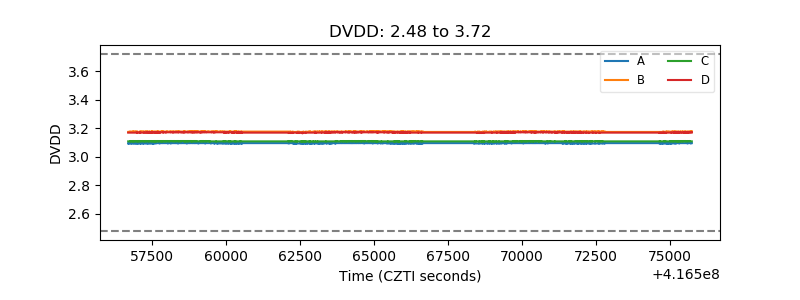 |
| Temperature 1 | 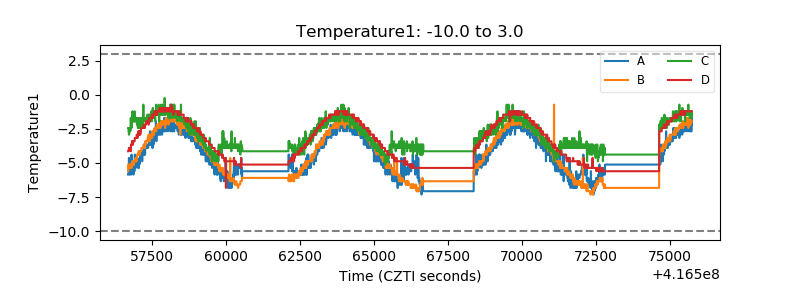 |
| Veto HV Monitor | 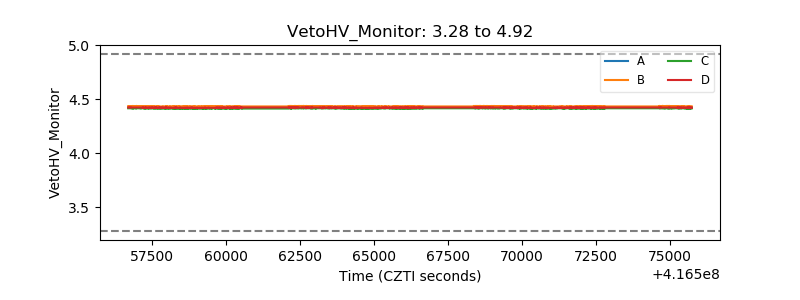 |
| Veto LLD | 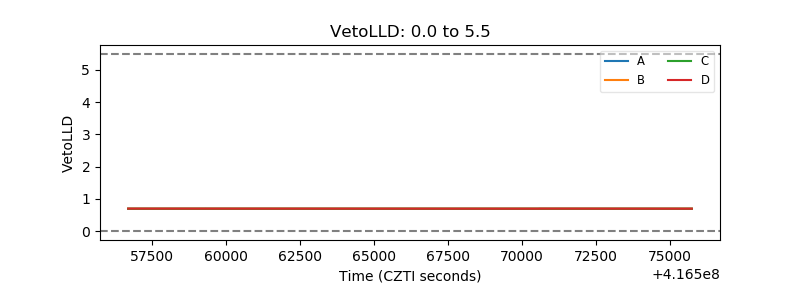 |
| Alpha Counter | 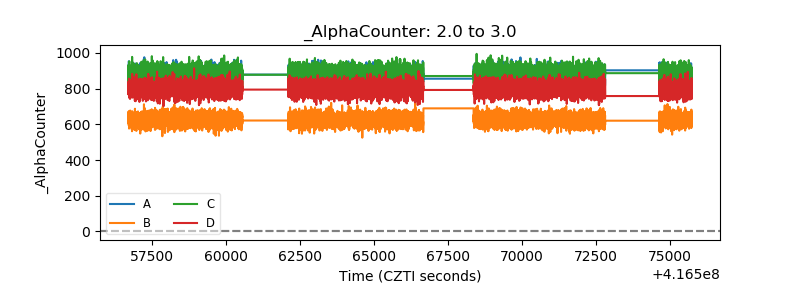 |
| _CPM_Rate | 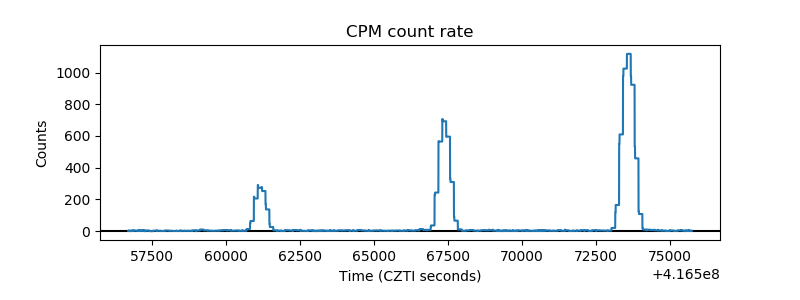 |
| CZT Counter | 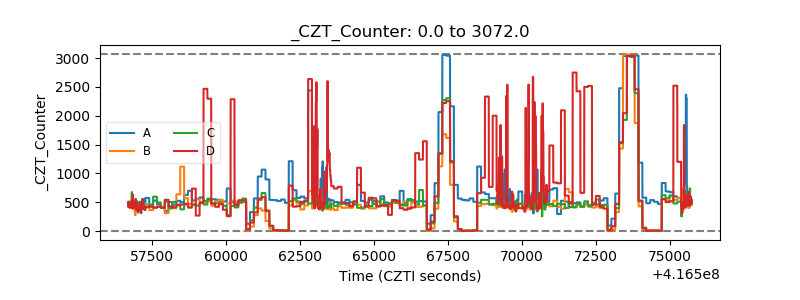 |
| +2.5 Volts monitor | 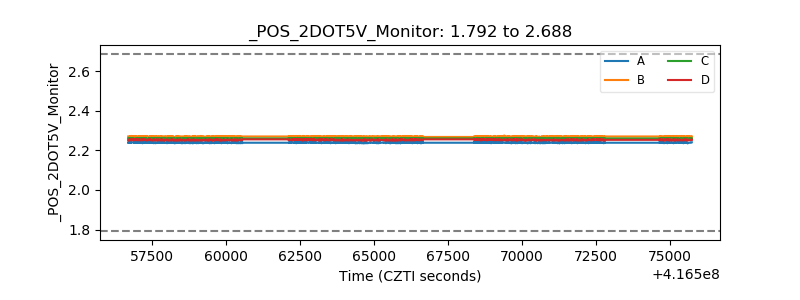 |
| +5 Volts monitor | 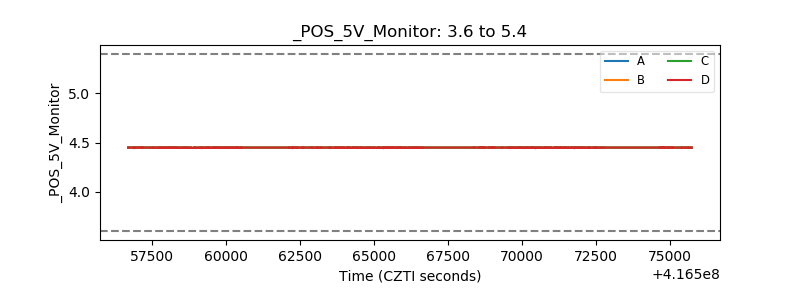 |
| _ROLL_ROT | 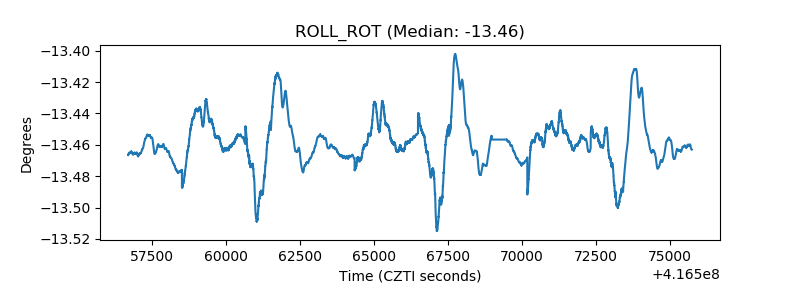 |
| _Roll_DEC | 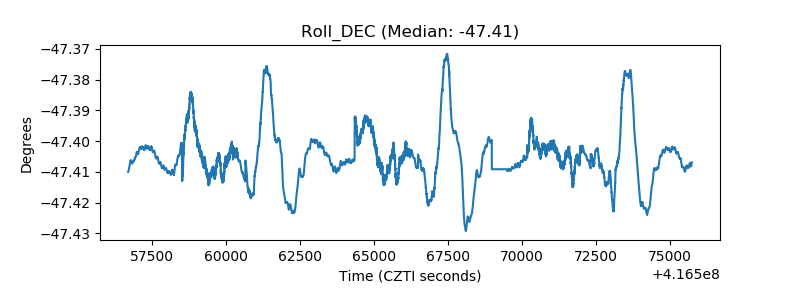 |
| _Roll_RA | 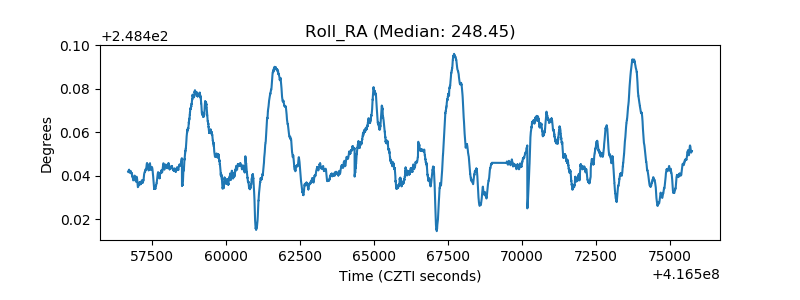 |
| Veto Counter | 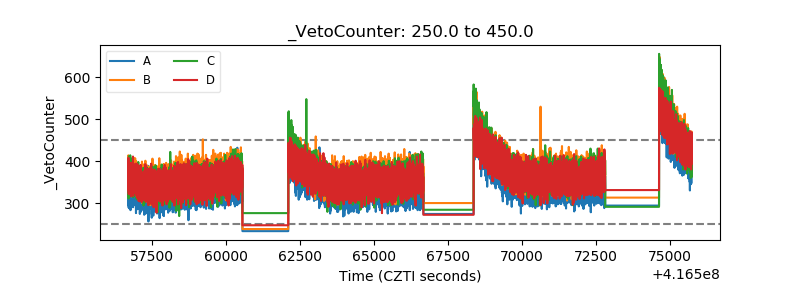 |