| Param | Original file | Final file |
|---|---|---|
| Filename | modeM0/AS1A12_056T02_9000005538_40343cztM0_level2.fits | modeM0/AS1A12_056T02_9000005538_40343cztM0_level2_quad_clean.evt |
| Size (bytes) | 456,131,520 | 95,371,200 |
| Size | 435.0 MB | 91.0 MB |
| Events in quadrant A | 3,316,863 | 688,900 |
| Events in quadrant B | 2,646,543 | 709,063 |
| Events in quadrant C | 3,087,065 | 662,758 |
| Events in quadrant D | 7,412,754 | 448,228 |
| Mode M0 | |||
|---|---|---|---|
| Quadrant | BADHDUFLAG | Total packets | Discarded packets |
| A | 0 | 13255 | 3 |
| B | 0 | 11204 | 2 |
| C | 0 | 12359 | 2 |
| D | 0 | 25661 | 2 |
| Mode M9 | |||
|---|---|---|---|
| Quadrant | BADHDUFLAG | Total packets | Discarded packets |
| A | 0 | 19 | 0 |
| B | 0 | 19 | 0 |
| C | 0 | 19 | 0 |
| D | 0 | 20 | 0 |
| Mode SS | |||
|---|---|---|---|
| Quadrant | BADHDUFLAG | Total packets | Discarded packets |
| A | 0 | 110 | 0 |
| B | 0 | 110 | 0 |
| C | 0 | 110 | 0 |
| D | 0 | 110 | 0 |
| Quadrant | Total seconds | Saturated seconds | Saturation percentage |
|---|---|---|---|
| A | 5416 | 67 | 1.237075% |
| B | 5416 | 21 | 0.387740% |
| C | 5416 | 109 | 2.012555% |
| D | 5416 | 1680 | 31.019202% |
Noise dominated data is calculated using 1-second bins in cleaned event files. If a bin has >2000 counts, and if more than 50% of those come from <1% of pixels, then it is considered to be noise-dominated and hence unusable.
| Quadrant | # 1 sec bins | Bins with >0 counts | Bins with >2000 counts | High rate bins dominated by noise | Noise dominated (total time) | Noise dominated (detector-on time) | Marked lightcurve |
|---|---|---|---|---|---|---|---|
| A | 7358 | 5417 | 53 | 53 | 0.72% | 0.98% | 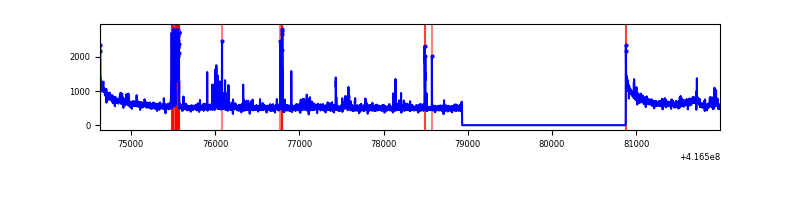 |
| B | 7358 | 5417 | 12 | 12 | 0.16% | 0.22% | 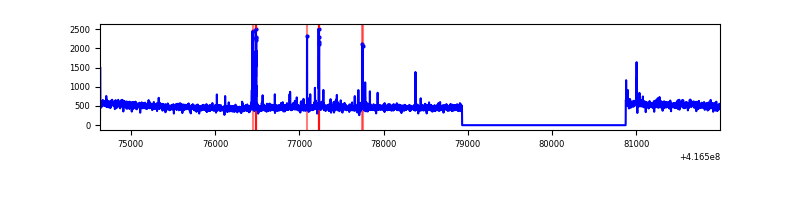 |
| C | 7358 | 5417 | 81 | 81 | 1.10% | 1.50% | 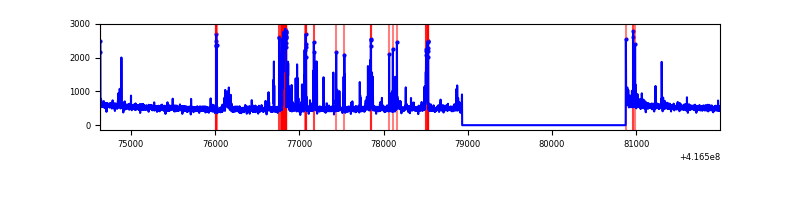 |
| D | 7357 | 5415 | 1737 | 1737 | 23.61% | 32.08% | 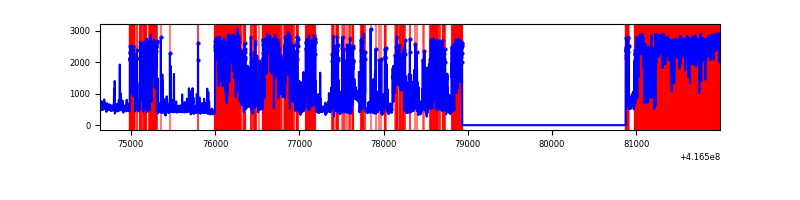 |
Top three noisy pixels from each quadrant. If the there are fewer than three noisy pixels in the level2.evt file, extra rows are filled as -1
| Pixel properties | Quadrant properties | ||||||
|---|---|---|---|---|---|---|---|
| Quadrant | DetID | PixID | Counts | Sigma | Mean | Median | Sigma |
| A | 10 | 83 | 494290 | 3823.33 | 643 | 632 | 129.1 |
| A | 13 | 248 | 185771 | 1433.88 | 643 | 632 | 129.1 |
| A | 6 | 10 | 76016 | 583.84 | 643 | 632 | 129.1 |
| B | 0 | 230 | 51053 | 417.18 | 639 | 623 | 120.9 |
| B | 0 | 245 | 42875 | 349.53 | 639 | 623 | 120.9 |
| B | 4 | 170 | 25228 | 203.54 | 639 | 623 | 120.9 |
| C | 14 | 254 | 408693 | 2875.14 | 617 | 622 | 141.9 |
| C | 15 | 214 | 246237 | 1730.53 | 617 | 622 | 141.9 |
| C | 0 | 10 | 13209 | 88.68 | 617 | 622 | 141.9 |
| D | 12 | 233 | 3527243 | 26944.26 | 535 | 522 | 130.9 |
| D | 12 | 227 | 1527667 | 11667.44 | 535 | 522 | 130.9 |
| D | 2 | 250 | 109069 | 829.3 | 535 | 522 | 130.9 |
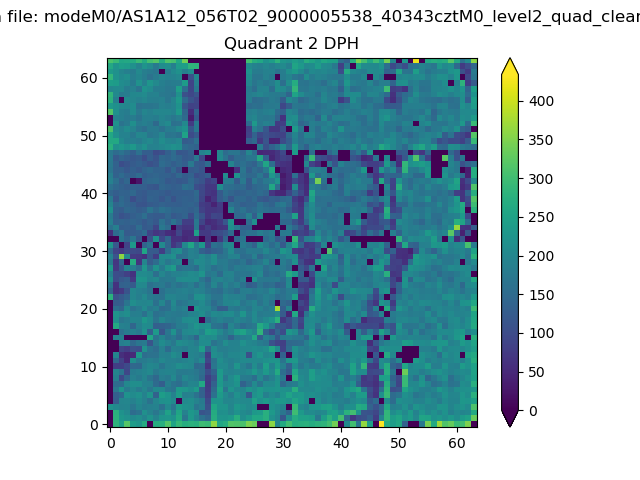
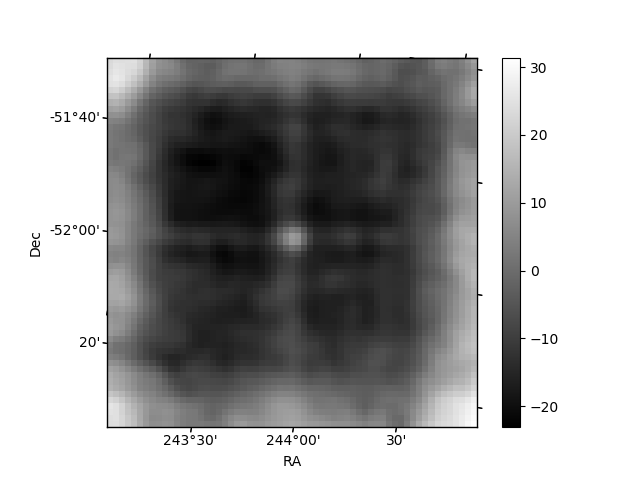
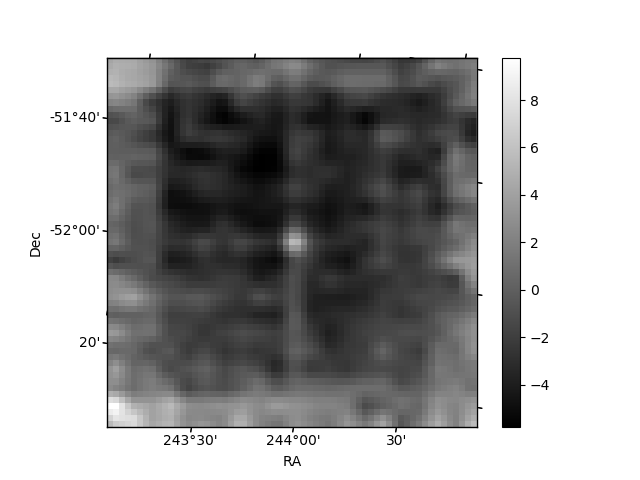
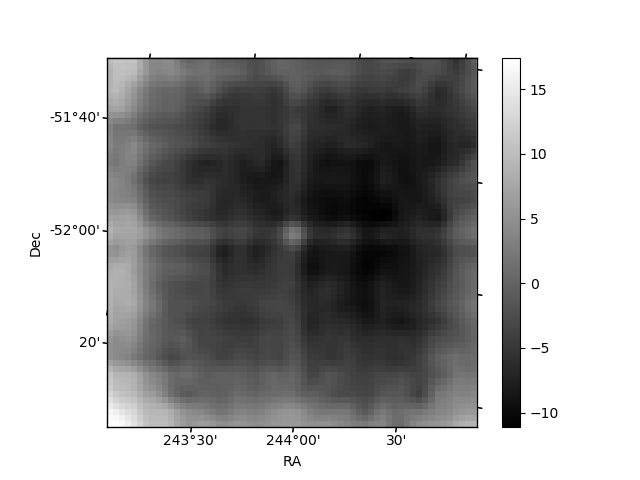
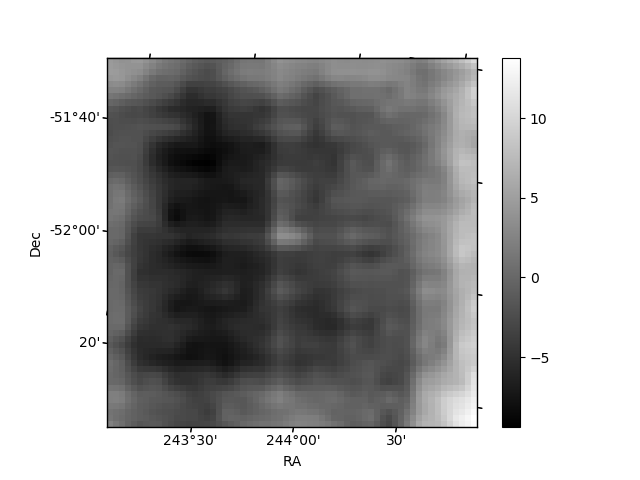
Histogram calculated using DETX and DETY for each event in the final _common_clean file
| Quadrant A | 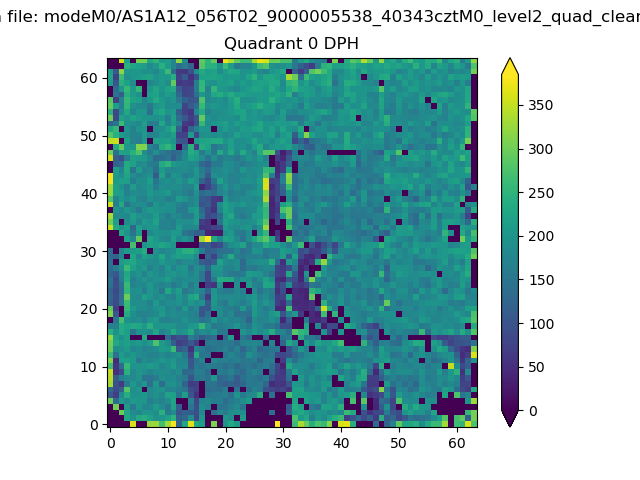 |
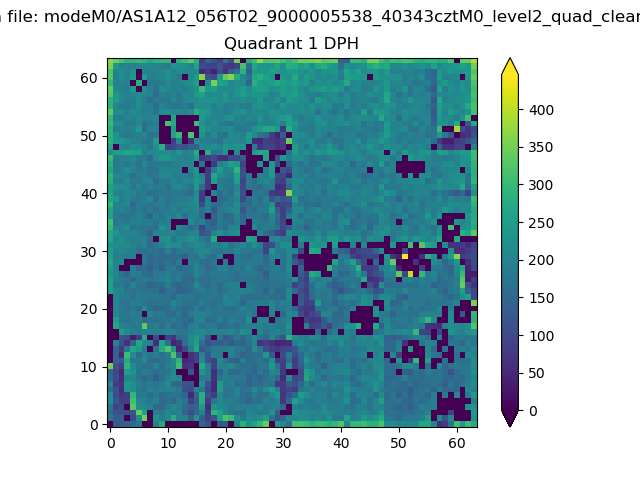 |
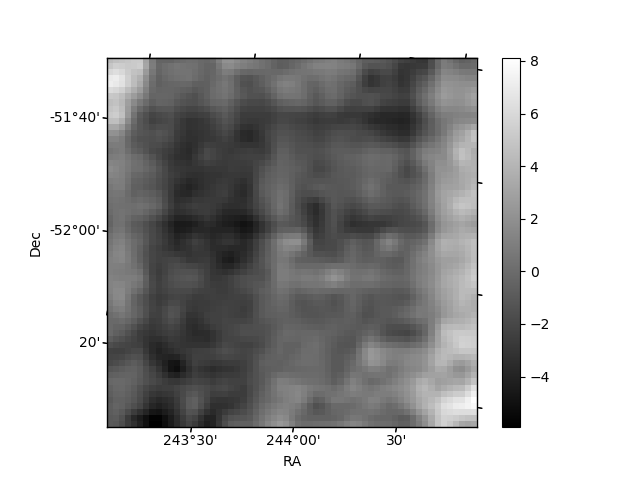
Quadrant B |
|---|---|---|---|
| Quadrant D | 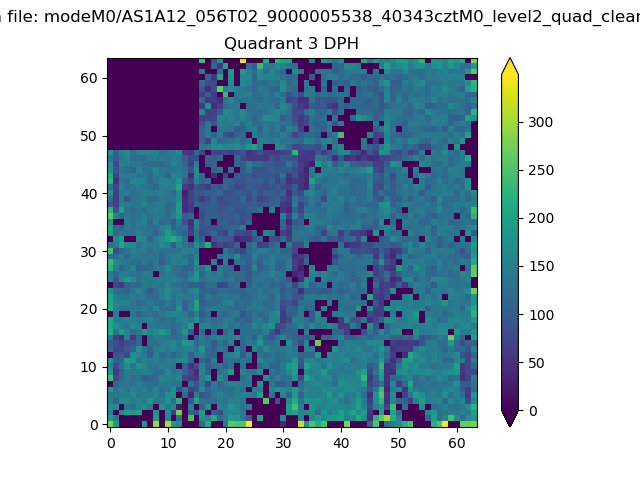 |
 |
Quadrant C |
| Plot type | Count rate plots | Images |
|---|---|---|
| Comparison with Poisson distribution Blue bars denote a histogram of data divided into 1 sec bins. Red curve is a Poisson curve with rate = median count rate of data. |
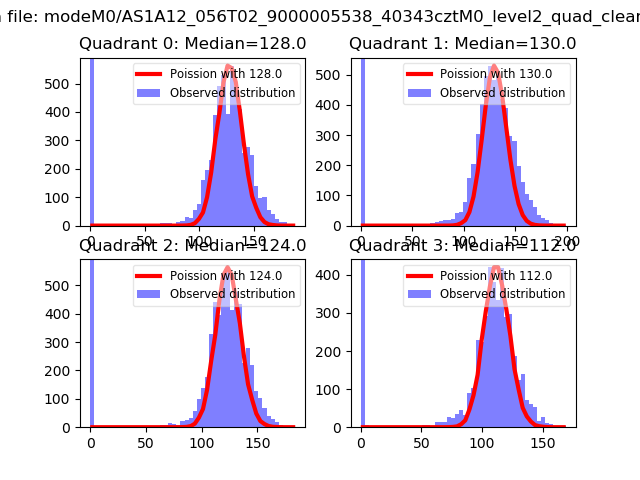 |
 |
| Quadrant-wise count rates Data is divided into 100 sec bins |
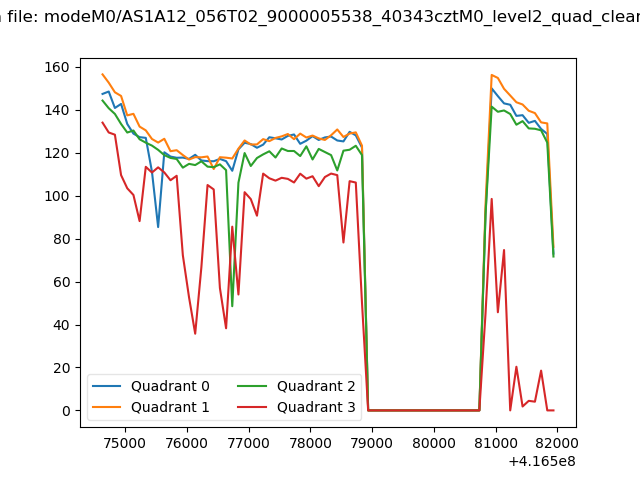 |
|
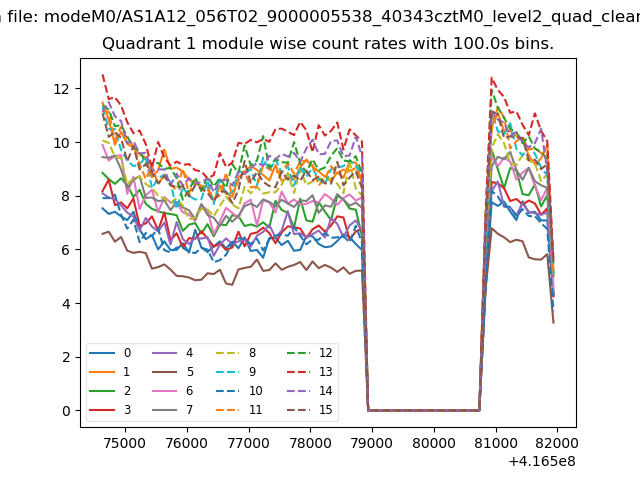
| Module-wise count rates for Quadrant A Data is divided into 100 sec bins |
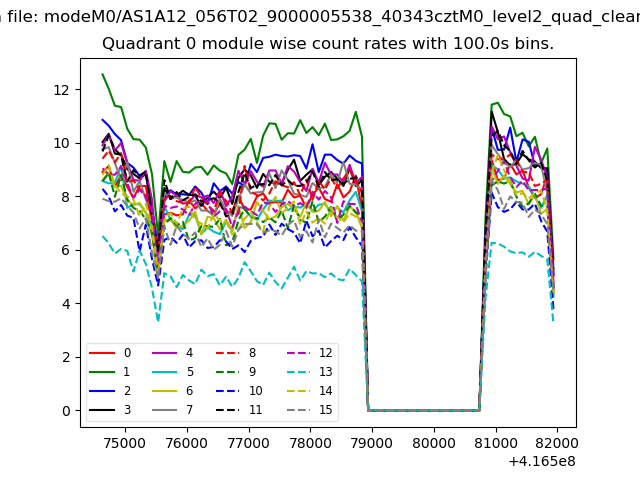 |
 |
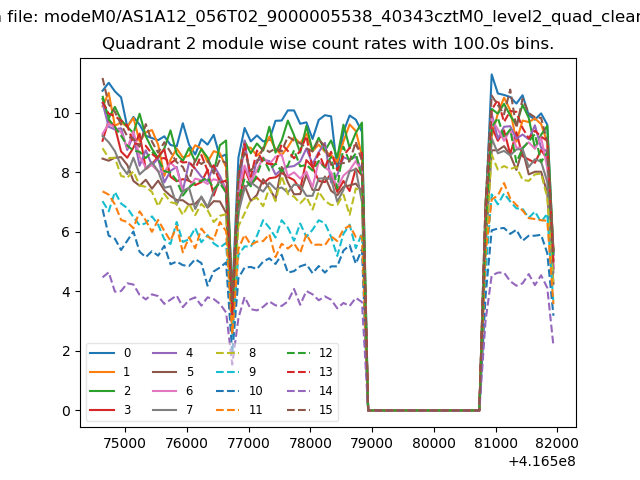
| Module-wise count rates for Quadrant B Data is divided into 100 sec bins |
 |
 |
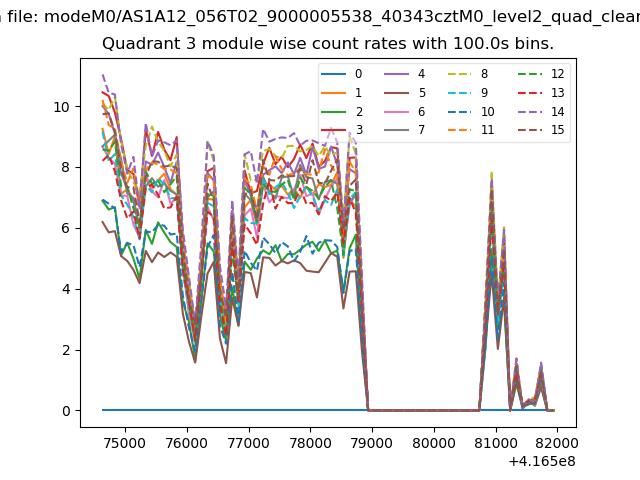
| Module-wise count rates for Quadrant C Data is divided into 100 sec bins |
 |
 |
| Module-wise count rates for Quadrant D Data is divided into 100 sec bins |
 |
 |
| Parameter | Plot |
|---|---|
| CZT HV Monitor |  |
| D_VDD | 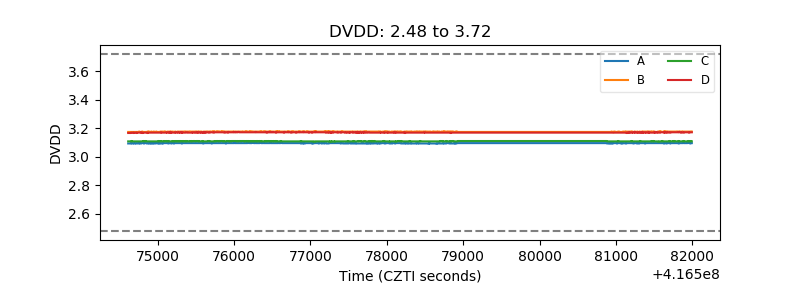 |
| Temperature 1 | 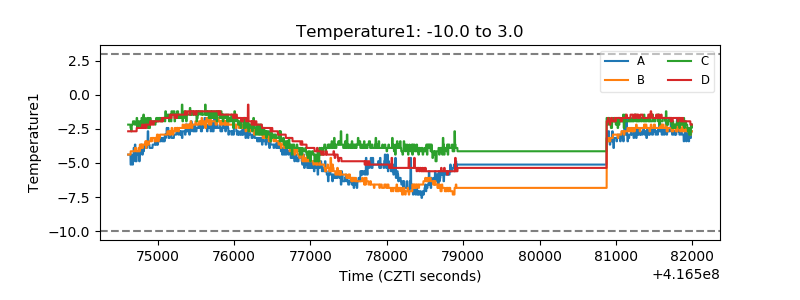 |
| Veto HV Monitor | 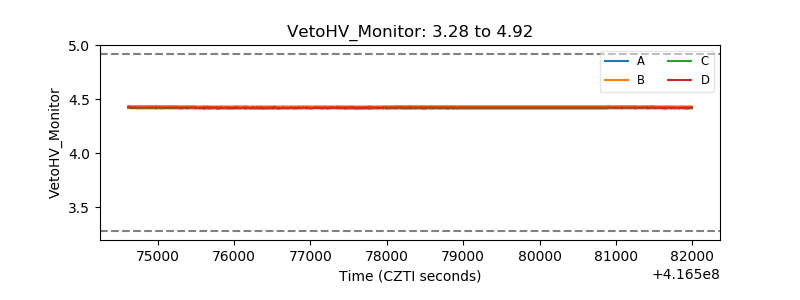 |
| Veto LLD | 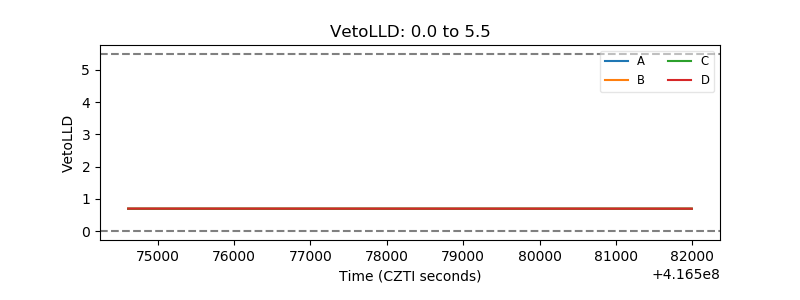 |
| Alpha Counter | 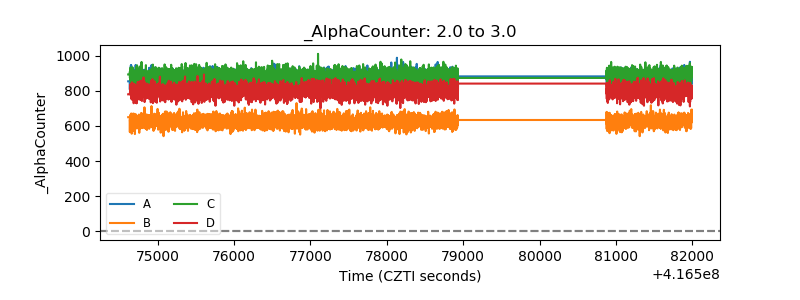 |
| _CPM_Rate | 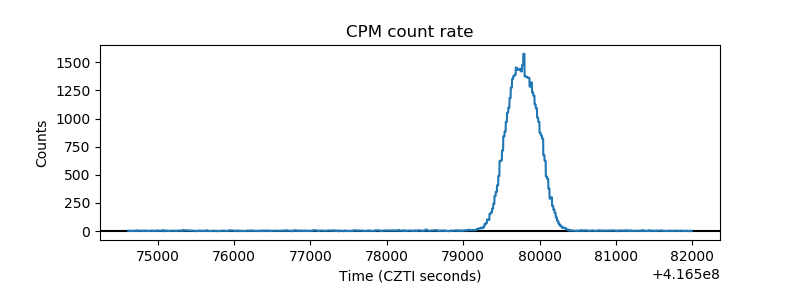 |
| CZT Counter | 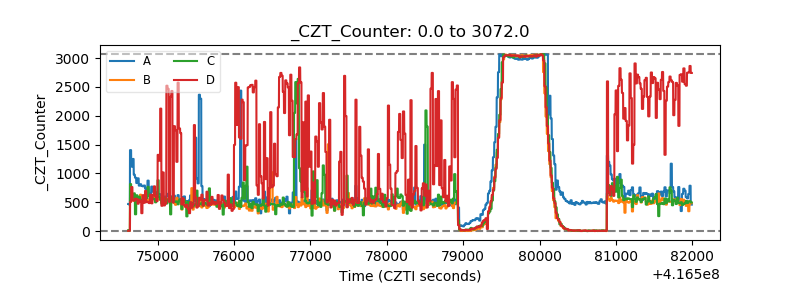 |
| +2.5 Volts monitor | 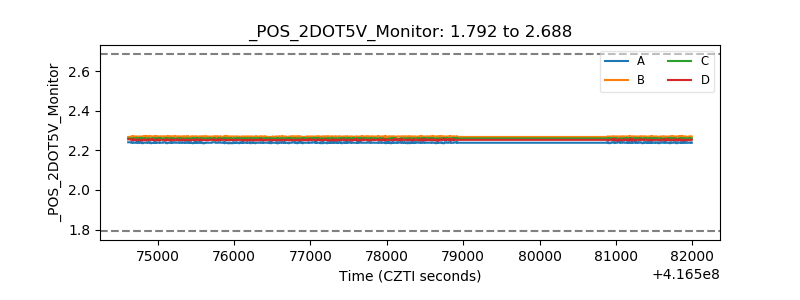 |
| +5 Volts monitor | 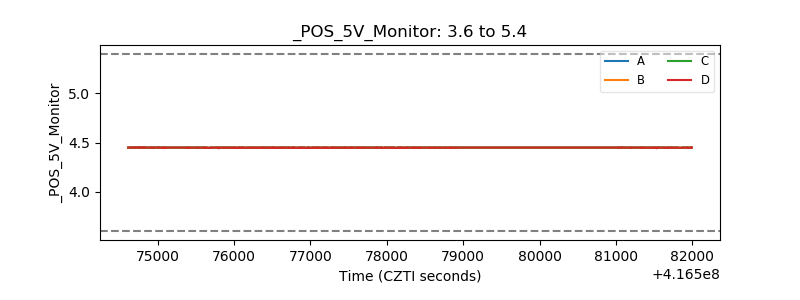 |
| _ROLL_ROT | 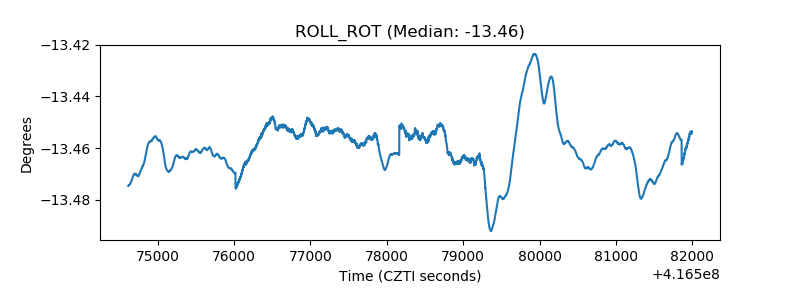 |
| _Roll_DEC | 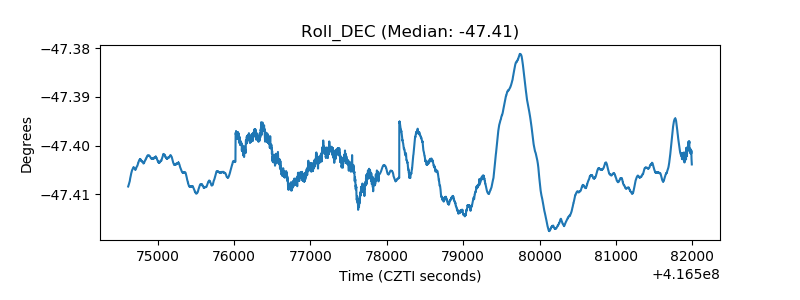 |
| _Roll_RA | 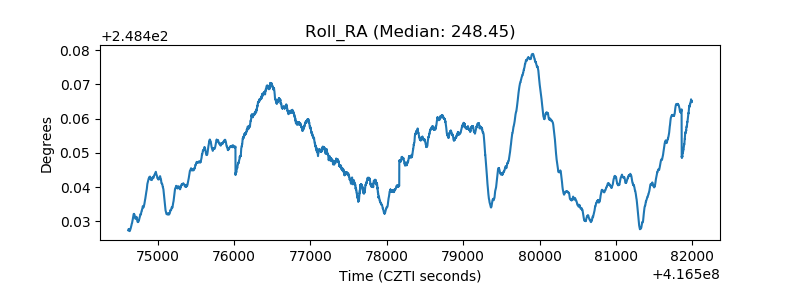 |
| Veto Counter | 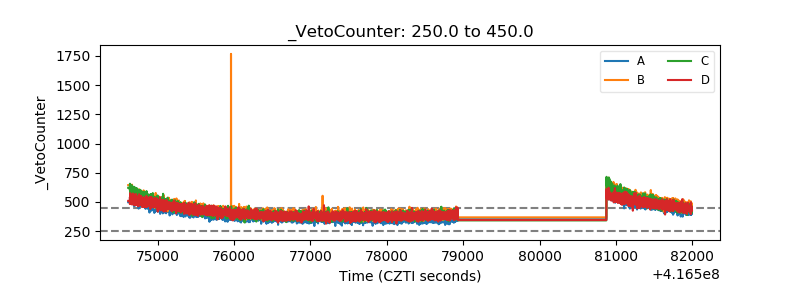 |