| Param | Original file | Final file |
|---|---|---|
| Filename | modeM0/AS1A12_056T02_9000005538_40344cztM0_level2.fits | modeM0/AS1A12_056T02_9000005538_40344cztM0_level2_quad_clean.evt |
| Size (bytes) | 453,098,880 | 94,910,400 |
| Size | 432.1 MB | 90.5 MB |
| Events in quadrant A | 3,792,998 | 688,065 |
| Events in quadrant B | 2,586,094 | 720,246 |
| Events in quadrant C | 2,803,314 | 676,520 |
| Events in quadrant D | 7,177,561 | 418,861 |
| Mode M0 | |||
|---|---|---|---|
| Quadrant | BADHDUFLAG | Total packets | Discarded packets |
| A | 0 | 15160 | 3 |
| B | 0 | 10850 | 2 |
| C | 0 | 11365 | 2 |
| D | 0 | 24893 | 2 |
| Mode M9 | |||
|---|---|---|---|
| Quadrant | BADHDUFLAG | Total packets | Discarded packets |
| A | 0 | 29 | 0 |
| B | 0 | 29 | 0 |
| C | 0 | 29 | 0 |
| D | 0 | 30 | 0 |
| Mode SS | |||
|---|---|---|---|
| Quadrant | BADHDUFLAG | Total packets | Discarded packets |
| A | 0 | 106 | 0 |
| B | 0 | 106 | 0 |
| C | 0 | 106 | 0 |
| D | 0 | 106 | 0 |
| Quadrant | Total seconds | Saturated seconds | Saturation percentage |
|---|---|---|---|
| A | 5296 | 177 | 3.342145% |
| B | 5296 | 12 | 0.226586% |
| C | 5296 | 22 | 0.415408% |
| D | 5296 | 1851 | 34.950906% |
Noise dominated data is calculated using 1-second bins in cleaned event files. If a bin has >2000 counts, and if more than 50% of those come from <1% of pixels, then it is considered to be noise-dominated and hence unusable.
| Quadrant | # 1 sec bins | Bins with >0 counts | Bins with >2000 counts | High rate bins dominated by noise | Noise dominated (total time) | Noise dominated (detector-on time) | Marked lightcurve |
|---|---|---|---|---|---|---|---|
| A | 7329 | 5297 | 164 | 164 | 2.24% | 3.10% | 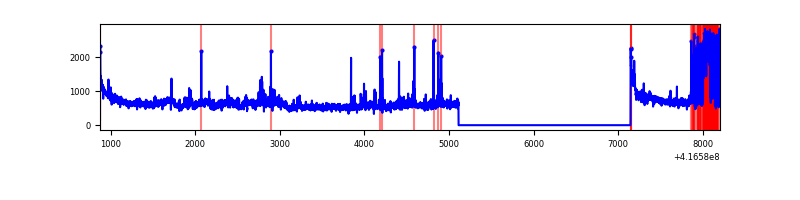 |
| B | 7329 | 5297 | 2 | 2 | 0.03% | 0.04% | 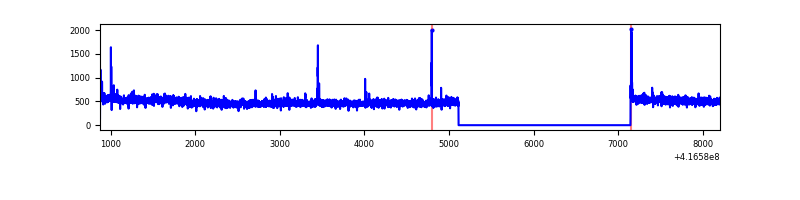 |
| C | 7329 | 5297 | 16 | 16 | 0.22% | 0.30% | 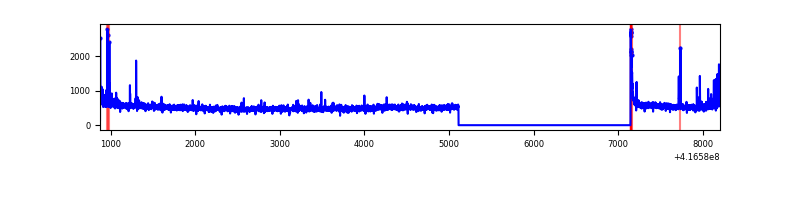 |
| D | 7329 | 5297 | 1872 | 1872 | 25.54% | 35.34% | 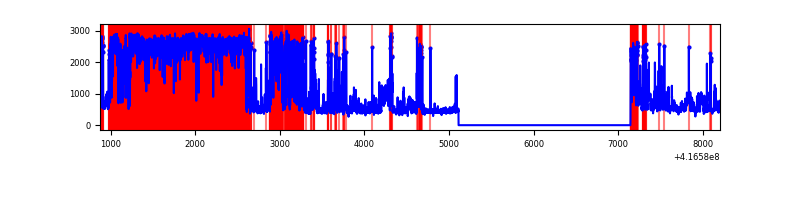 |
Top three noisy pixels from each quadrant. If the there are fewer than three noisy pixels in the level2.evt file, extra rows are filled as -1
| Pixel properties | Quadrant properties | ||||||
|---|---|---|---|---|---|---|---|
| Quadrant | DetID | PixID | Counts | Sigma | Mean | Median | Sigma |
| A | 10 | 83 | 481315 | 3773.27 | 634 | 625 | 127.4 |
| A | 13 | 248 | 432638 | 3391.17 | 634 | 625 | 127.4 |
| A | 6 | 10 | 336048 | 2632.97 | 634 | 625 | 127.4 |
| B | 0 | 230 | 32623 | 266.98 | 639 | 623 | 119.9 |
| B | 5 | 255 | 20144 | 162.87 | 639 | 623 | 119.9 |
| B | 0 | 245 | 17471 | 140.57 | 639 | 623 | 119.9 |
| C | 15 | 214 | 244320 | 1728.98 | 617 | 622 | 140.9 |
| C | 14 | 254 | 57424 | 403.0 | 617 | 622 | 140.9 |
| C | 0 | 10 | 44927 | 314.33 | 617 | 622 | 140.9 |
| D | 12 | 233 | 2933721 | 23857.01 | 507 | 495 | 123.0 |
| D | 12 | 227 | 1377855 | 11202.58 | 507 | 495 | 123.0 |
| D | 2 | 250 | 653237 | 5308.99 | 507 | 495 | 123.0 |
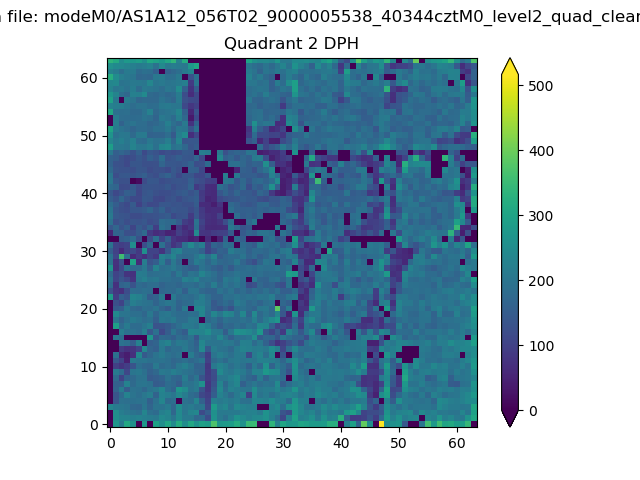
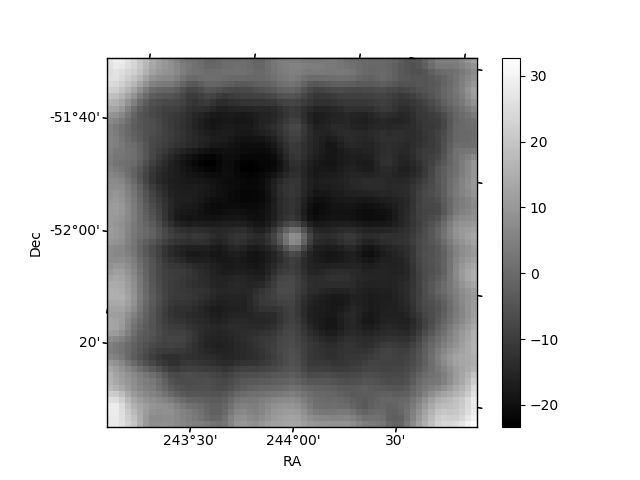
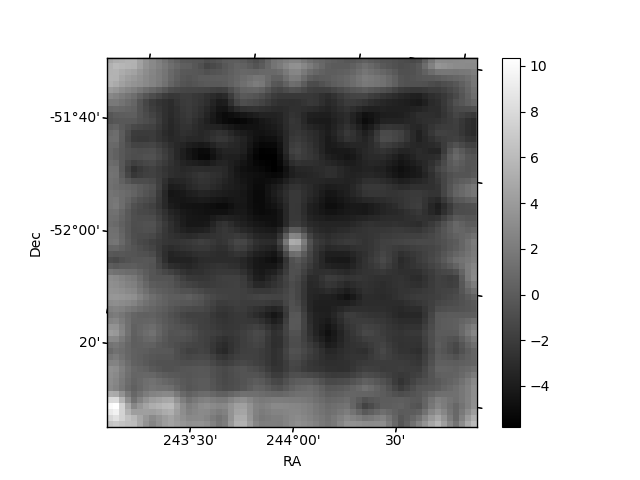
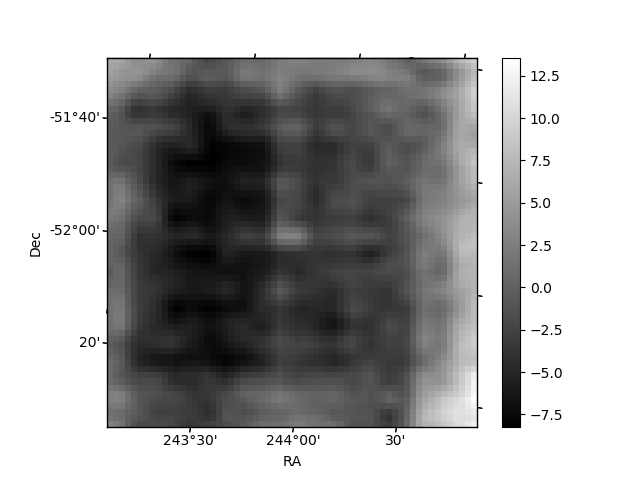
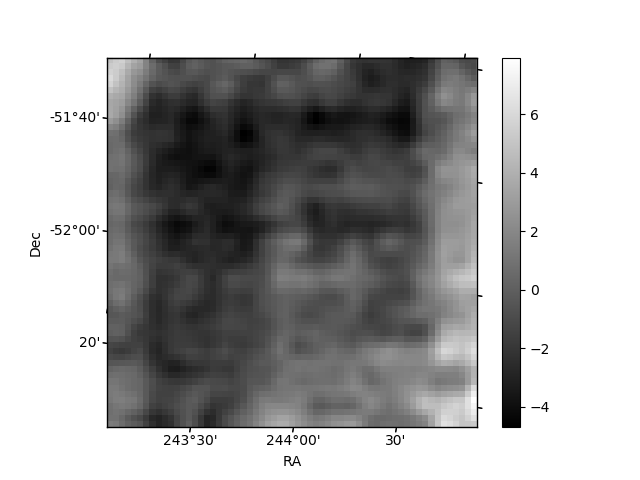
Histogram calculated using DETX and DETY for each event in the final _common_clean file
| Quadrant A | 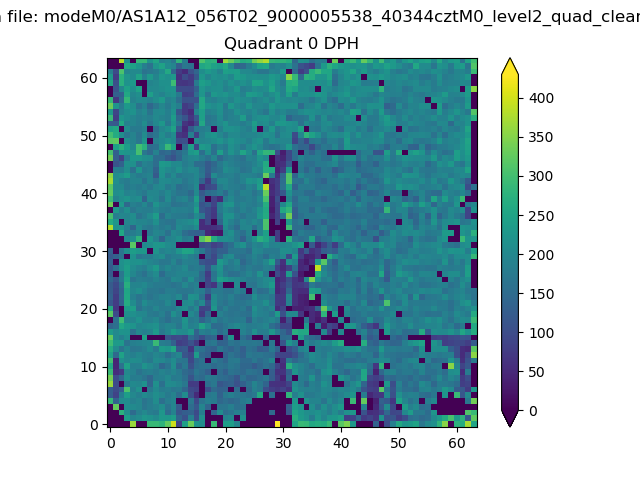 |
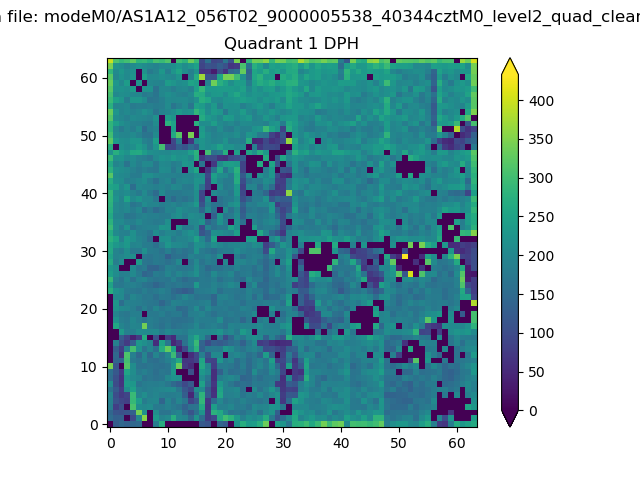 |
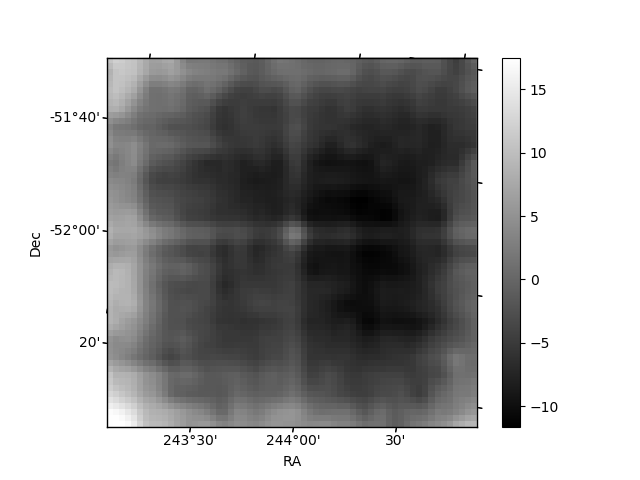
Quadrant B |
|---|---|---|---|
| Quadrant D | 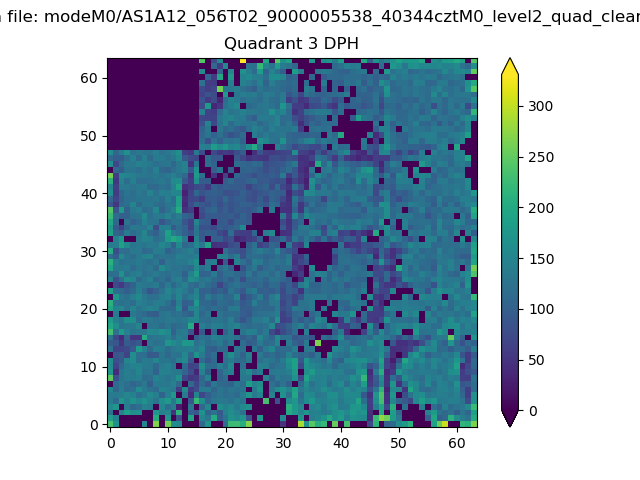 |
 |
Quadrant C |
| Plot type | Count rate plots | Images |
|---|---|---|
| Comparison with Poisson distribution Blue bars denote a histogram of data divided into 1 sec bins. Red curve is a Poisson curve with rate = median count rate of data. |
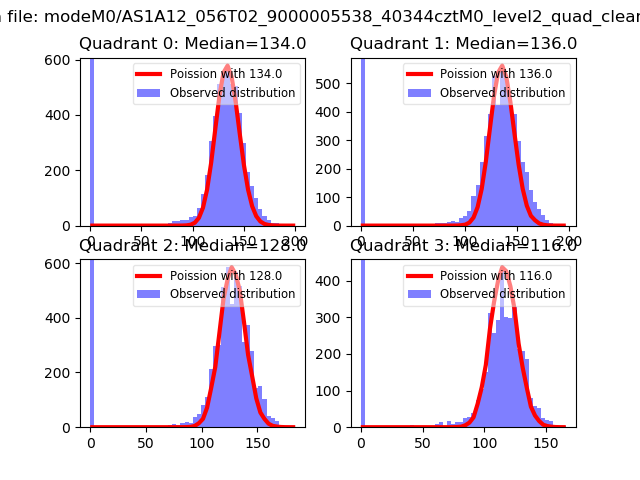 |
 |
| Quadrant-wise count rates Data is divided into 100 sec bins |
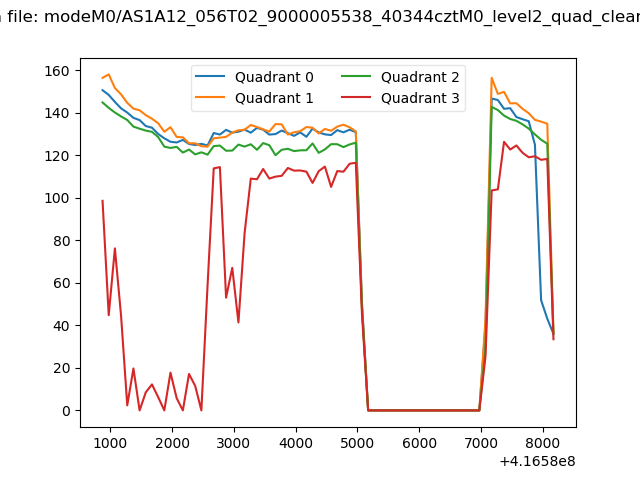 |
|
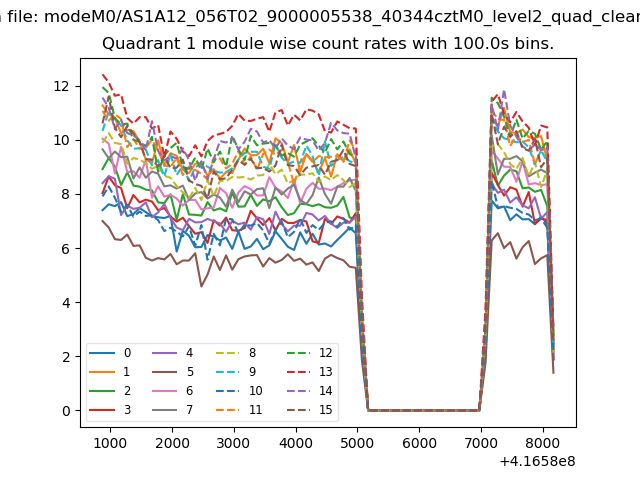
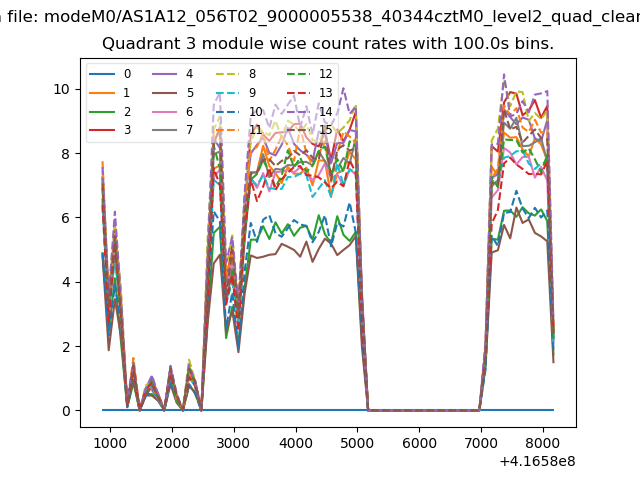
| Module-wise count rates for Quadrant A Data is divided into 100 sec bins |
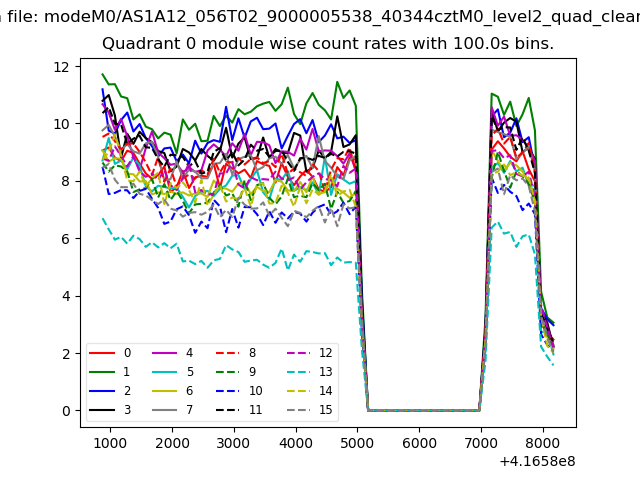 |
 |
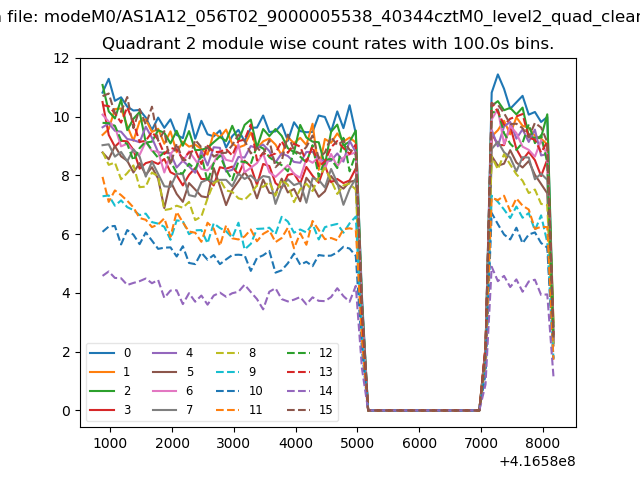
| Module-wise count rates for Quadrant B Data is divided into 100 sec bins |
 |
 |
| Module-wise count rates for Quadrant C Data is divided into 100 sec bins |
 |
 |
| Module-wise count rates for Quadrant D Data is divided into 100 sec bins |
 |
 |
| Parameter | Plot |
|---|---|
| CZT HV Monitor | 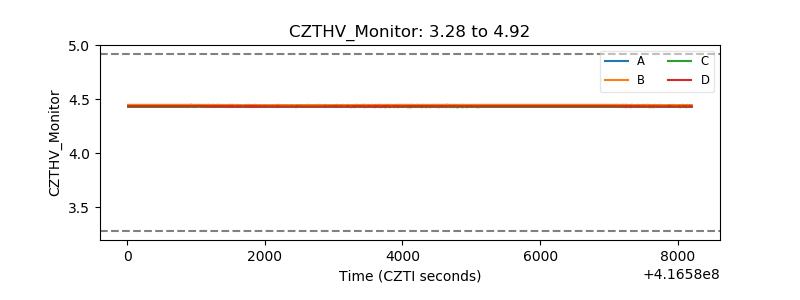 |
| D_VDD | 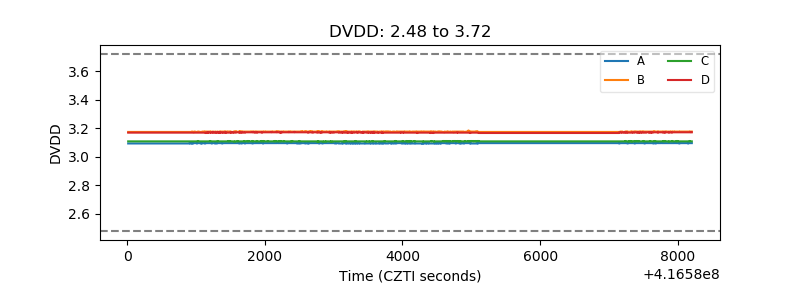 |
| Temperature 1 | 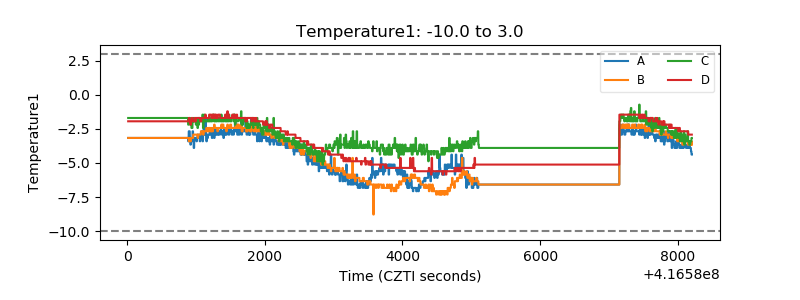 |
| Veto HV Monitor | 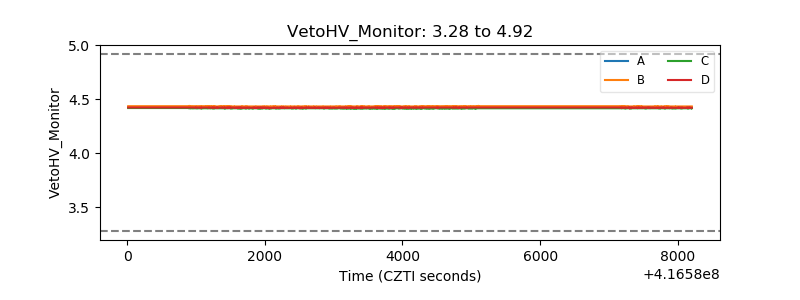 |
| Veto LLD | 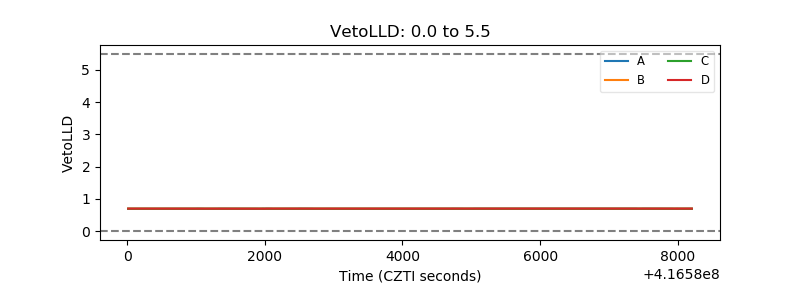 |
| Alpha Counter | 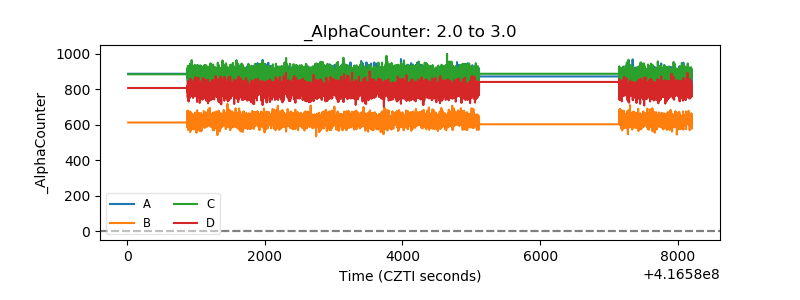 |
| _CPM_Rate | 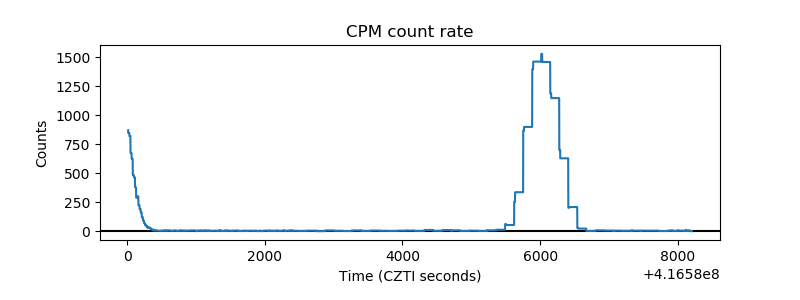 |
| CZT Counter | 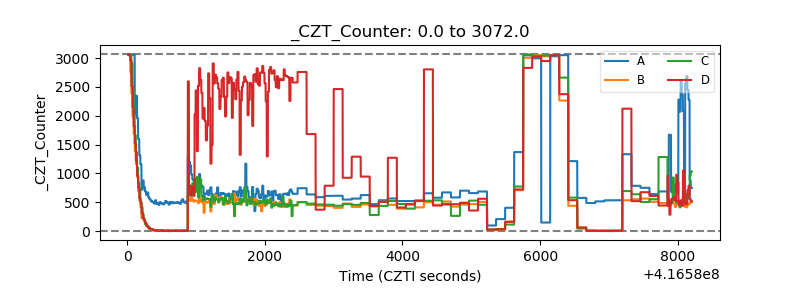 |
| +2.5 Volts monitor | 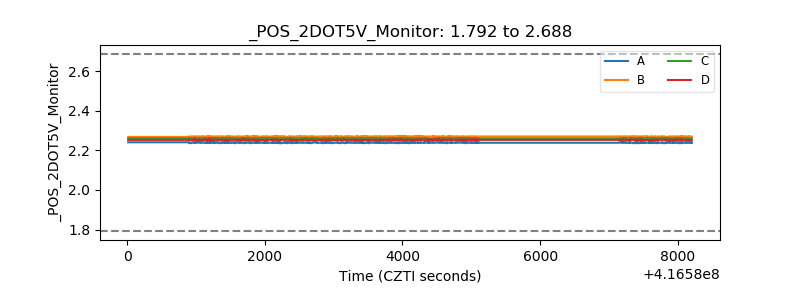 |
| +5 Volts monitor | 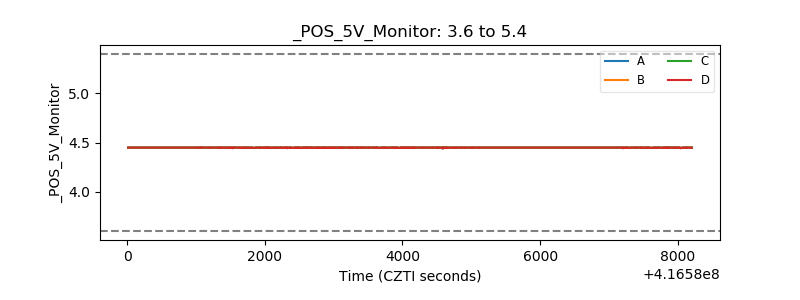 |
| _ROLL_ROT | 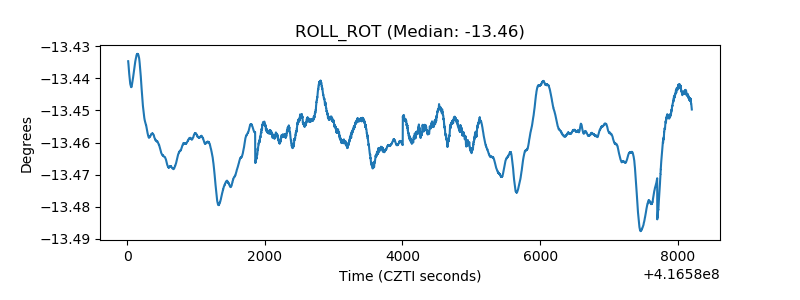 |
| _Roll_DEC | 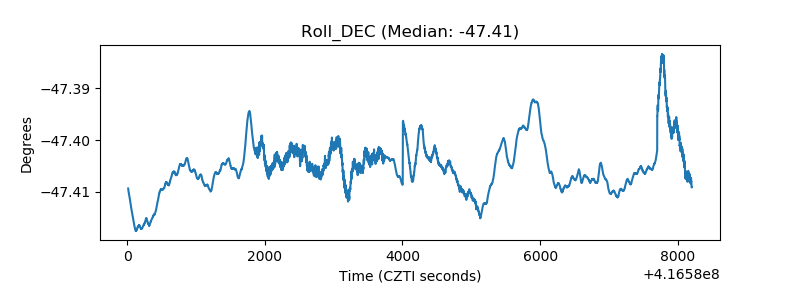 |
| _Roll_RA | 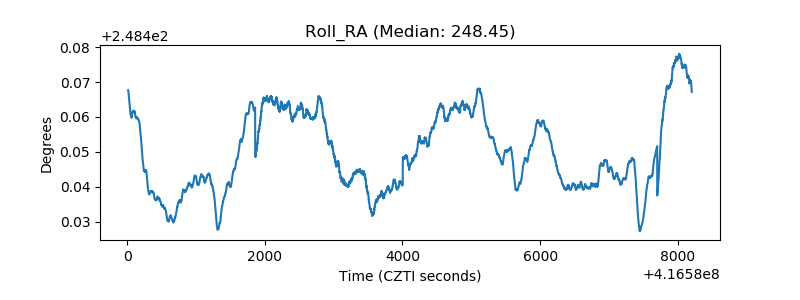 |
| Veto Counter | 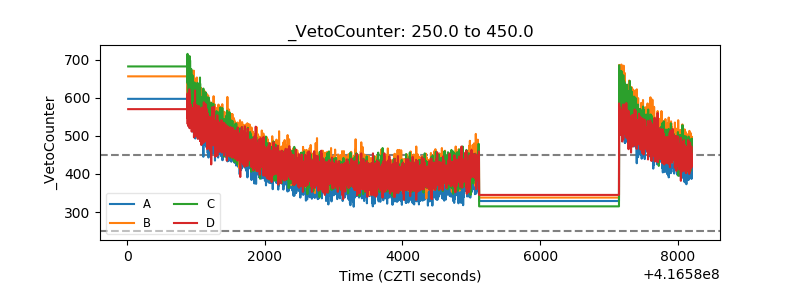 |