| Param | Original file | Final file |
|---|---|---|
| Filename | modeM0/AS1A12_056T02_9000005538_40345cztM0_level2.fits | modeM0/AS1A12_056T02_9000005538_40345cztM0_level2_quad_clean.evt |
| Size (bytes) | 388,010,880 | 93,061,440 |
| Size | 370.0 MB | 88.8 MB |
| Events in quadrant A | 3,912,534 | 640,946 |
| Events in quadrant B | 2,469,683 | 680,064 |
| Events in quadrant C | 2,817,663 | 632,582 |
| Events in quadrant D | 4,770,810 | 511,901 |
| Mode M0 | |||
|---|---|---|---|
| Quadrant | BADHDUFLAG | Total packets | Discarded packets |
| A | 0 | 15116 | 3 |
| B | 0 | 10386 | 2 |
| C | 0 | 11254 | 2 |
| D | 0 | 17510 | 2 |
| Mode M9 | |||
|---|---|---|---|
| Quadrant | BADHDUFLAG | Total packets | Discarded packets |
| A | 0 | 29 | 0 |
| B | 0 | 29 | 0 |
| C | 0 | 29 | 0 |
| D | 0 | 30 | 0 |
| Mode SS | |||
|---|---|---|---|
| Quadrant | BADHDUFLAG | Total packets | Discarded packets |
| A | 0 | 100 | 0 |
| B | 0 | 100 | 0 |
| C | 0 | 100 | 0 |
| D | 0 | 100 | 0 |
| Quadrant | Total seconds | Saturated seconds | Saturation percentage |
|---|---|---|---|
| A | 5039 | 259 | 5.139909% |
| B | 5039 | 25 | 0.496130% |
| C | 5039 | 53 | 1.051796% |
| D | 5039 | 772 | 15.320500% |
Noise dominated data is calculated using 1-second bins in cleaned event files. If a bin has >2000 counts, and if more than 50% of those come from <1% of pixels, then it is considered to be noise-dominated and hence unusable.
| Quadrant | # 1 sec bins | Bins with >0 counts | Bins with >2000 counts | High rate bins dominated by noise | Noise dominated (total time) | Noise dominated (detector-on time) | Marked lightcurve |
|---|---|---|---|---|---|---|---|
| A | 7162 | 5040 | 230 | 230 | 3.21% | 4.56% | 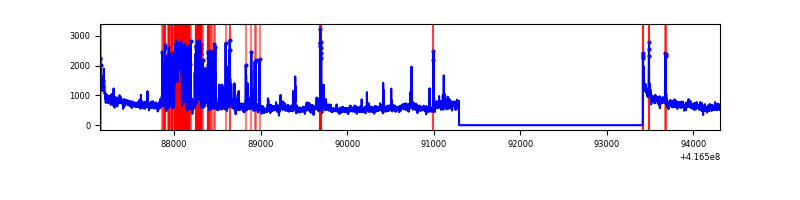 |
| B | 7162 | 5040 | 15 | 15 | 0.21% | 0.30% | 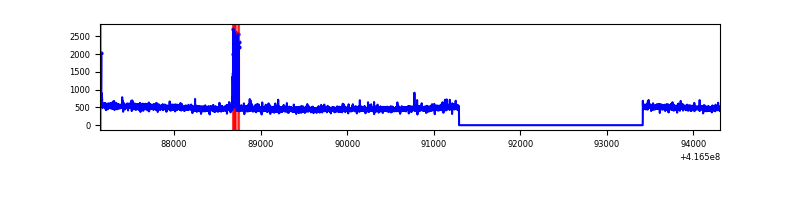 |
| C | 7162 | 5040 | 46 | 46 | 0.64% | 0.91% | 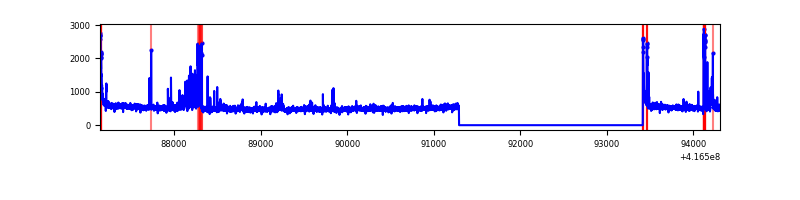 |
| D | 7161 | 5039 | 803 | 803 | 11.21% | 15.94% | 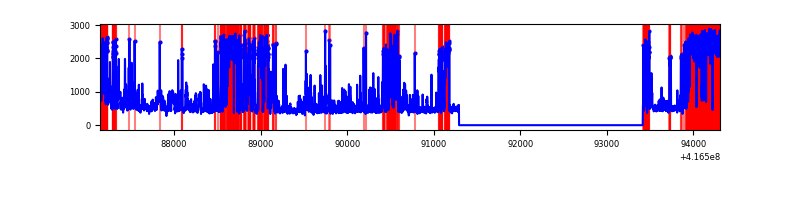 |
Top three noisy pixels from each quadrant. If the there are fewer than three noisy pixels in the level2.evt file, extra rows are filled as -1
| Pixel properties | Quadrant properties | ||||||
|---|---|---|---|---|---|---|---|
| Quadrant | DetID | PixID | Counts | Sigma | Mean | Median | Sigma |
| A | 13 | 248 | 767525 | 6490.71 | 589 | 580 | 118.2 |
| A | 10 | 83 | 462498 | 3909.24 | 589 | 580 | 118.2 |
| A | 6 | 10 | 359243 | 3035.39 | 589 | 580 | 118.2 |
| B | 5 | 255 | 42176 | 363.11 | 602 | 588 | 114.5 |
| B | 4 | 170 | 34715 | 297.97 | 602 | 588 | 114.5 |
| B | 0 | 245 | 18161 | 153.43 | 602 | 588 | 114.5 |
| C | 15 | 214 | 233477 | 1761.36 | 579 | 584 | 132.2 |
| C | 14 | 254 | 138820 | 1045.47 | 579 | 584 | 132.2 |
| C | 9 | 187 | 115394 | 868.3 | 579 | 584 | 132.2 |
| D | 12 | 227 | 2026333 | 14878.87 | 552 | 536 | 136.2 |
| D | 2 | 250 | 253111 | 1855.09 | 552 | 536 | 136.2 |
| D | 12 | 128 | 95081 | 694.4 | 552 | 536 | 136.2 |
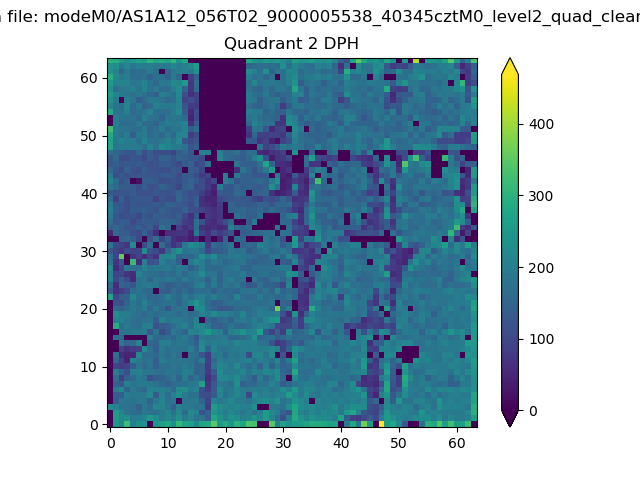
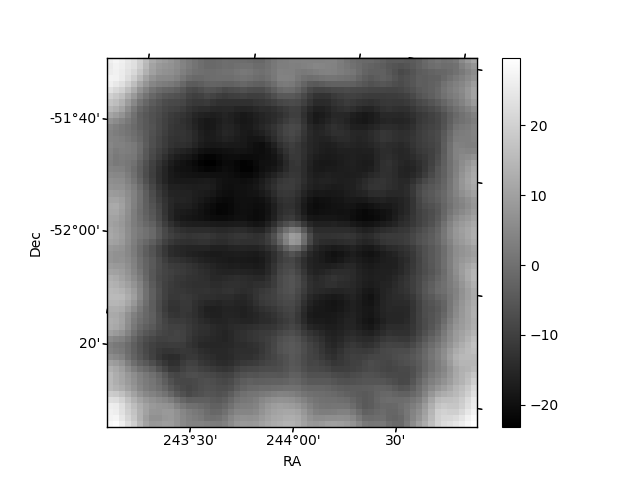
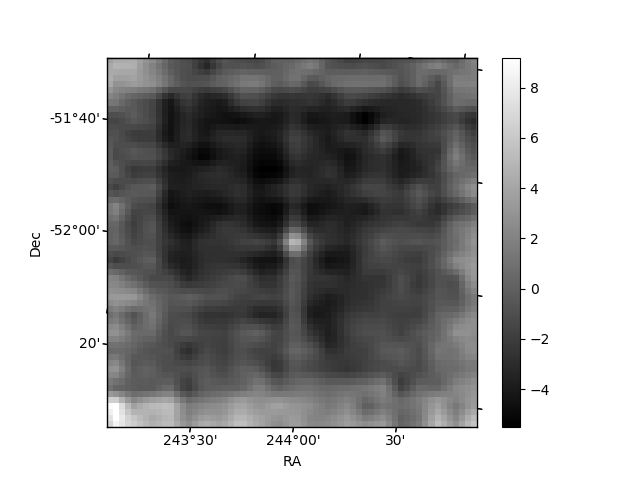
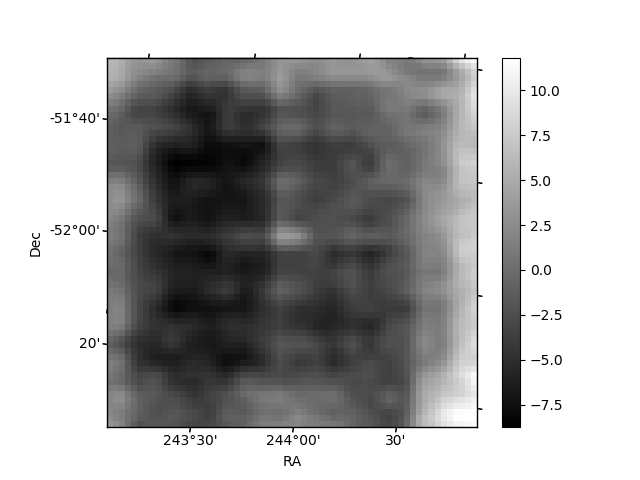
Histogram calculated using DETX and DETY for each event in the final _common_clean file
| Quadrant A | 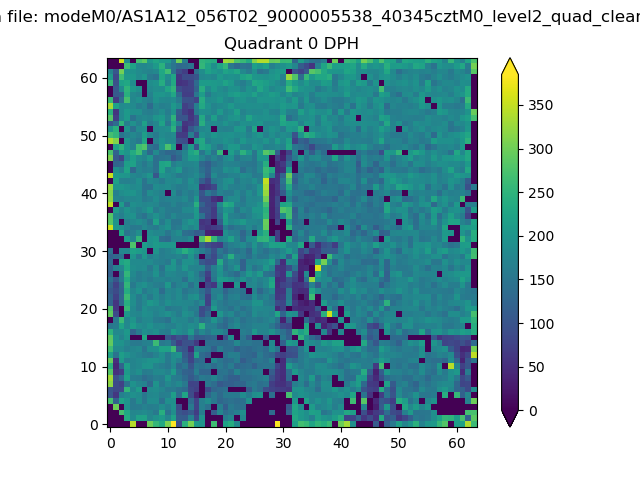 |
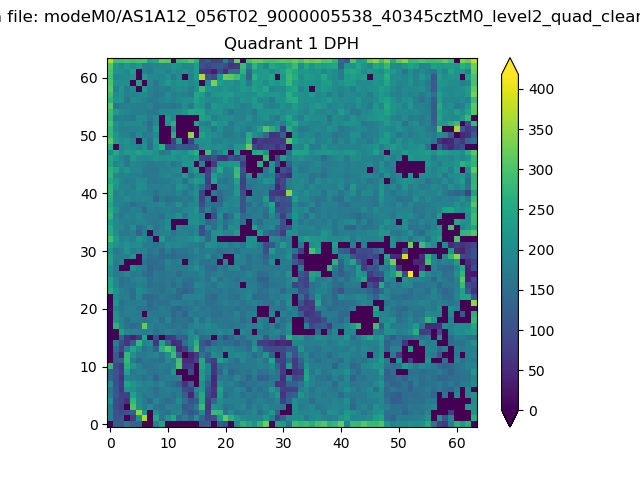 |
Quadrant B |
|---|---|---|---|
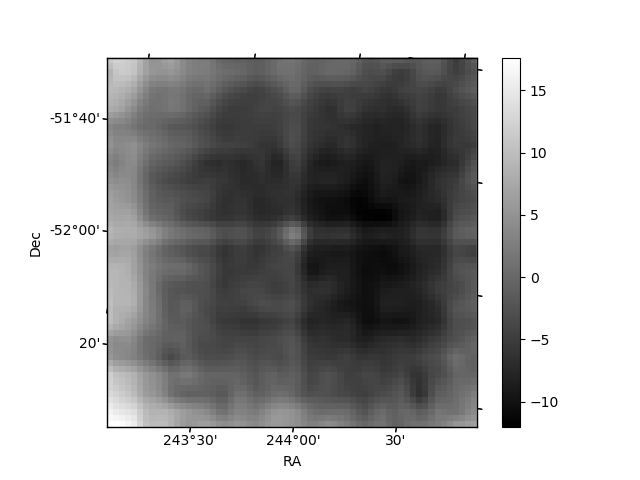
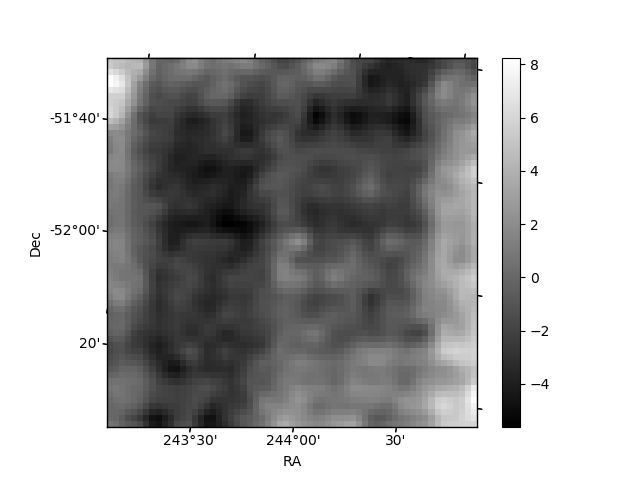
| Quadrant D | 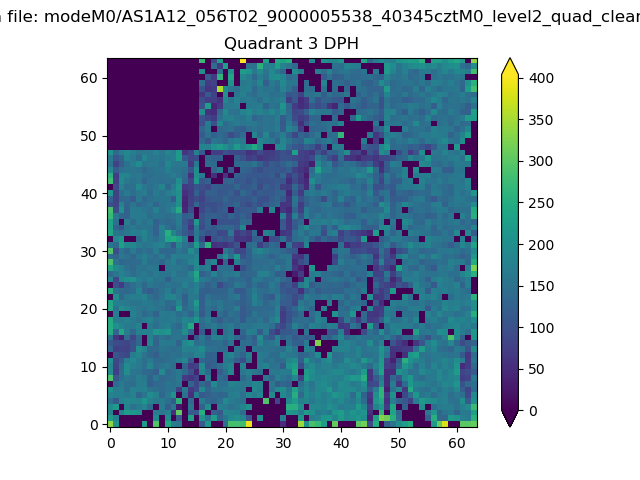 |
 |
Quadrant C |
| Plot type | Count rate plots | Images |
|---|---|---|
| Comparison with Poisson distribution Blue bars denote a histogram of data divided into 1 sec bins. Red curve is a Poisson curve with rate = median count rate of data. |
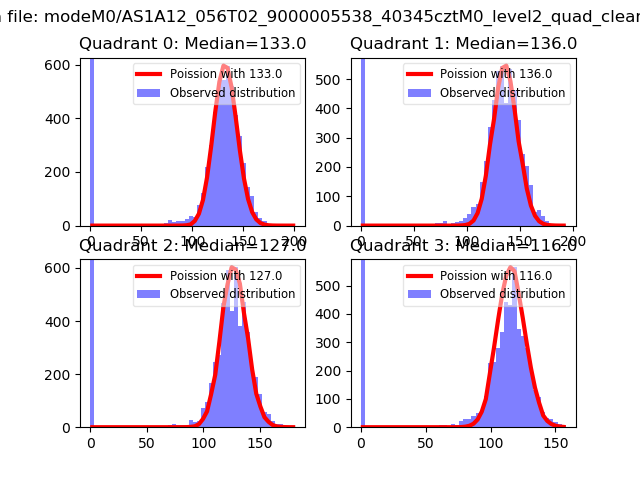 |
 |
| Quadrant-wise count rates Data is divided into 100 sec bins |
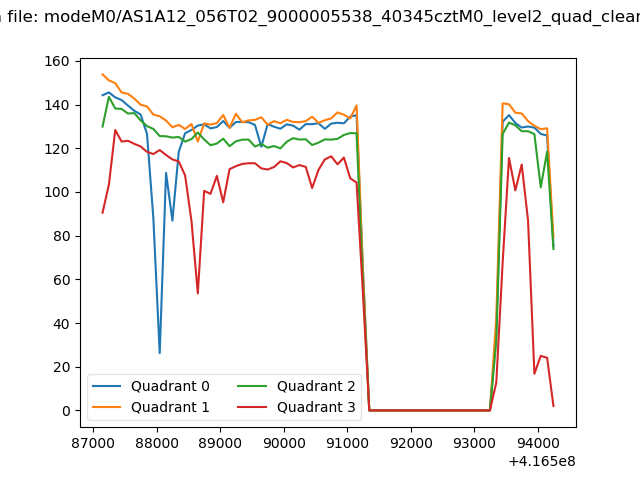 |
|
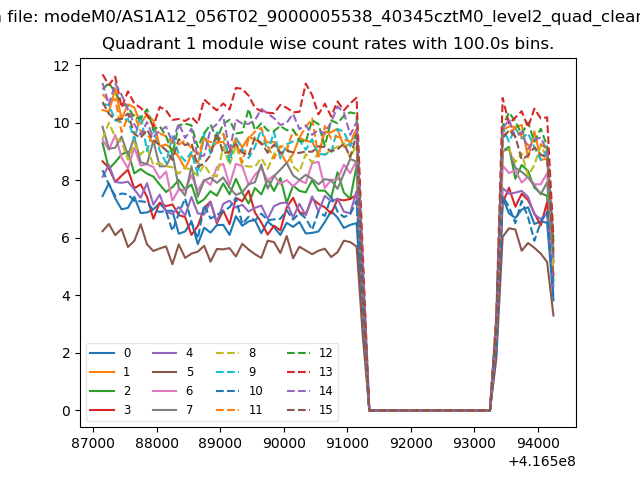
| Module-wise count rates for Quadrant A Data is divided into 100 sec bins |
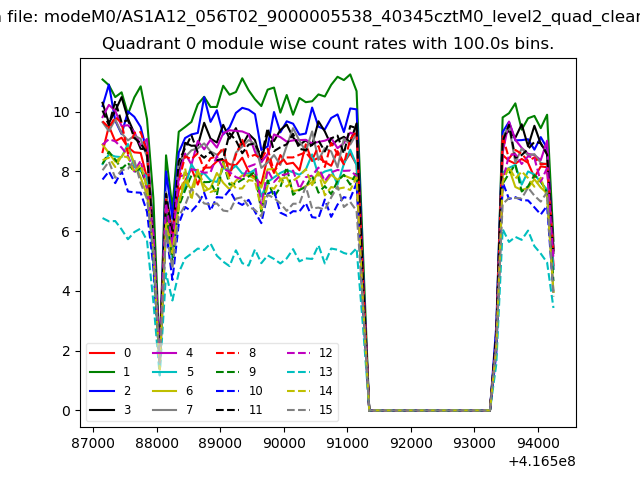 |
 |
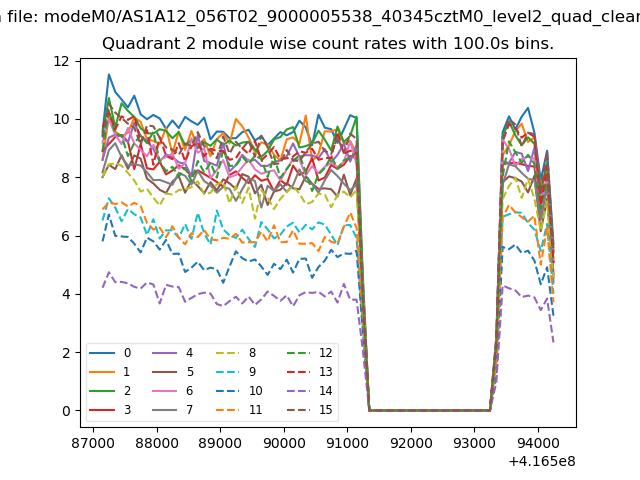
| Module-wise count rates for Quadrant B Data is divided into 100 sec bins |
 |
 |
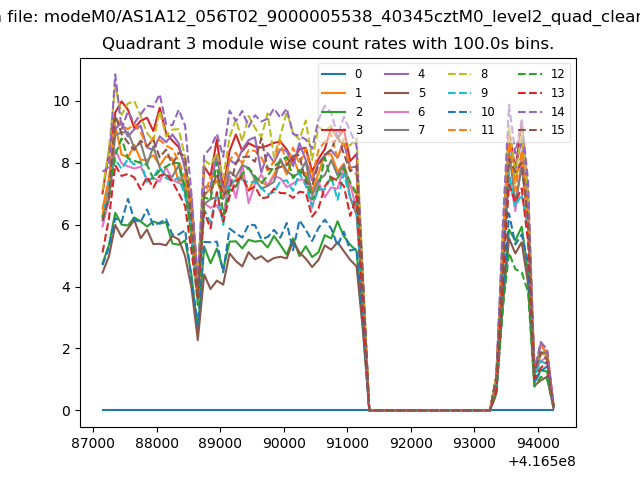
| Module-wise count rates for Quadrant C Data is divided into 100 sec bins |
 |
 |
| Module-wise count rates for Quadrant D Data is divided into 100 sec bins |
 |
 |
| Parameter | Plot |
|---|---|
| CZT HV Monitor | 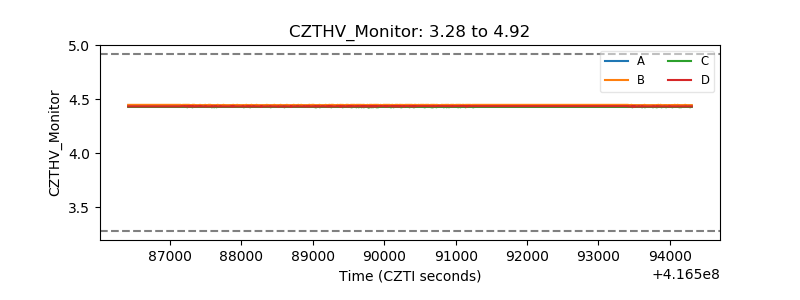 |
| D_VDD | 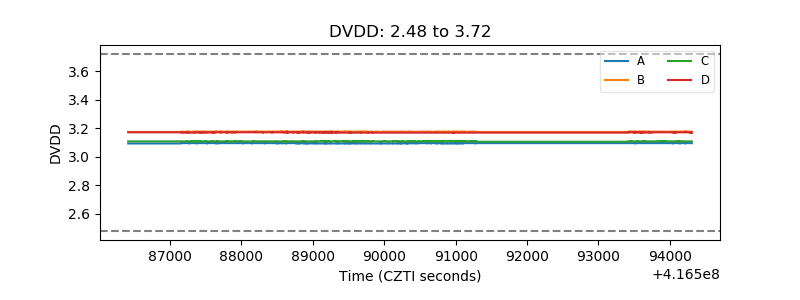 |
| Temperature 1 | 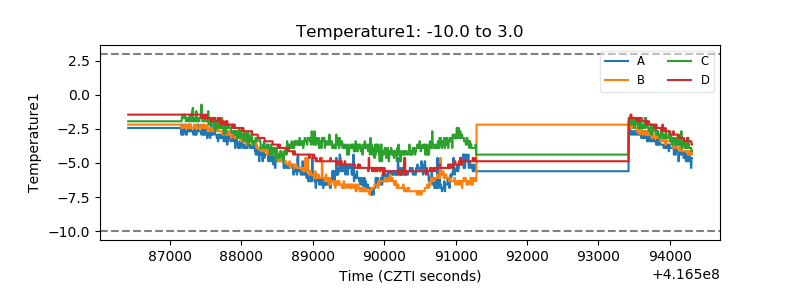 |
| Veto HV Monitor |  |
| Veto LLD | 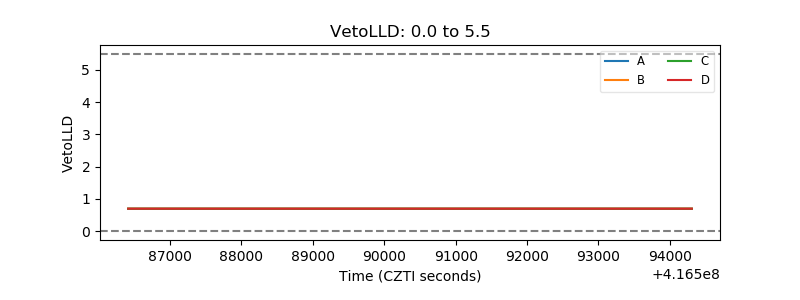 |
| Alpha Counter | 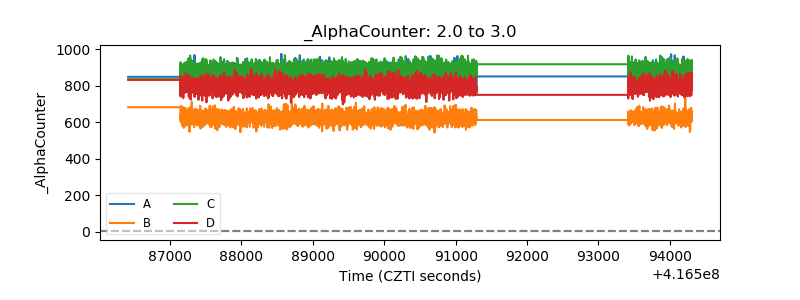 |
| _CPM_Rate | 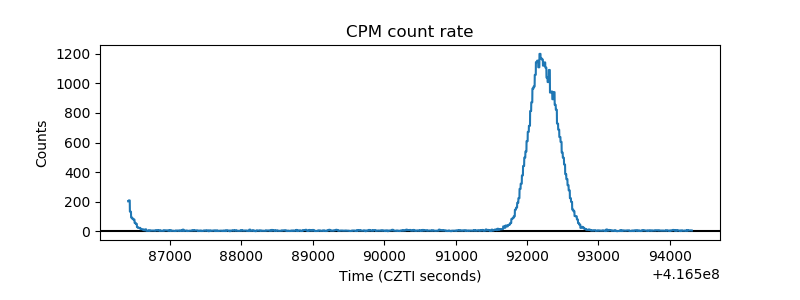 |
| CZT Counter | 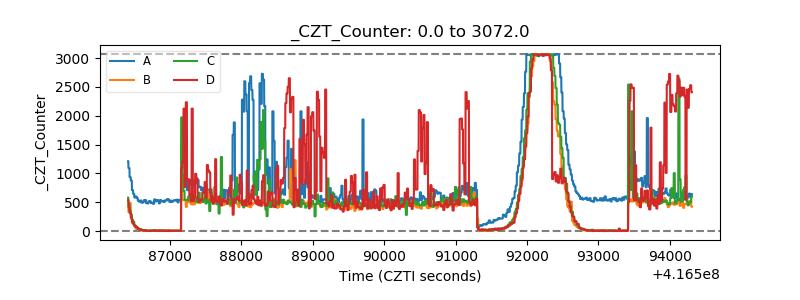 |
| +2.5 Volts monitor |  |
| +5 Volts monitor | 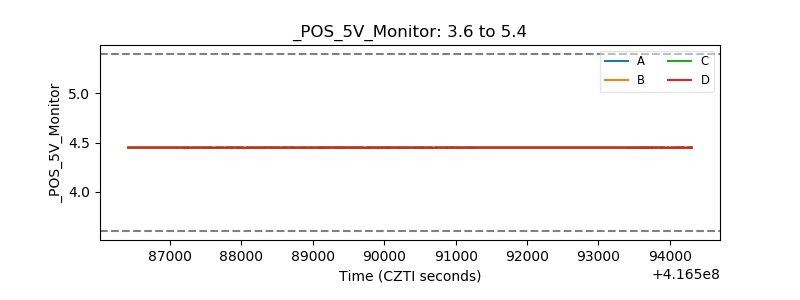 |
| _ROLL_ROT | 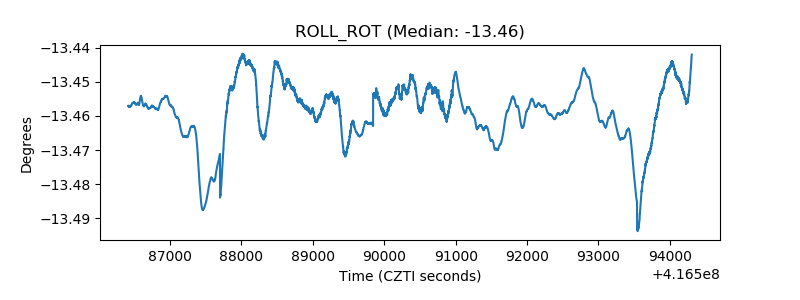 |
| _Roll_DEC | 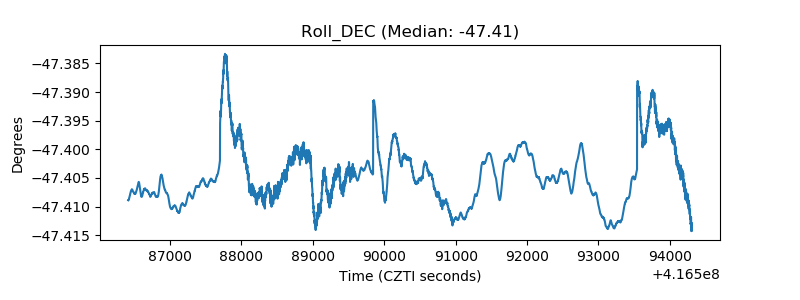 |
| _Roll_RA | 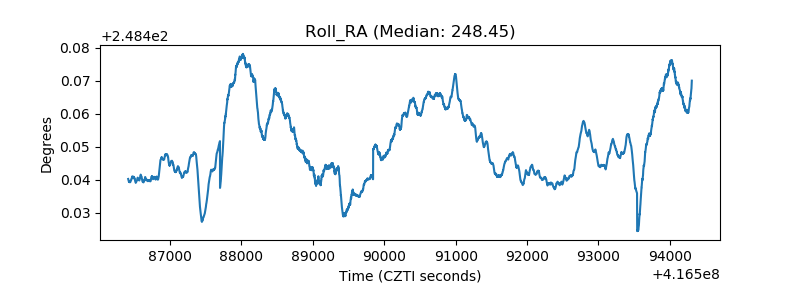 |
| Veto Counter | 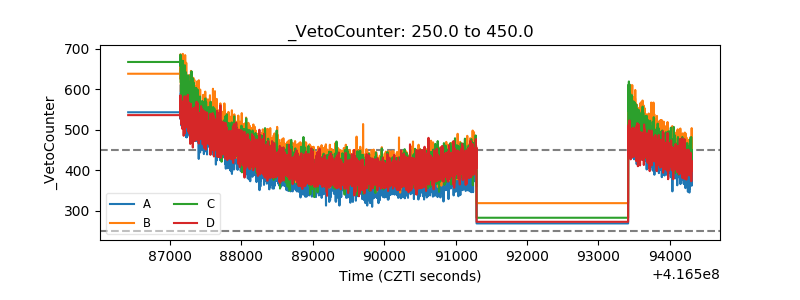 |